| Param | Original file | Final file |
|---|---|---|
| Filename | modeM0/AS1A05_075T06_9000003104_21020cztM0_level2.evt | modeM0/AS1A05_075T06_9000003104_21020cztM0_level2_quad_clean.evt |
| Size (bytes) | 461,658,240 | 94,674,240 |
| Size | 440.3 MB | 90.3 MB |
| Events in quadrant A | 3,252,343 | 607,943 |
| Events in quadrant B | 3,651,430 | 611,890 |
| Events in quadrant C | 3,273,916 | 587,531 |
| Events in quadrant D | 3,333,522 | 577,767 |
| Mode SS | |||
|---|---|---|---|
| Quadrant | BADHDUFLAG | Total packets | Discarded packets |
| A | 0 | 140 | 0 |
| B | 0 | 140 | 0 |
| C | 0 | 140 | 0 |
| D | 0 | 140 | 0 |
| Mode M9 | |||
|---|---|---|---|
| Quadrant | BADHDUFLAG | Total packets | Discarded packets |
| A | 0 | 13 | 0 |
| B | 0 | 14 | 0 |
| C | 0 | 14 | 0 |
| D | 0 | 14 | 0 |
| Mode M0 | |||
|---|---|---|---|
| Quadrant | BADHDUFLAG | Total packets | Discarded packets |
| A | 0 | 14102 | 2 |
| B | 0 | 15113 | 2 |
| C | 0 | 14120 | 2 |
| D | 0 | 14514 | 2 |
| Quadrant | Total seconds | Saturated seconds | Saturation percentage |
|---|---|---|---|
| A | 6917 | 69 | 0.997542% |
| B | 6917 | 138 | 1.995085% |
| C | 6917 | 88 | 1.272228% |
| D | 6917 | 54 | 0.780685% |
Noise dominated data is calculated using 1-second bins in cleaned event files. If a bin has >2000 counts, and if more than 50% of those come from <1% of pixels, then it is considered to be noise-dominated and hence unusable.
| Quadrant | # 1 sec bins | Bins with >0 counts | Bins with >2000 counts | High rate bins dominated by noise | Noise dominated (total time) | Noise dominated (detector-on time) | Marked lightcurve |
|---|---|---|---|---|---|---|---|
| A | 7647 | 6919 | 0 | 0 | 0.00% | 0.00% | 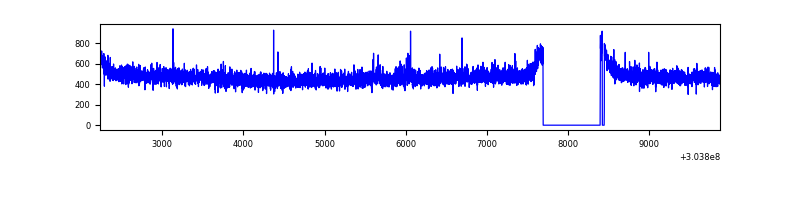 |
| B | 7647 | 6919 | 32 | 32 | 0.42% | 0.46% | 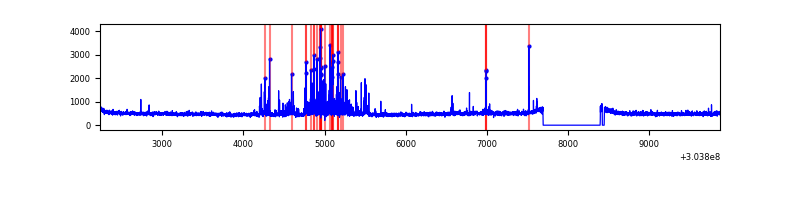 |
| C | 7647 | 6919 | 0 | 0 | 0.00% | 0.00% | 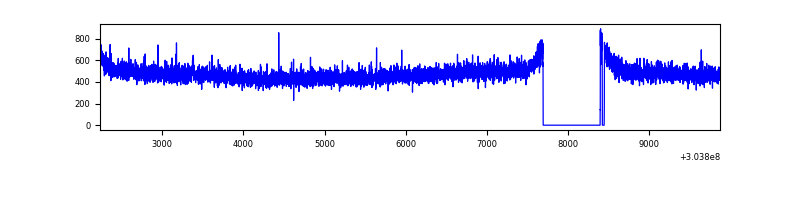 |
| D | 7647 | 6919 | 6 | 6 | 0.08% | 0.09% | 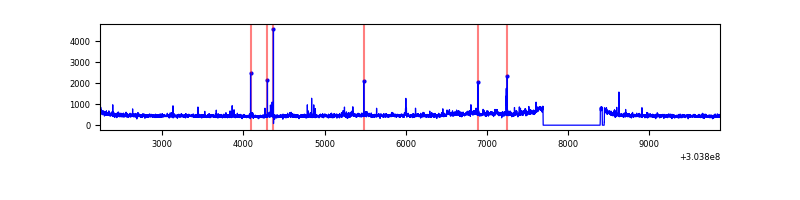 |
Top three noisy pixels from each quadrant. If the there are fewer than three noisy pixels in the level2.evt file, extra rows are filled as -1
| Pixel properties | Quadrant properties | ||||||
|---|---|---|---|---|---|---|---|
| Quadrant | DetID | PixID | Counts | Sigma | Mean | Median | Sigma |
| A | 0 | 226 | 7333 | 38.37 | 841 | 823 | 169.7 |
| A | 15 | 174 | 7326 | 38.33 | 841 | 823 | 169.7 |
| A | 13 | 254 | 7130 | 37.17 | 841 | 823 | 169.7 |
| B | 7 | 220 | 252942 | 1600.5 | 836 | 816 | 157.5 |
| B | 0 | 189 | 21118 | 128.88 | 836 | 816 | 157.5 |
| B | 3 | 64 | 20102 | 122.43 | 836 | 816 | 157.5 |
| C | 14 | 238 | 127768 | 674.71 | 804 | 807 | 188.2 |
| C | 13 | 61 | 5694 | 25.97 | 804 | 807 | 188.2 |
| C | 12 | 2 | 4829 | 21.37 | 804 | 807 | 188.2 |
| D | 1 | 20 | 154313 | 778.36 | 814 | 793 | 197.2 |
| D | 2 | 234 | 28947 | 142.74 | 814 | 793 | 197.2 |
| D | 1 | 52 | 26548 | 130.58 | 814 | 793 | 197.2 |
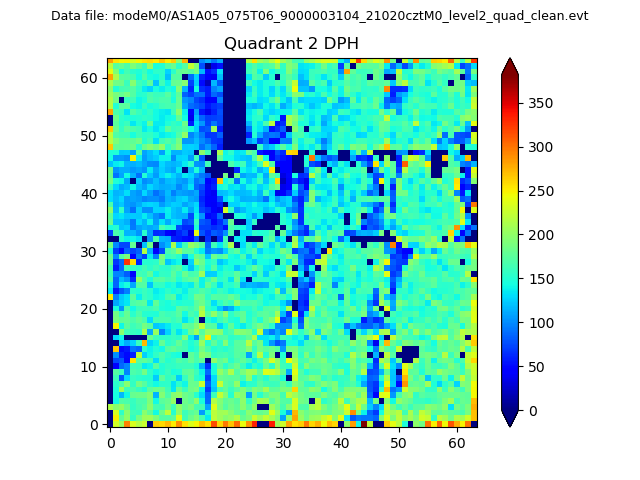
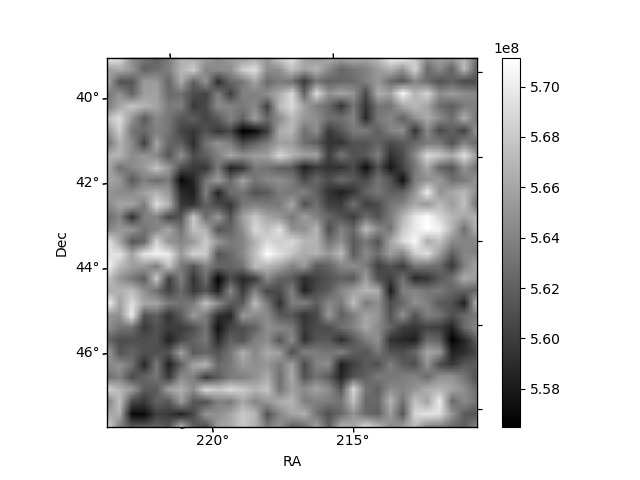
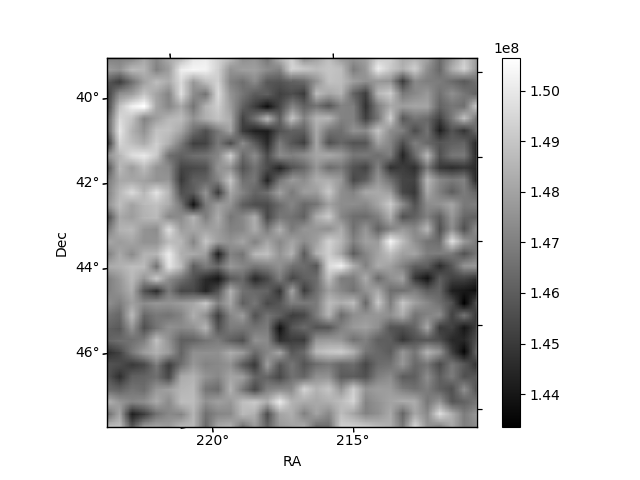
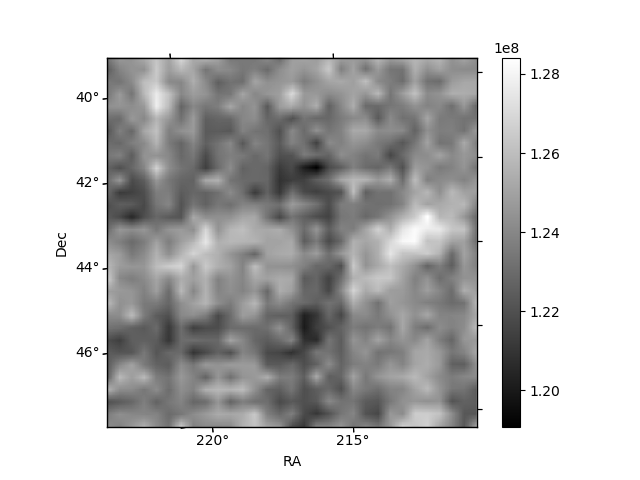
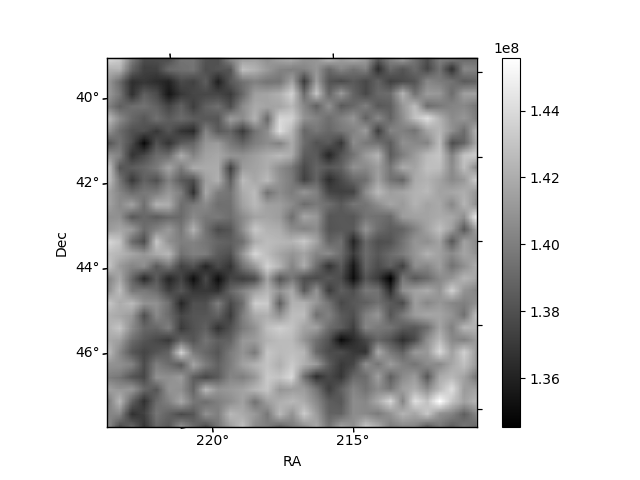
Histogram calculated using DETX and DETY for each event in the final _common_clean file
| Quadrant A | 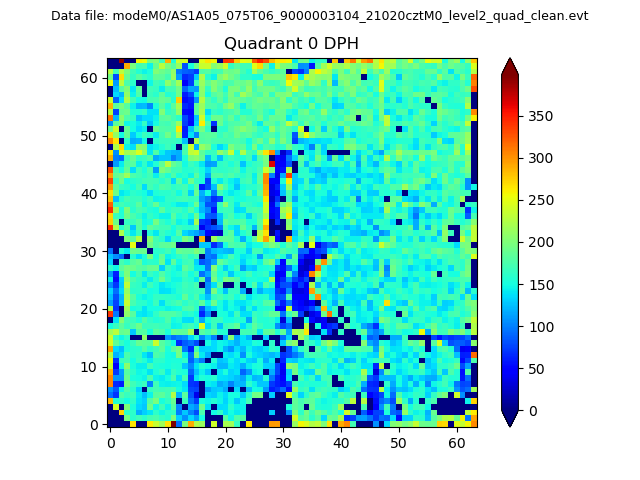 |
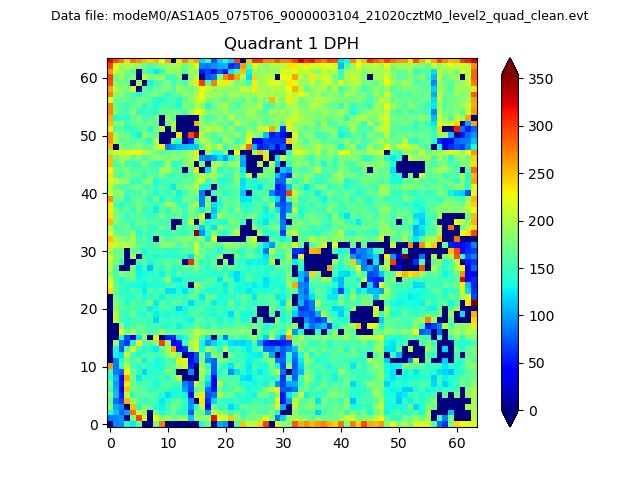 |
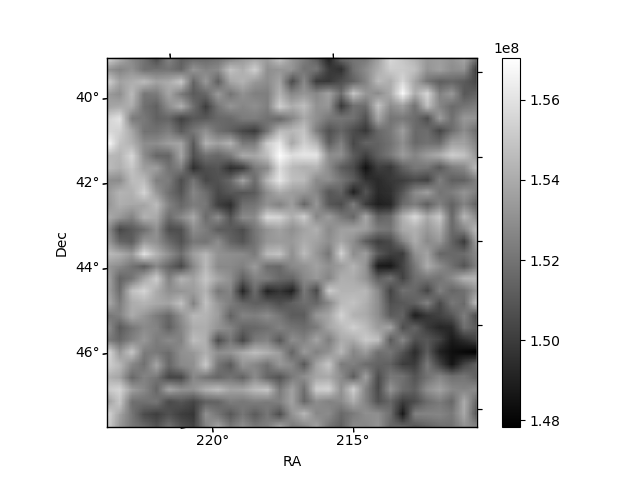
Quadrant B |
|---|---|---|---|
| Quadrant D | 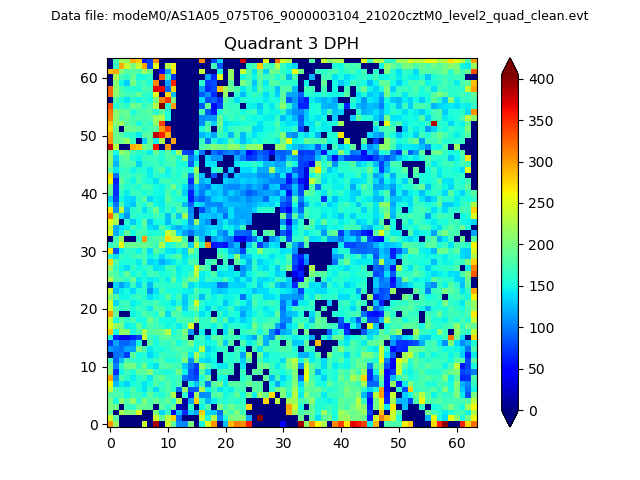 |
 |
Quadrant C |
| Plot type | Count rate plots | Images |
|---|---|---|
| Comparison with Poisson distribution Blue bars denote a histogram of data divided into 1 sec bins. Red curve is a Poisson curve with rate = median count rate of data. |
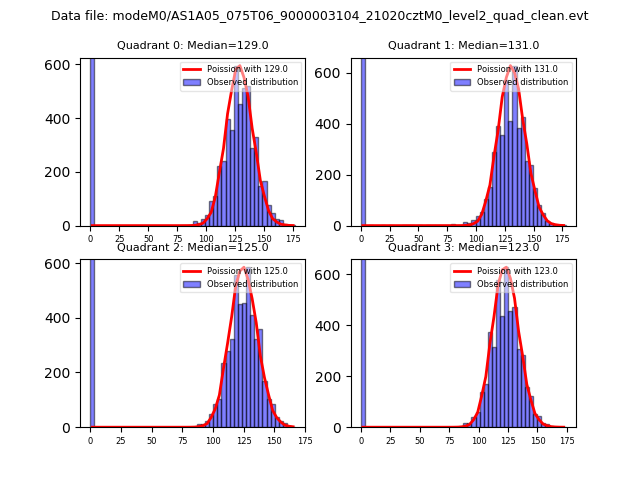 |
 |
| Quadrant-wise count rates Data is divided into 100 sec bins |
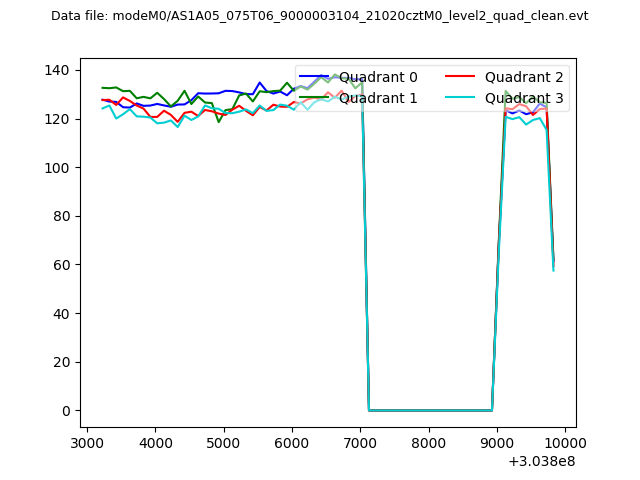 |
|
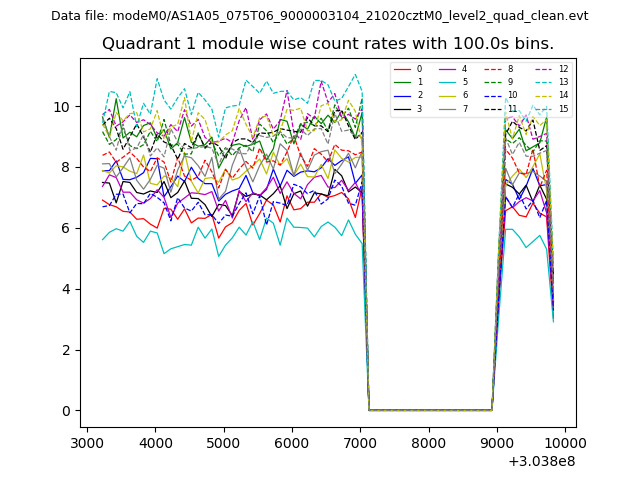
| Module-wise count rates for Quadrant A Data is divided into 100 sec bins |
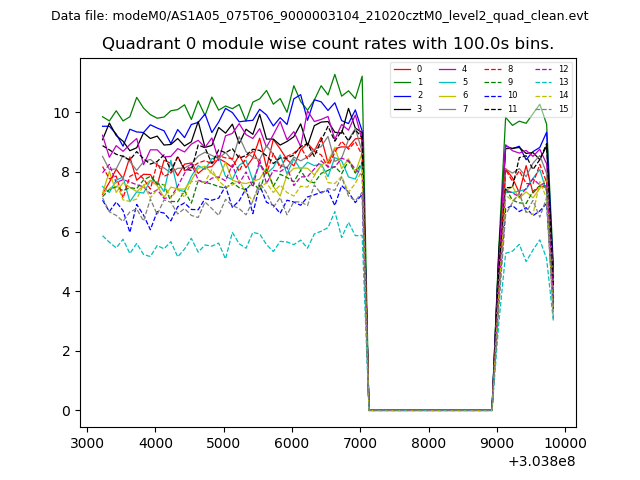 |
 |
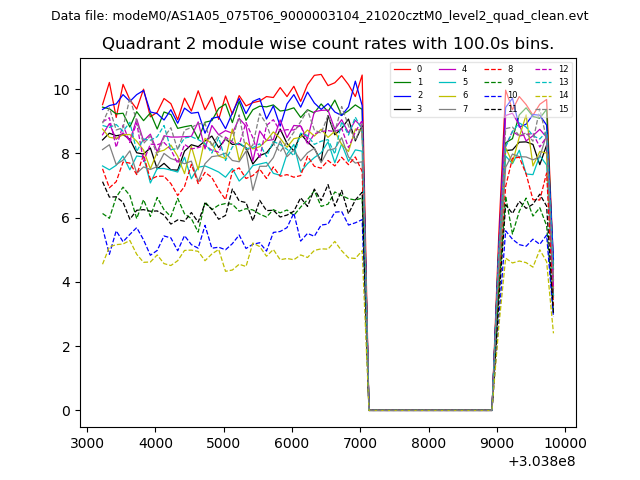
| Module-wise count rates for Quadrant B Data is divided into 100 sec bins |
 |
 |
| Module-wise count rates for Quadrant C Data is divided into 100 sec bins |
 |
 |
| Module-wise count rates for Quadrant D Data is divided into 100 sec bins |
 |
 |
| Parameter | Plot |
|---|---|
| CZT HV Monitor | 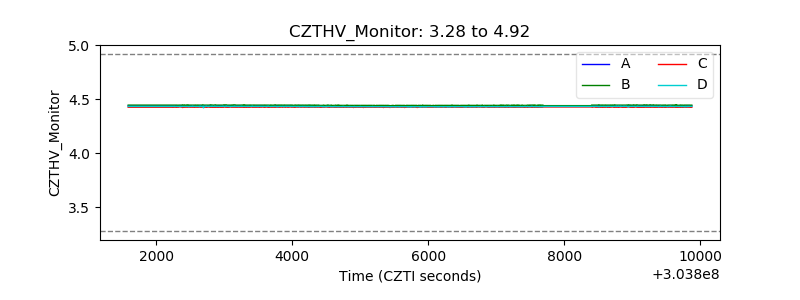 |
| D_VDD | 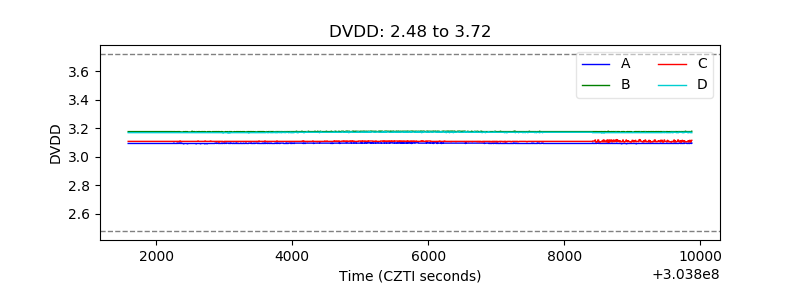 |
| Temperature 1 | 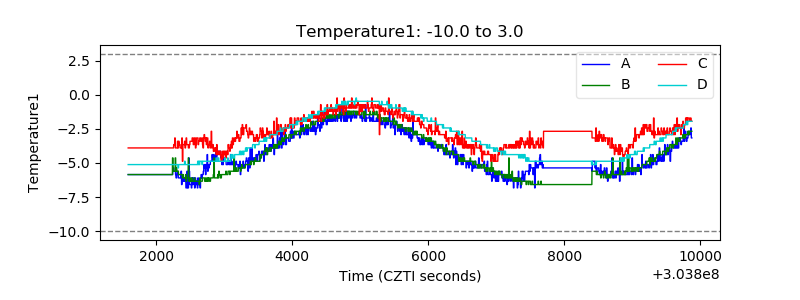 |
| Veto HV Monitor | 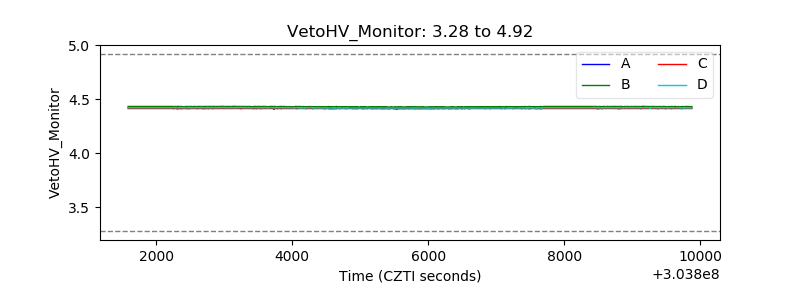 |
| Veto LLD | 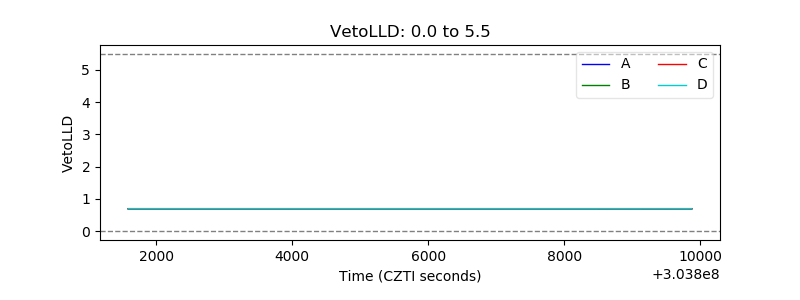 |
| Alpha Counter | 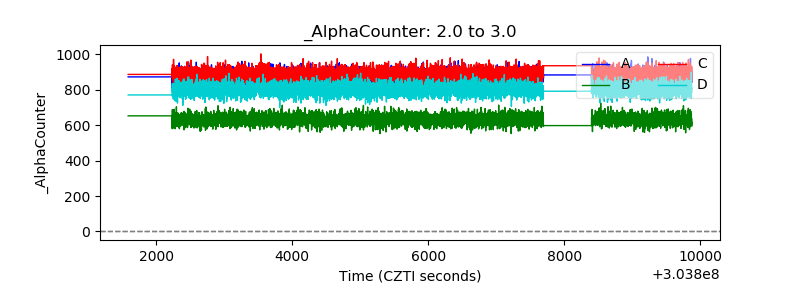 |
| _CPM_Rate | 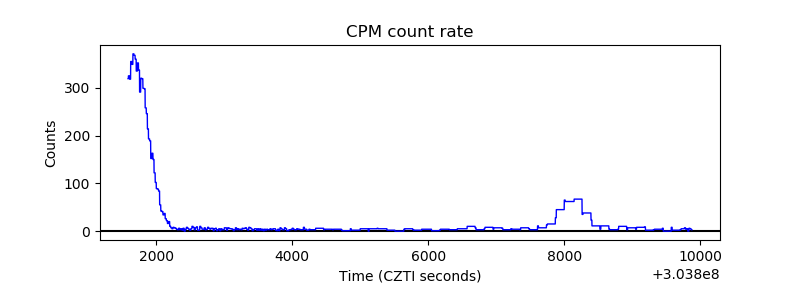 |
| CZT Counter | 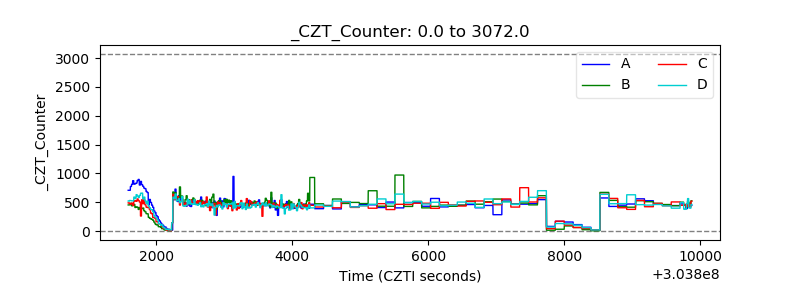 |
| +2.5 Volts monitor |  |
| +5 Volts monitor |  |
| _ROLL_ROT |  |
| _Roll_DEC | 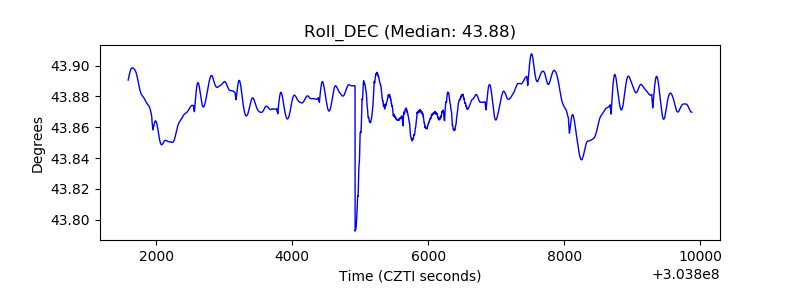 |
| _Roll_RA | 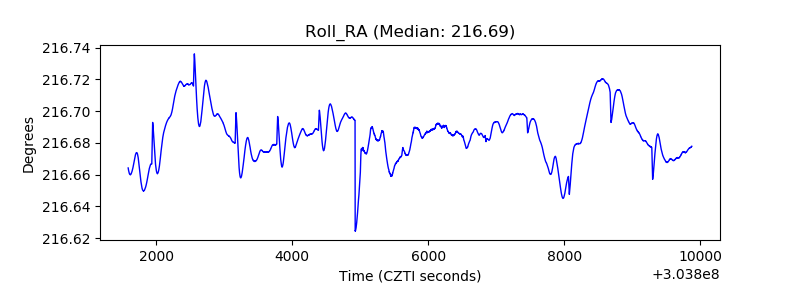 |
| Veto Counter |  |