| Param | Original file | Final file |
|---|---|---|
| Filename | modeM0/AS1A05_075T06_9000003104_21025cztM0_level2.evt | modeM0/AS1A05_075T06_9000003104_21025cztM0_level2_quad_clean.evt |
| Size (bytes) | 1,315,664,640 | 243,878,400 |
| Size | 1.2 GB | 232.6 MB |
| Events in quadrant A | 8,452,762 | 1,579,301 |
| Events in quadrant B | 9,312,265 | 1,581,090 |
| Events in quadrant C | 9,870,230 | 1,492,799 |
| Events in quadrant D | 10,967,924 | 1,467,217 |
| Mode SS | |||
|---|---|---|---|
| Quadrant | BADHDUFLAG | Total packets | Discarded packets |
| A | 0 | 374 | 0 |
| B | 0 | 374 | 0 |
| C | 0 | 374 | 0 |
| D | 0 | 374 | 0 |
| Mode M9 | |||
|---|---|---|---|
| Quadrant | BADHDUFLAG | Total packets | Discarded packets |
| A | 0 | 19 | 0 |
| B | 0 | 19 | 0 |
| C | 0 | 19 | 0 |
| D | 0 | 19 | 0 |
| Mode M0 | |||
|---|---|---|---|
| Quadrant | BADHDUFLAG | Total packets | Discarded packets |
| A | 0 | 37570 | 3 |
| B | 0 | 39638 | 3 |
| C | 0 | 41480 | 3 |
| D | 0 | 44936 | 3 |
| Quadrant | Total seconds | Saturated seconds | Saturation percentage |
|---|---|---|---|
| A | 18366 | 142 | 0.773168% |
| B | 18367 | 202 | 1.099799% |
| C | 18367 | 672 | 3.658736% |
| D | 18367 | 662 | 3.604290% |
Noise dominated data is calculated using 1-second bins in cleaned event files. If a bin has >2000 counts, and if more than 50% of those come from <1% of pixels, then it is considered to be noise-dominated and hence unusable.
| Quadrant | # 1 sec bins | Bins with >0 counts | Bins with >2000 counts | High rate bins dominated by noise | Noise dominated (total time) | Noise dominated (detector-on time) | Marked lightcurve |
|---|---|---|---|---|---|---|---|
| A | 20231 | 18369 | 4 | 4 | 0.02% | 0.02% | 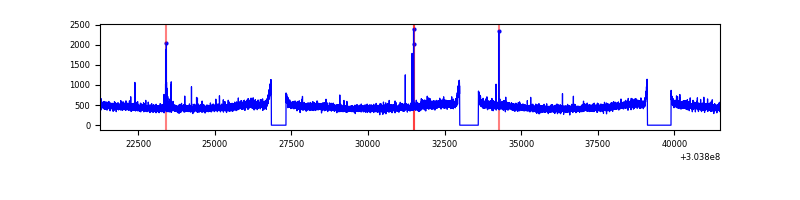 |
| B | 20232 | 18370 | 34 | 34 | 0.17% | 0.19% | 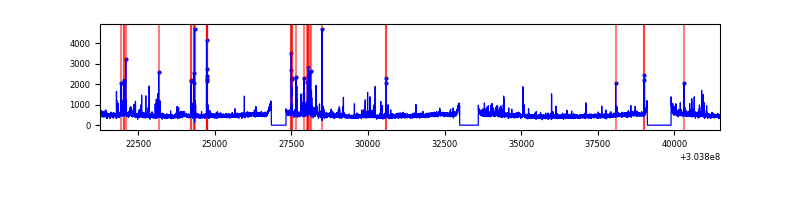 |
| C | 20232 | 18370 | 351 | 351 | 1.73% | 1.91% | 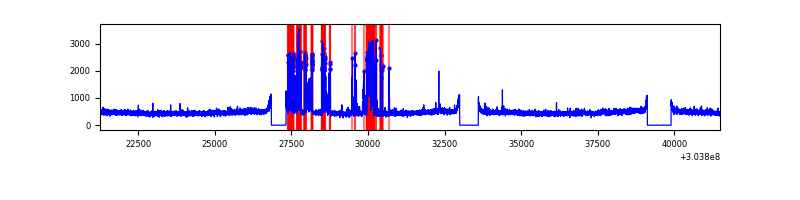 |
| D | 20232 | 18369 | 408 | 408 | 2.02% | 2.22% | 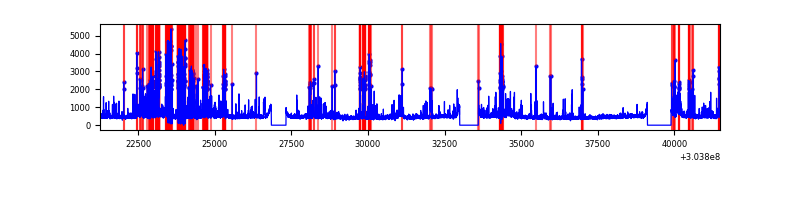 |
Top three noisy pixels from each quadrant. If the there are fewer than three noisy pixels in the level2.evt file, extra rows are filled as -1
| Pixel properties | Quadrant properties | ||||||
|---|---|---|---|---|---|---|---|
| Quadrant | DetID | PixID | Counts | Sigma | Mean | Median | Sigma |
| A | 15 | 192 | 54579 | 118.98 | 2173 | 2121 | 440.9 |
| A | 13 | 254 | 20469 | 41.61 | 2173 | 2121 | 440.9 |
| A | 0 | 226 | 19027 | 38.34 | 2173 | 2121 | 440.9 |
| B | 7 | 220 | 266588 | 646.15 | 2165 | 2109 | 409.3 |
| B | 0 | 189 | 129700 | 311.72 | 2165 | 2109 | 409.3 |
| B | 0 | 229 | 62252 | 146.93 | 2165 | 2109 | 409.3 |
| C | 9 | 54 | 1434591 | 2964.93 | 2070 | 2082 | 483.2 |
| C | 14 | 238 | 320979 | 660.03 | 2070 | 2082 | 483.2 |
| C | 10 | 91 | 39091 | 76.6 | 2070 | 2082 | 483.2 |
| D | 1 | 52 | 1966727 | 3875.93 | 2099 | 2039 | 506.9 |
| D | 1 | 20 | 225617 | 441.07 | 2099 | 2039 | 506.9 |
| D | 7 | 238 | 182418 | 355.85 | 2099 | 2039 | 506.9 |
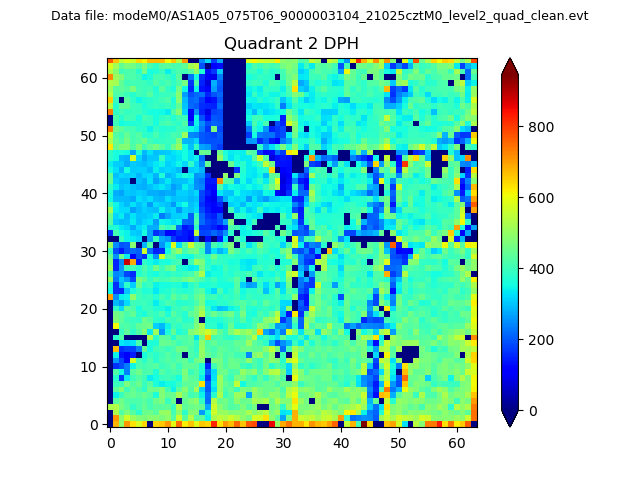
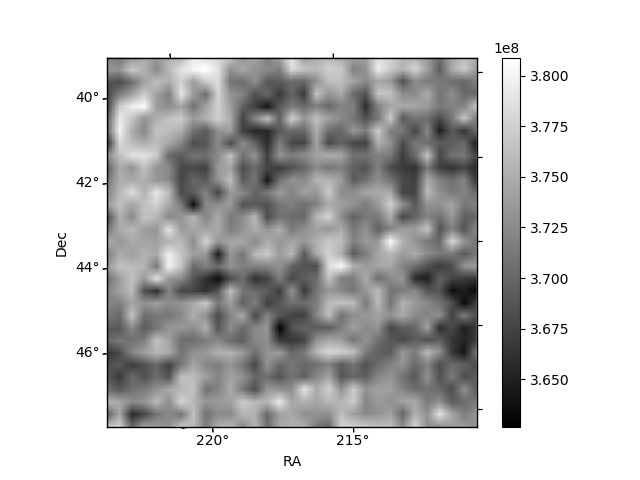
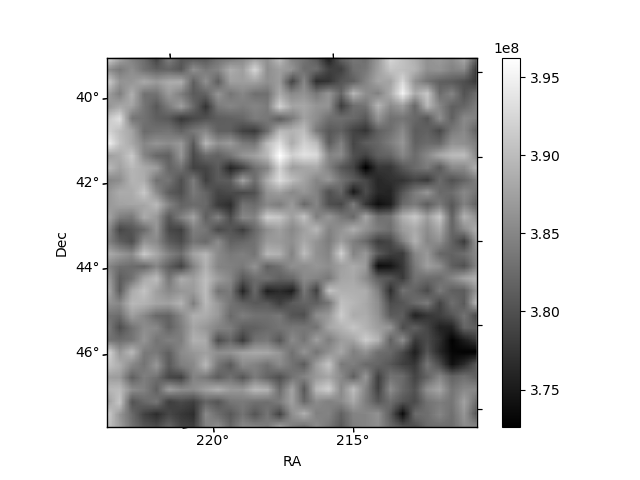
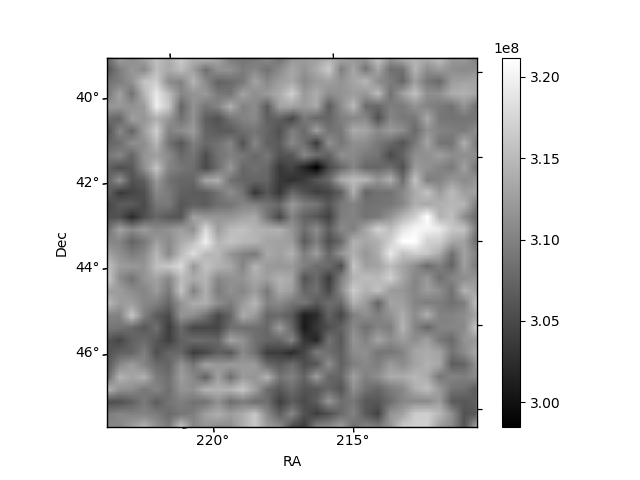
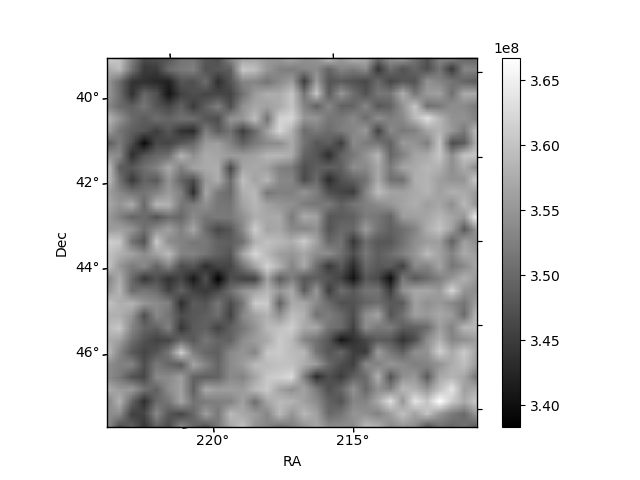
Histogram calculated using DETX and DETY for each event in the final _common_clean file
| Quadrant A | 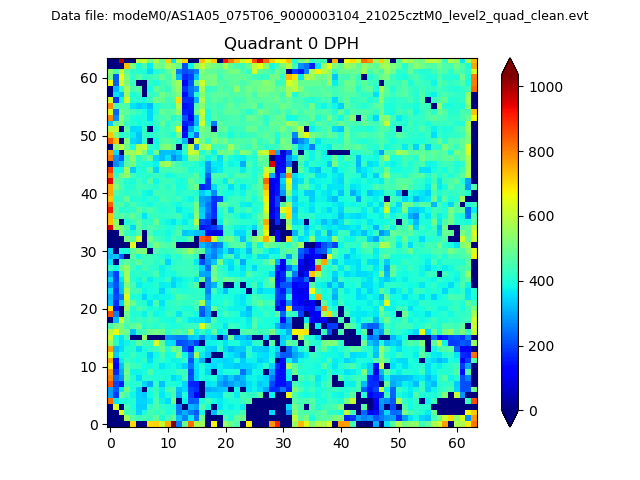 |
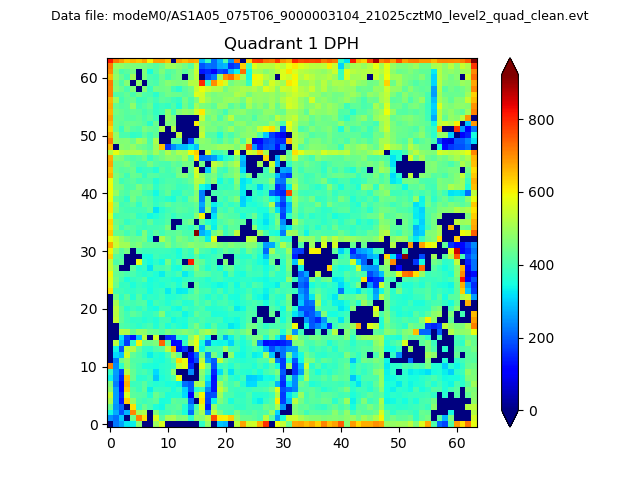 |
Quadrant B |
|---|---|---|---|
| Quadrant D | 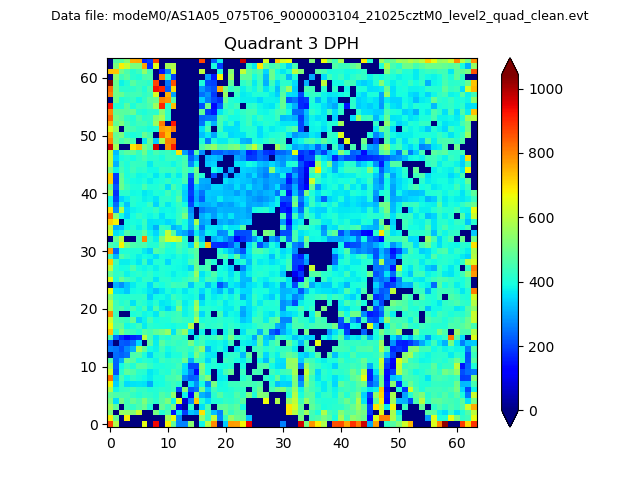 |
 |
Quadrant C |
| Plot type | Count rate plots | Images |
|---|---|---|
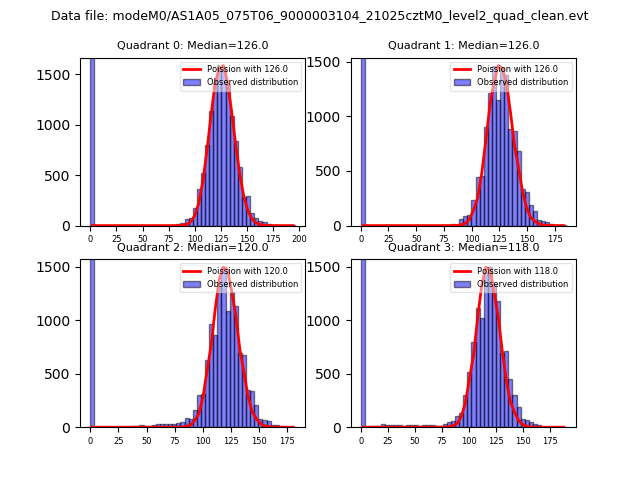
| Comparison with Poisson distribution Blue bars denote a histogram of data divided into 1 sec bins. Red curve is a Poisson curve with rate = median count rate of data. |
 |
 |
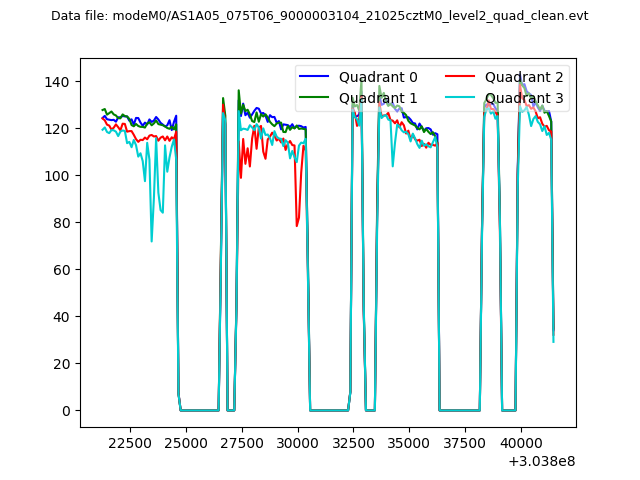
| Quadrant-wise count rates Data is divided into 100 sec bins |
 |
|
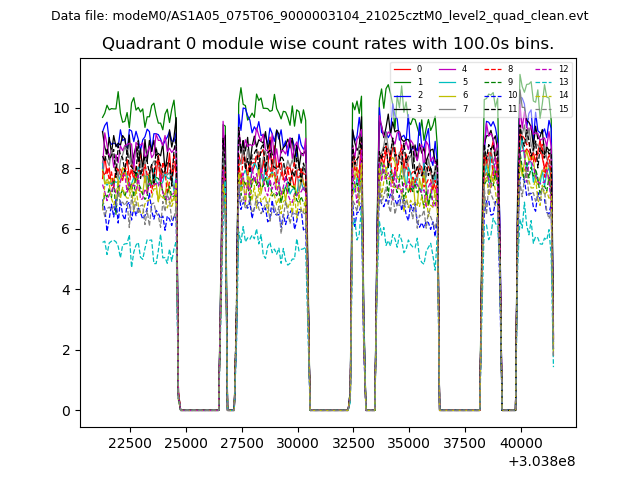
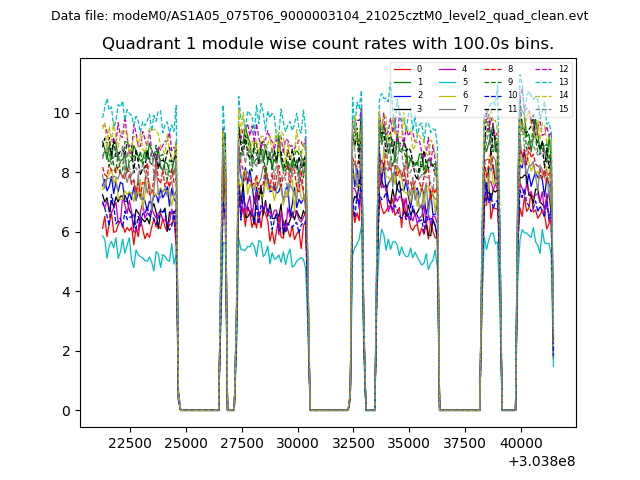
| Module-wise count rates for Quadrant A Data is divided into 100 sec bins |
 |
 |
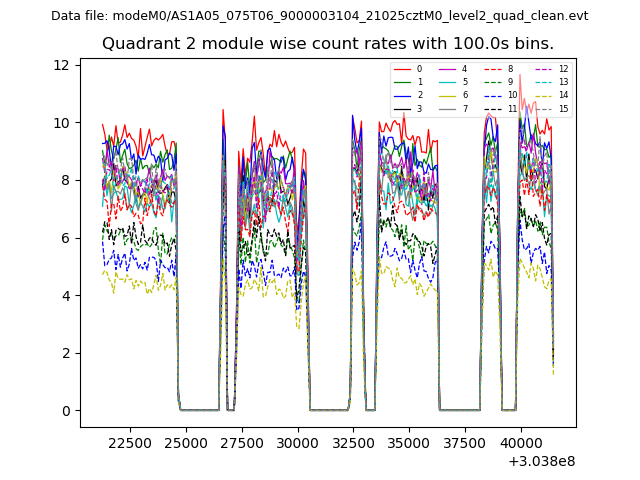
| Module-wise count rates for Quadrant B Data is divided into 100 sec bins |
 |
 |
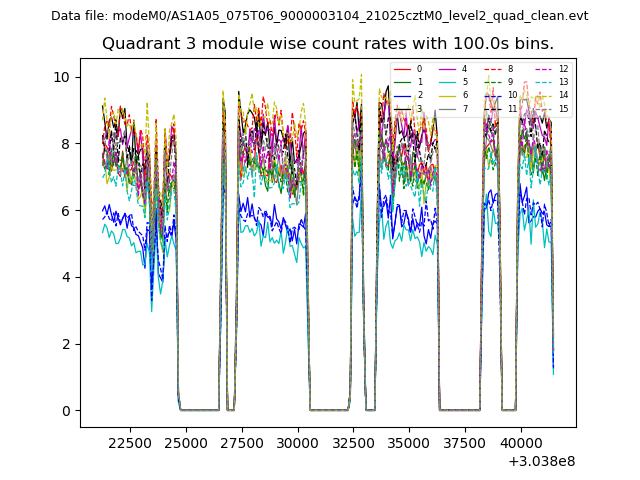
| Module-wise count rates for Quadrant C Data is divided into 100 sec bins |
 |
 |
| Module-wise count rates for Quadrant D Data is divided into 100 sec bins |
 |
 |
| Parameter | Plot |
|---|---|
| CZT HV Monitor | 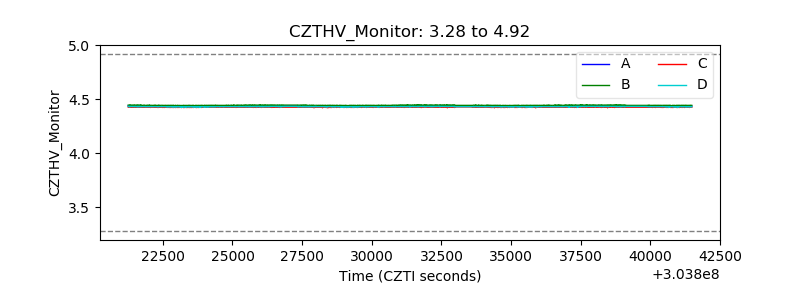 |
| D_VDD | 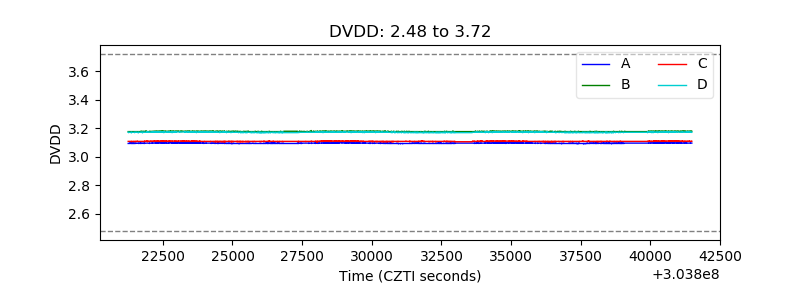 |
| Temperature 1 | 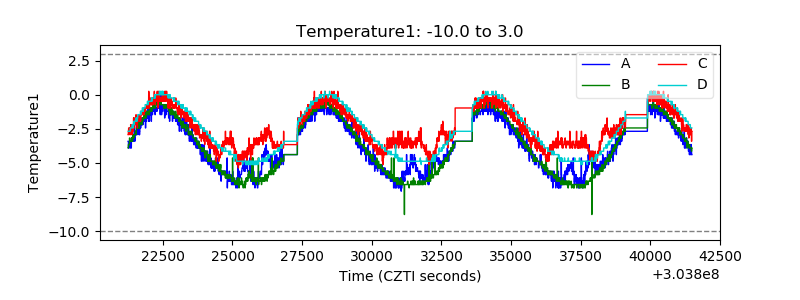 |
| Veto HV Monitor | 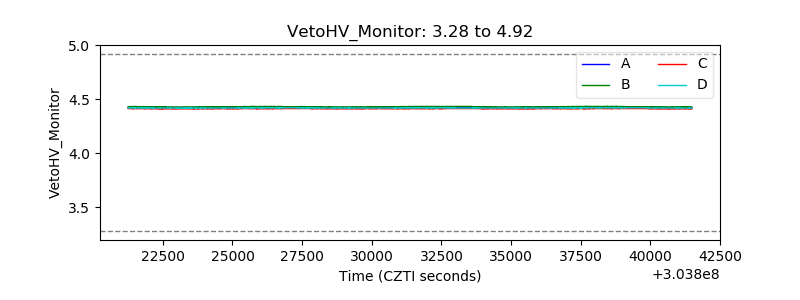 |
| Veto LLD | 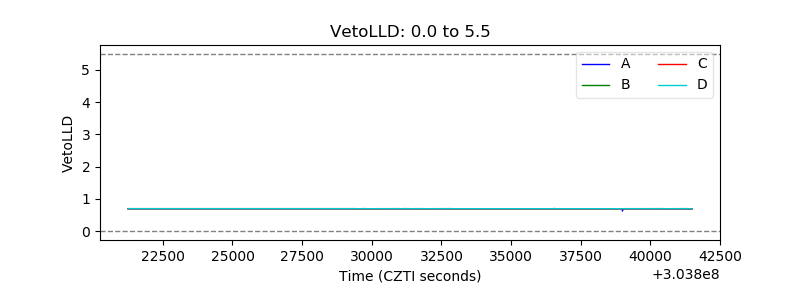 |
| Alpha Counter | 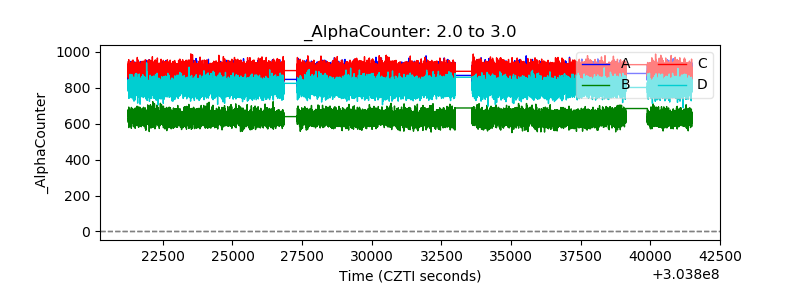 |
| _CPM_Rate | 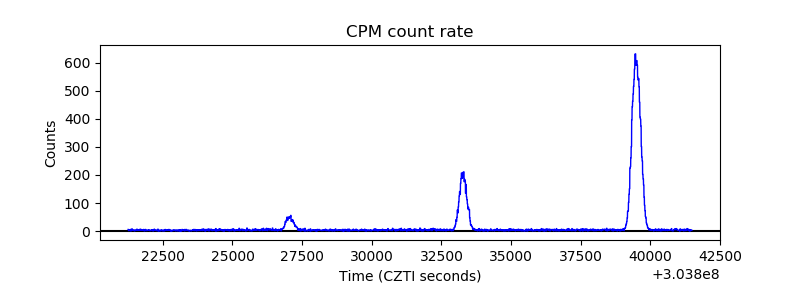 |
| CZT Counter | 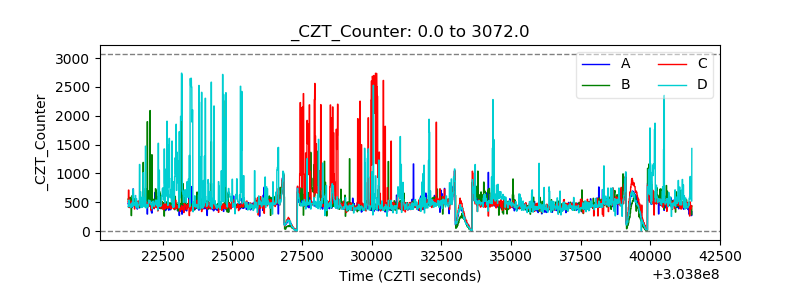 |
| +2.5 Volts monitor |  |
| +5 Volts monitor |  |
| _ROLL_ROT | 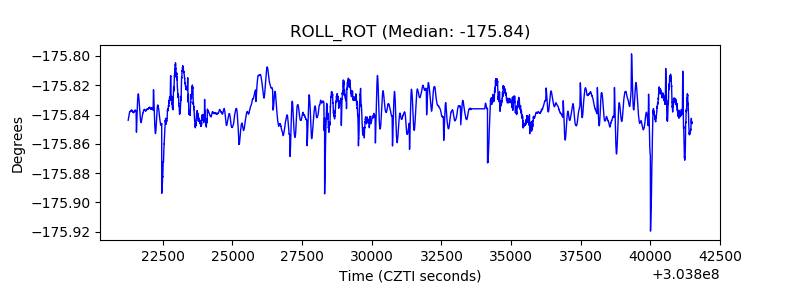 |
| _Roll_DEC | 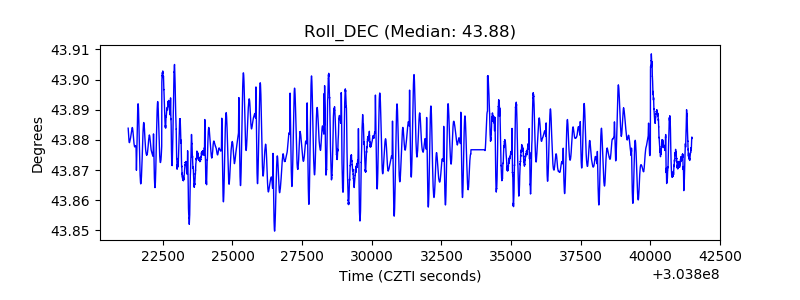 |
| _Roll_RA | 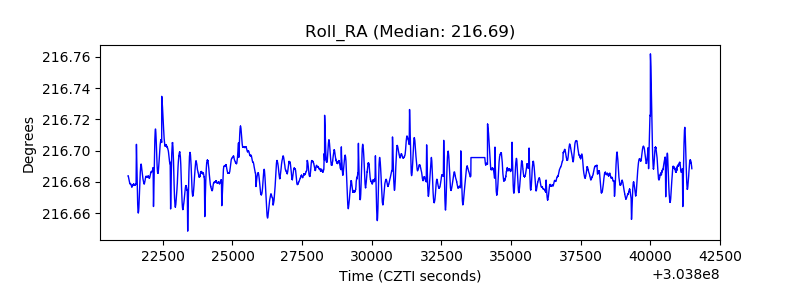 |
| Veto Counter | 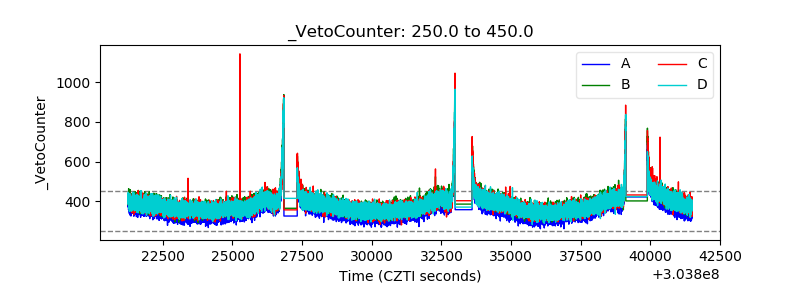 |