| Param | Original file | Final file |
|---|---|---|
| Filename | modeM0/AS1A05_075T06_9000003104_21026cztM0_level2.evt | modeM0/AS1A05_075T06_9000003104_21026cztM0_level2_quad_clean.evt |
| Size (bytes) | 463,331,520 | 92,563,200 |
| Size | 441.9 MB | 88.3 MB |
| Events in quadrant A | 2,979,563 | 602,543 |
| Events in quadrant B | 3,520,736 | 604,634 |
| Events in quadrant C | 3,115,569 | 579,934 |
| Events in quadrant D | 3,973,717 | 561,743 |
| Mode SS | |||
|---|---|---|---|
| Quadrant | BADHDUFLAG | Total packets | Discarded packets |
| A | 0 | 130 | 0 |
| B | 0 | 130 | 0 |
| C | 0 | 130 | 0 |
| D | 0 | 130 | 0 |
| Mode M9 | |||
|---|---|---|---|
| Quadrant | BADHDUFLAG | Total packets | Discarded packets |
| A | 0 | 10 | 0 |
| B | 0 | 10 | 0 |
| C | 0 | 10 | 0 |
| D | 0 | 10 | 0 |
| Mode M0 | |||
|---|---|---|---|
| Quadrant | BADHDUFLAG | Total packets | Discarded packets |
| A | 0 | 13208 | 2 |
| B | 0 | 14654 | 1 |
| C | 0 | 13437 | 1 |
| D | 0 | 16140 | 1 |
| Quadrant | Total seconds | Saturated seconds | Saturation percentage |
|---|---|---|---|
| A | 6520 | 9 | 0.138037% |
| B | 6520 | 35 | 0.536810% |
| C | 6520 | 48 | 0.736196% |
| D | 6521 | 118 | 1.809538% |
Noise dominated data is calculated using 1-second bins in cleaned event files. If a bin has >2000 counts, and if more than 50% of those come from <1% of pixels, then it is considered to be noise-dominated and hence unusable.
| Quadrant | # 1 sec bins | Bins with >0 counts | Bins with >2000 counts | High rate bins dominated by noise | Noise dominated (total time) | Noise dominated (detector-on time) | Marked lightcurve |
|---|---|---|---|---|---|---|---|
| A | 7475 | 6521 | 0 | 0 | 0.00% | 0.00% | 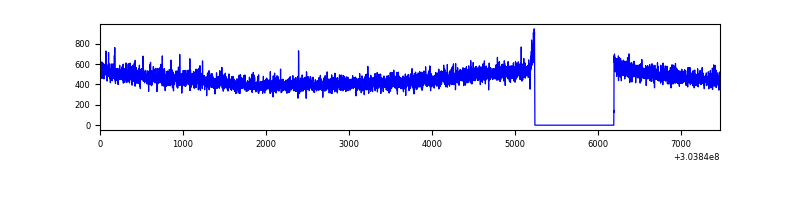 |
| B | 7475 | 6521 | 5 | 5 | 0.07% | 0.08% | 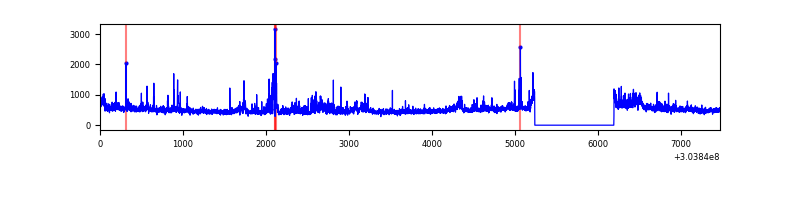 |
| C | 7475 | 6521 | 13 | 13 | 0.17% | 0.20% | 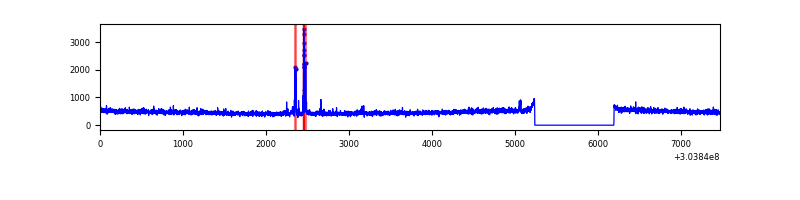 |
| D | 7476 | 6522 | 102 | 102 | 1.36% | 1.56% | 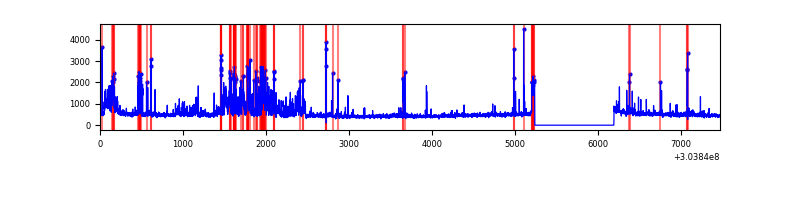 |
Top three noisy pixels from each quadrant. If the there are fewer than three noisy pixels in the level2.evt file, extra rows are filled as -1
| Pixel properties | Quadrant properties | ||||||
|---|---|---|---|---|---|---|---|
| Quadrant | DetID | PixID | Counts | Sigma | Mean | Median | Sigma |
| A | 13 | 254 | 7652 | 44.26 | 772 | 754 | 155.9 |
| A | 0 | 226 | 6627 | 37.68 | 772 | 754 | 155.9 |
| A | 3 | 137 | 6171 | 34.76 | 772 | 754 | 155.9 |
| B | 0 | 189 | 256627 | 1744.97 | 772 | 753 | 146.6 |
| B | 4 | 216 | 85491 | 577.88 | 772 | 753 | 146.6 |
| B | 7 | 220 | 35207 | 234.96 | 772 | 753 | 146.6 |
| C | 14 | 238 | 115314 | 652.97 | 747 | 751 | 175.4 |
| C | 9 | 54 | 82163 | 464.02 | 747 | 751 | 175.4 |
| C | 10 | 91 | 5604 | 27.66 | 747 | 751 | 175.4 |
| D | 1 | 239 | 649700 | 3518.35 | 754 | 732 | 184.5 |
| D | 1 | 52 | 237774 | 1285.11 | 754 | 732 | 184.5 |
| D | 13 | 172 | 44986 | 239.92 | 754 | 732 | 184.5 |
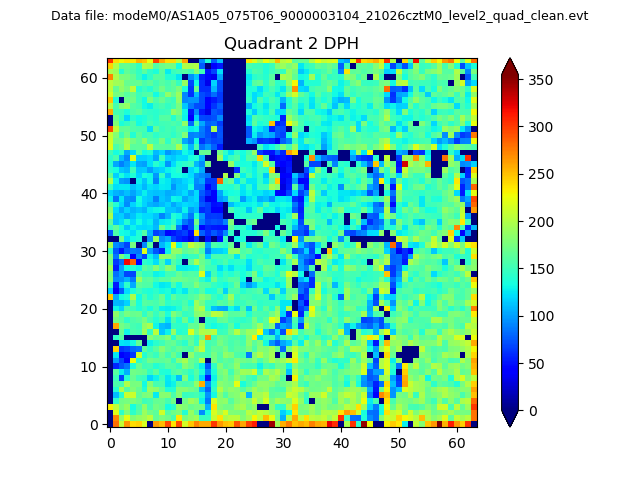
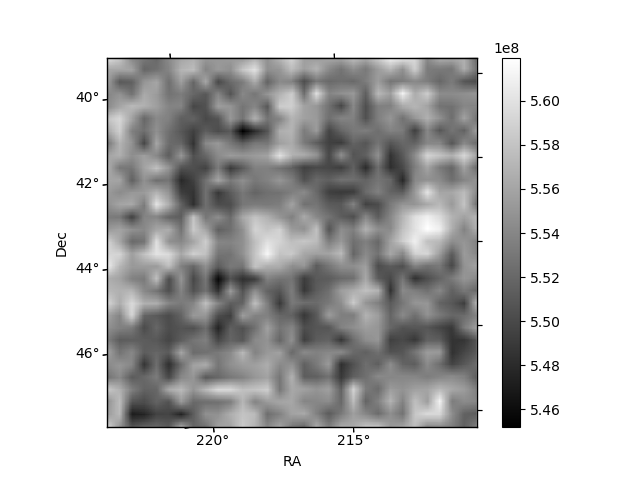
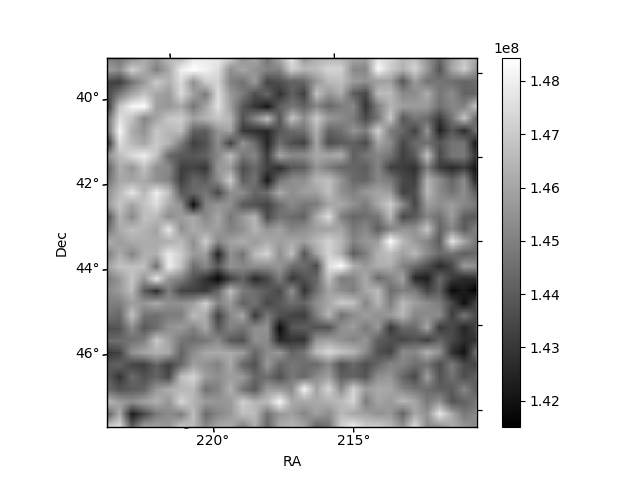
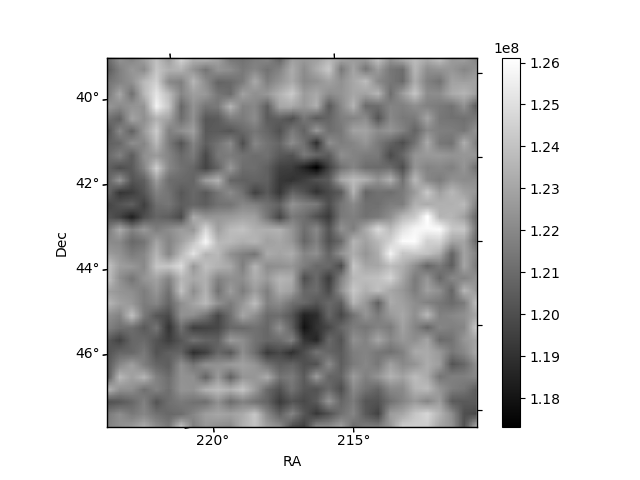
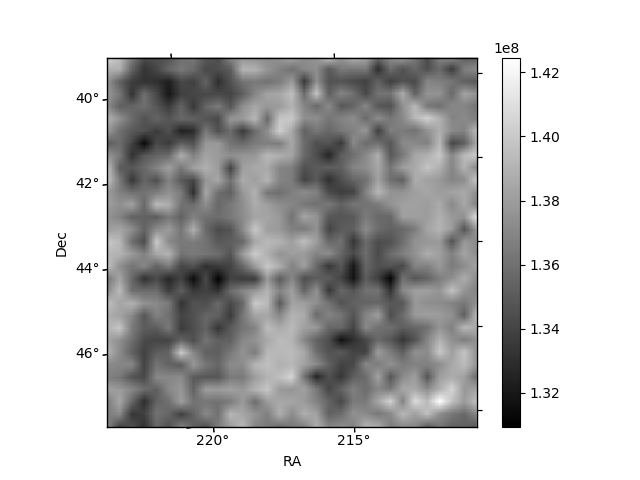
Histogram calculated using DETX and DETY for each event in the final _common_clean file
| Quadrant A | 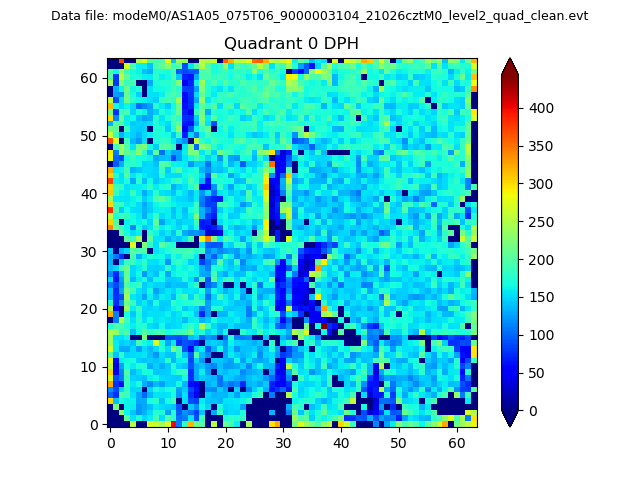 |
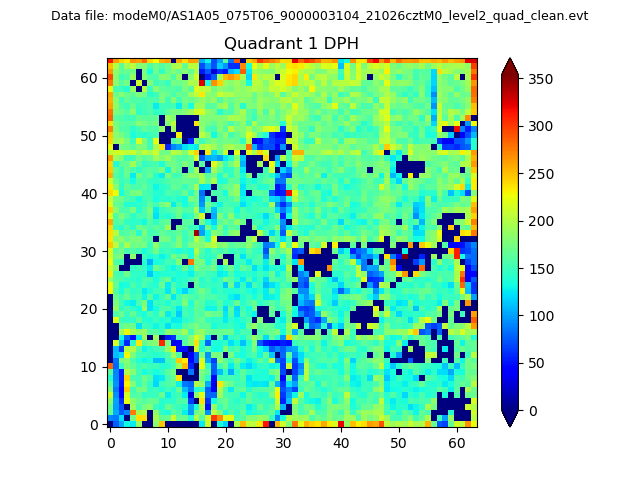 |
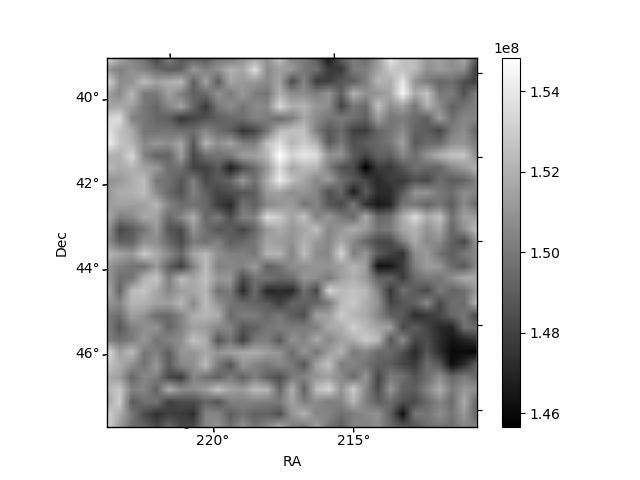
Quadrant B |
|---|---|---|---|
| Quadrant D | 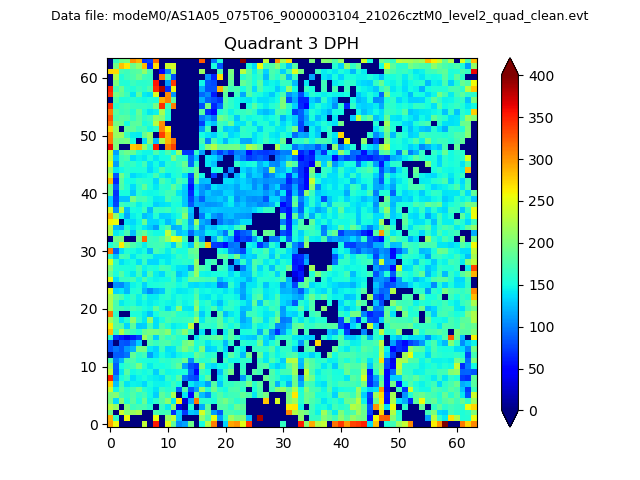 |
 |
Quadrant C |
| Plot type | Count rate plots | Images |
|---|---|---|
| Comparison with Poisson distribution Blue bars denote a histogram of data divided into 1 sec bins. Red curve is a Poisson curve with rate = median count rate of data. |
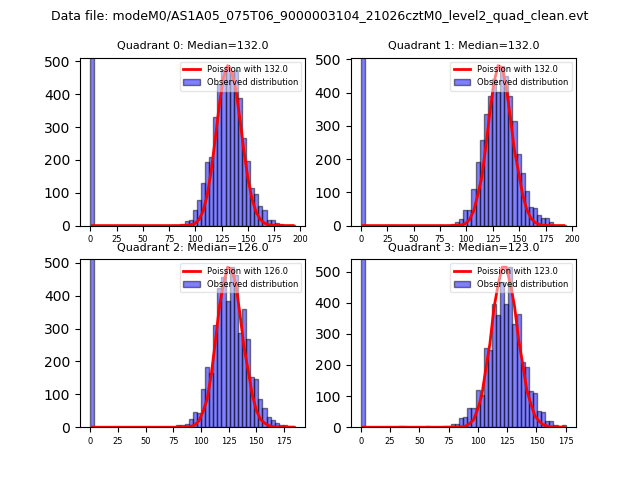 |
 |
| Quadrant-wise count rates Data is divided into 100 sec bins |
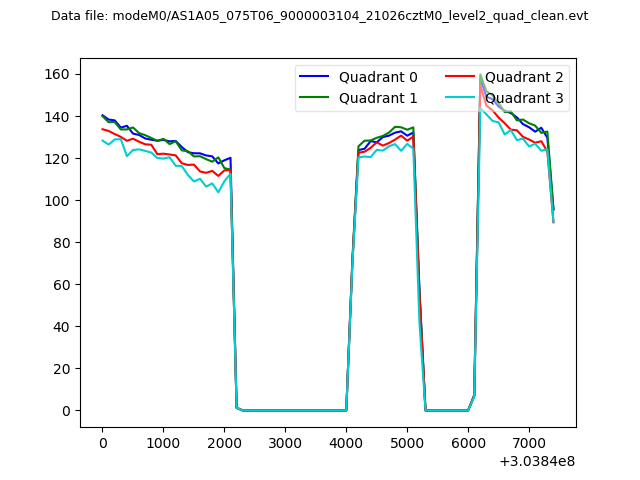 |
|
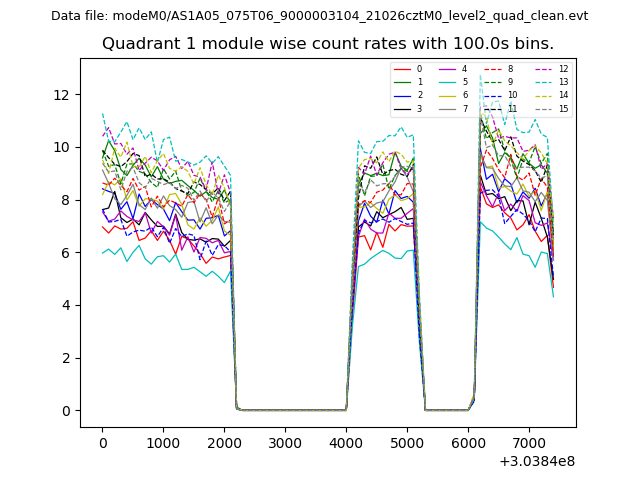
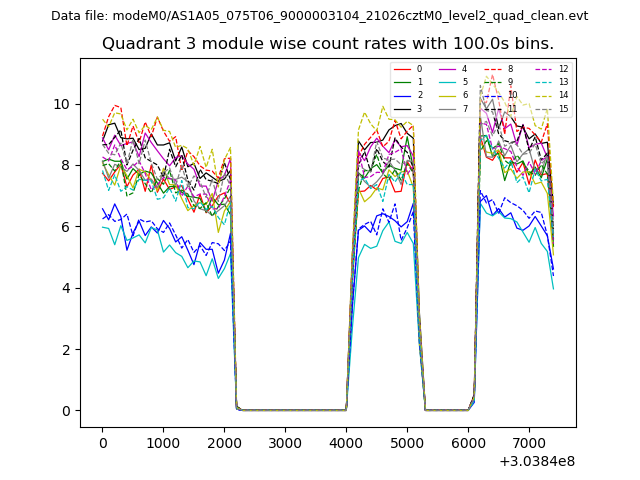
| Module-wise count rates for Quadrant A Data is divided into 100 sec bins |
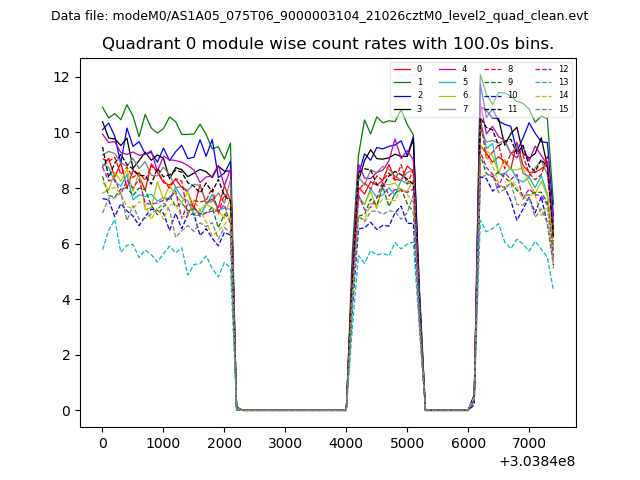 |
 |
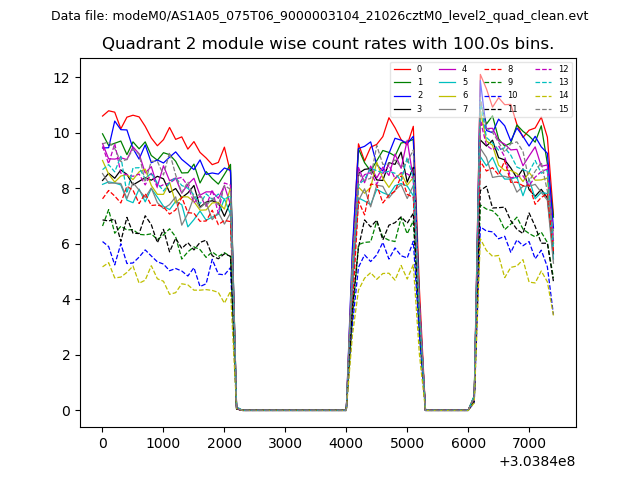
| Module-wise count rates for Quadrant B Data is divided into 100 sec bins |
 |
 |
| Module-wise count rates for Quadrant C Data is divided into 100 sec bins |
 |
 |
| Module-wise count rates for Quadrant D Data is divided into 100 sec bins |
 |
 |
| Parameter | Plot |
|---|---|
| CZT HV Monitor | 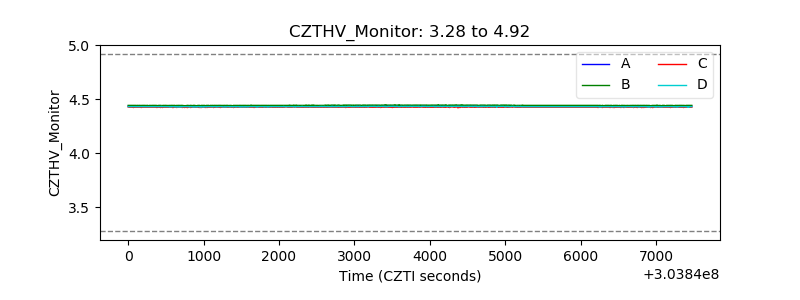 |
| D_VDD | 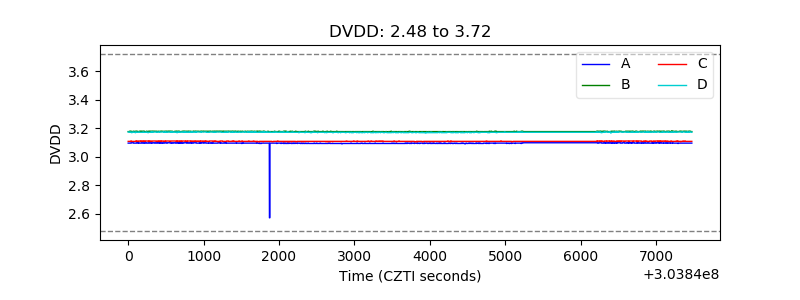 |
| Temperature 1 | 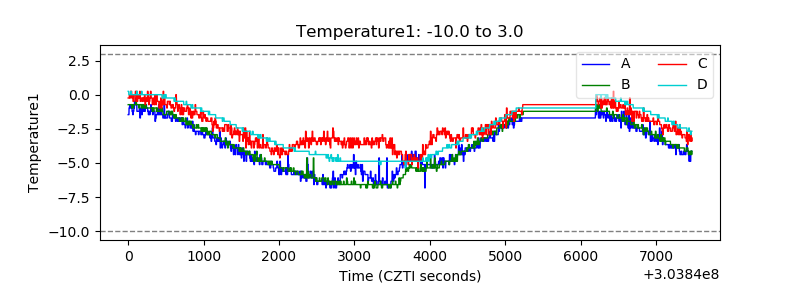 |
| Veto HV Monitor | 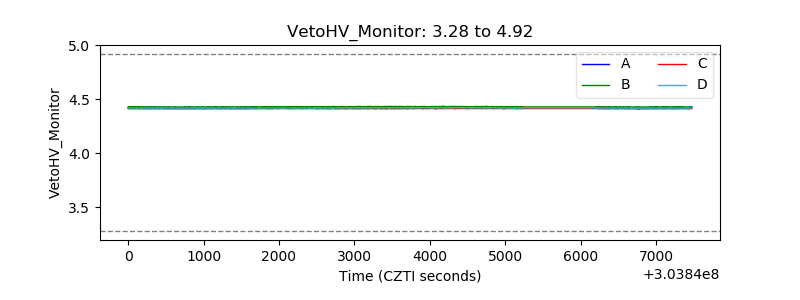 |
| Veto LLD | 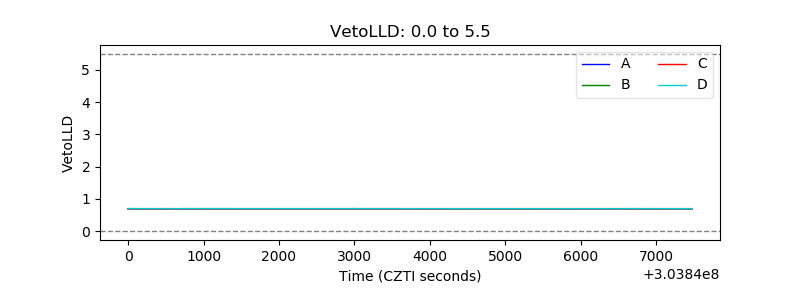 |
| Alpha Counter | 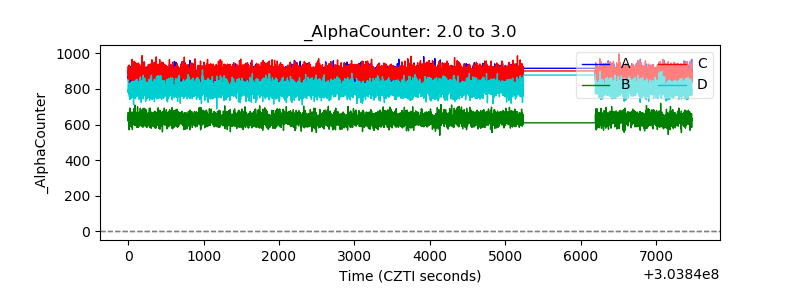 |
| _CPM_Rate | 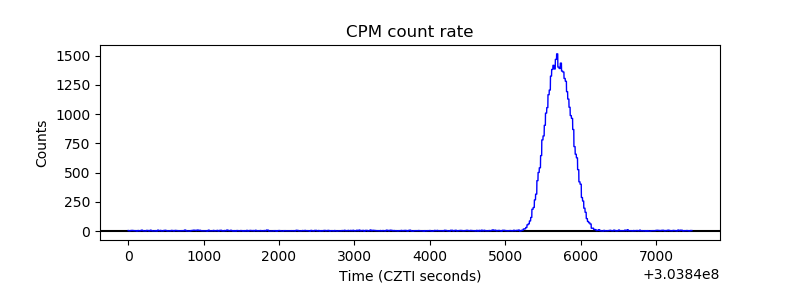 |
| CZT Counter | 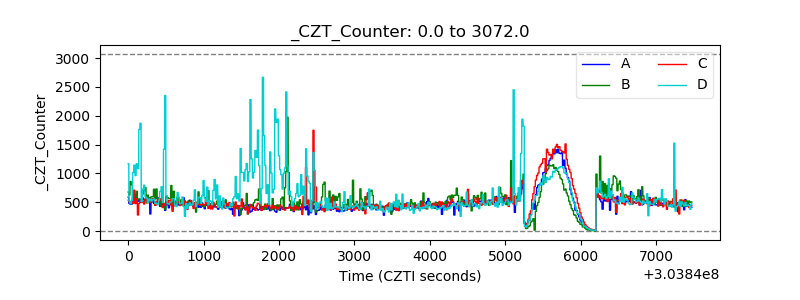 |
| +2.5 Volts monitor |  |
| +5 Volts monitor |  |
| _ROLL_ROT |  |
| _Roll_DEC | 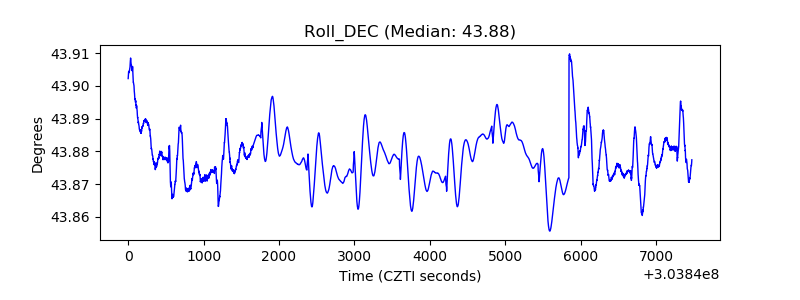 |
| _Roll_RA | 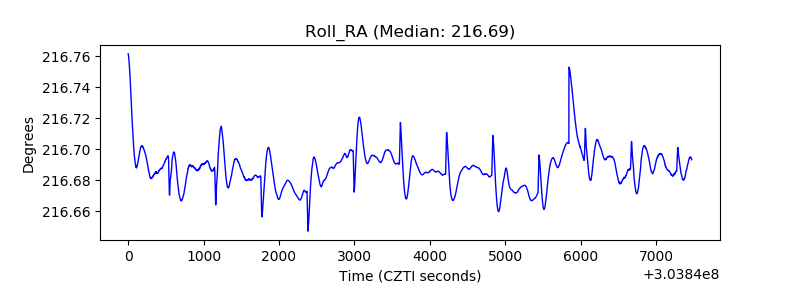 |
| Veto Counter | 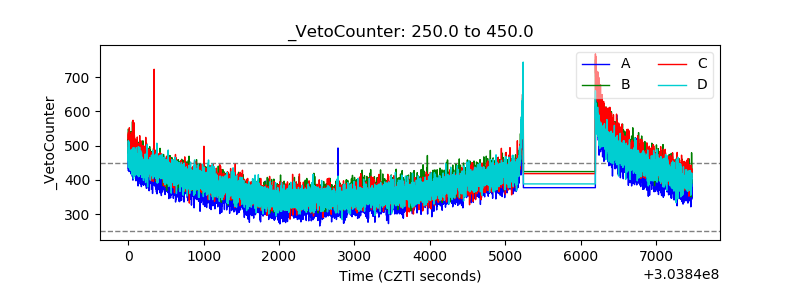 |