| Param | Original file | Final file |
|---|---|---|
| Filename | modeM0/AS1A05_075T06_9000003104_21027cztM0_level2.evt | modeM0/AS1A05_075T06_9000003104_21027cztM0_level2_quad_clean.evt |
| Size (bytes) | 420,065,280 | 86,544,000 |
| Size | 400.6 MB | 82.5 MB |
| Events in quadrant A | 2,804,749 | 559,990 |
| Events in quadrant B | 3,208,592 | 568,313 |
| Events in quadrant C | 2,864,285 | 543,680 |
| Events in quadrant D | 3,433,813 | 527,466 |
| Mode SS | |||
|---|---|---|---|
| Quadrant | BADHDUFLAG | Total packets | Discarded packets |
| A | 0 | 124 | 0 |
| B | 0 | 124 | 0 |
| C | 0 | 124 | 0 |
| D | 0 | 124 | 0 |
| Mode M9 | |||
|---|---|---|---|
| Quadrant | BADHDUFLAG | Total packets | Discarded packets |
| A | 0 | 12 | 0 |
| B | 0 | 13 | 0 |
| C | 0 | 13 | 0 |
| D | 0 | 13 | 0 |
| Mode M0 | |||
|---|---|---|---|
| Quadrant | BADHDUFLAG | Total packets | Discarded packets |
| A | 0 | 12320 | 2 |
| B | 0 | 13658 | 2 |
| C | 0 | 12403 | 2 |
| D | 0 | 14403 | 2 |
| Quadrant | Total seconds | Saturated seconds | Saturation percentage |
|---|---|---|---|
| A | 6030 | 12 | 0.199005% |
| B | 6030 | 48 | 0.796020% |
| C | 6030 | 49 | 0.812604% |
| D | 6030 | 87 | 1.442786% |
Noise dominated data is calculated using 1-second bins in cleaned event files. If a bin has >2000 counts, and if more than 50% of those come from <1% of pixels, then it is considered to be noise-dominated and hence unusable.
| Quadrant | # 1 sec bins | Bins with >0 counts | Bins with >2000 counts | High rate bins dominated by noise | Noise dominated (total time) | Noise dominated (detector-on time) | Marked lightcurve |
|---|---|---|---|---|---|---|---|
| A | 7125 | 6030 | 0 | 0 | 0.00% | 0.00% | 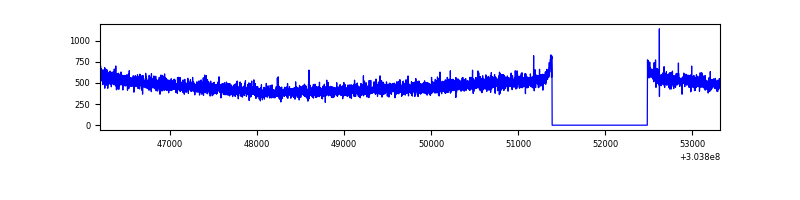 |
| B | 7125 | 6030 | 9 | 9 | 0.13% | 0.15% | 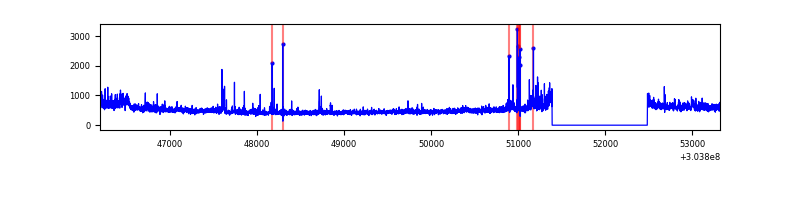 |
| C | 7125 | 6030 | 0 | 0 | 0.00% | 0.00% | 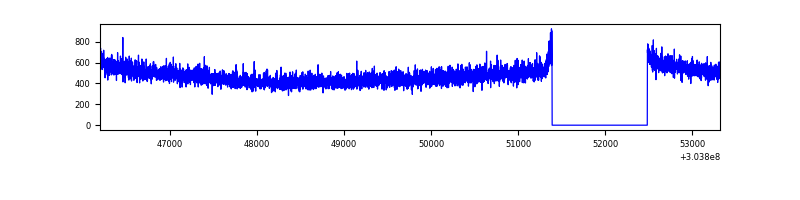 |
| D | 7125 | 6030 | 70 | 70 | 0.98% | 1.16% | 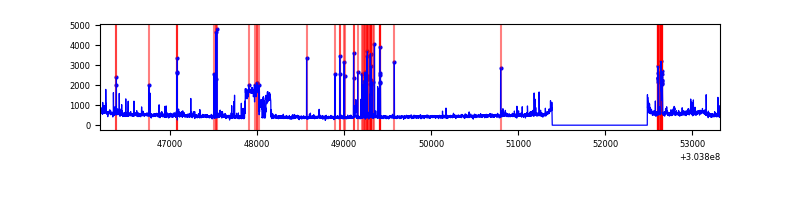 |
Top three noisy pixels from each quadrant. If the there are fewer than three noisy pixels in the level2.evt file, extra rows are filled as -1
| Pixel properties | Quadrant properties | ||||||
|---|---|---|---|---|---|---|---|
| Quadrant | DetID | PixID | Counts | Sigma | Mean | Median | Sigma |
| A | 13 | 254 | 7867 | 48.68 | 727 | 710 | 147.0 |
| A | 0 | 226 | 6292 | 37.97 | 727 | 710 | 147.0 |
| A | 3 | 137 | 5707 | 33.99 | 727 | 710 | 147.0 |
| B | 0 | 189 | 102376 | 735.05 | 731 | 713 | 138.3 |
| B | 4 | 216 | 82278 | 589.73 | 731 | 713 | 138.3 |
| B | 7 | 220 | 70925 | 507.65 | 731 | 713 | 138.3 |
| C | 14 | 238 | 110727 | 667.4 | 705 | 710 | 164.8 |
| C | 13 | 61 | 4943 | 25.68 | 705 | 710 | 164.8 |
| C | 3 | 233 | 1853 | 6.93 | 705 | 710 | 164.8 |
| D | 15 | 0 | 357730 | 2058.04 | 710 | 690 | 173.5 |
| D | 1 | 20 | 122520 | 702.25 | 710 | 690 | 173.5 |
| D | 6 | 143 | 76184 | 435.16 | 710 | 690 | 173.5 |
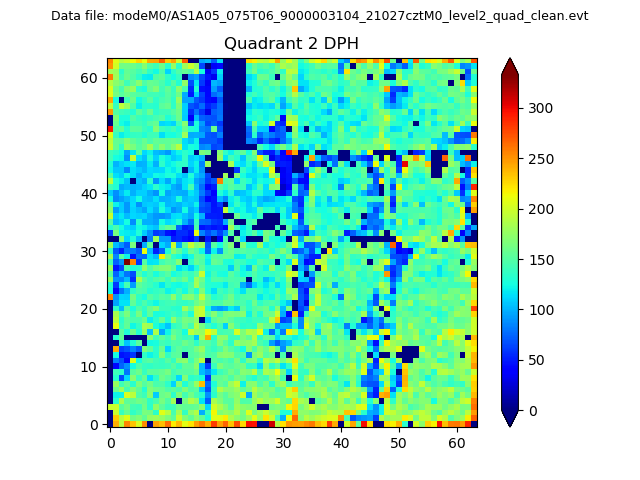
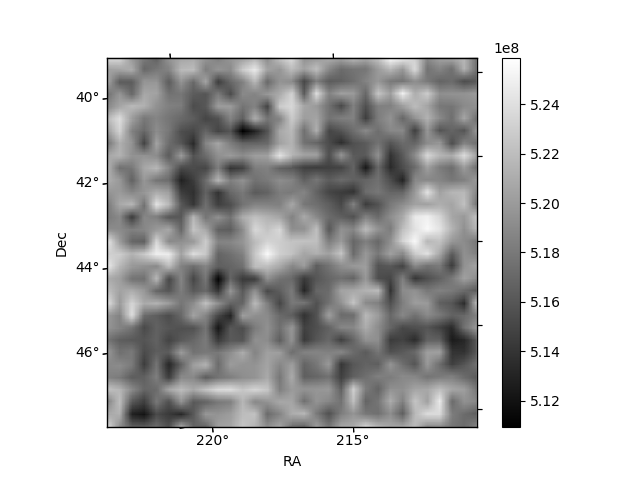
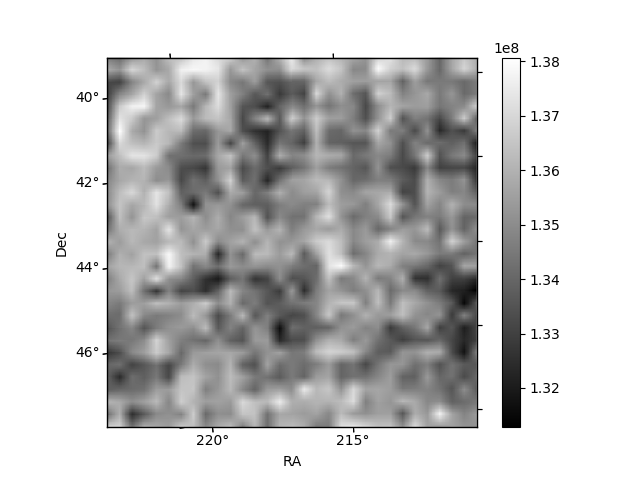
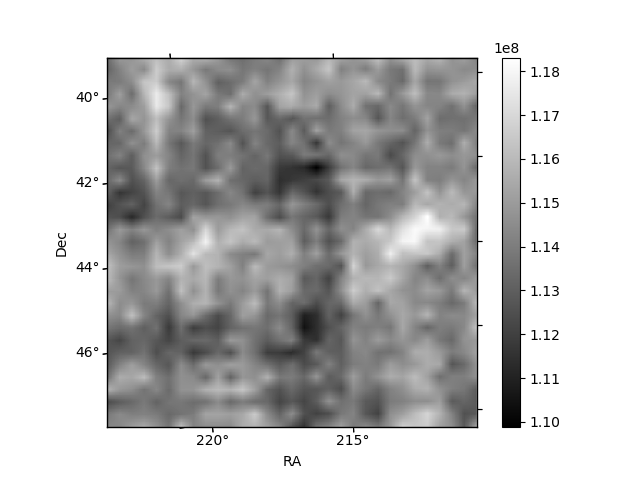
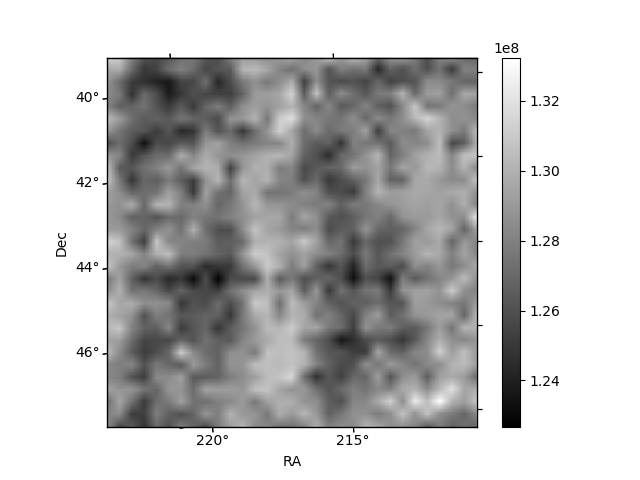
Histogram calculated using DETX and DETY for each event in the final _common_clean file
| Quadrant A | 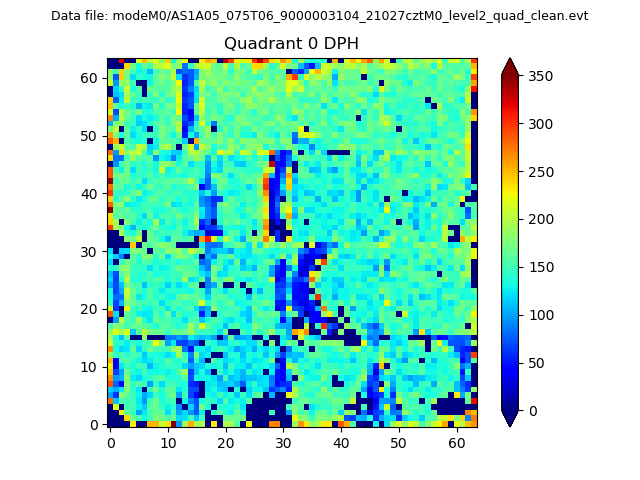 |
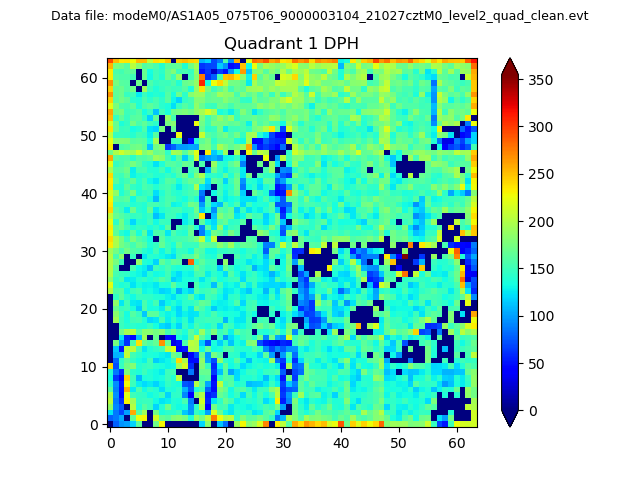 |
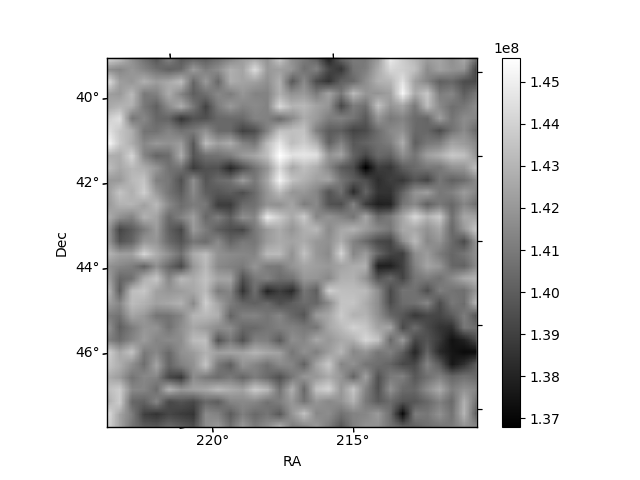
Quadrant B |
|---|---|---|---|
| Quadrant D | 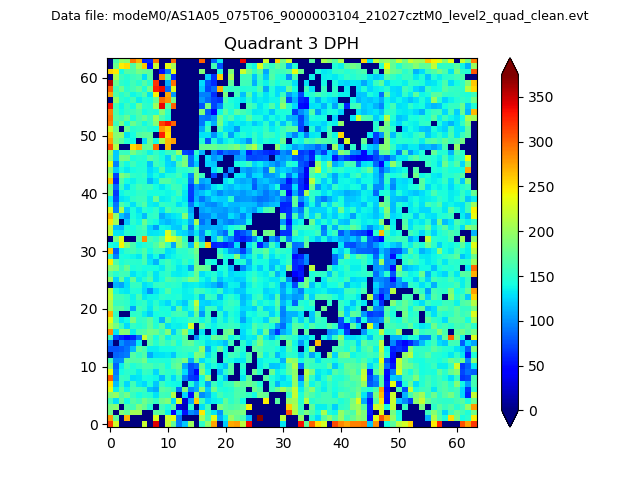 |
 |
Quadrant C |
| Plot type | Count rate plots | Images |
|---|---|---|
| Comparison with Poisson distribution Blue bars denote a histogram of data divided into 1 sec bins. Red curve is a Poisson curve with rate = median count rate of data. |
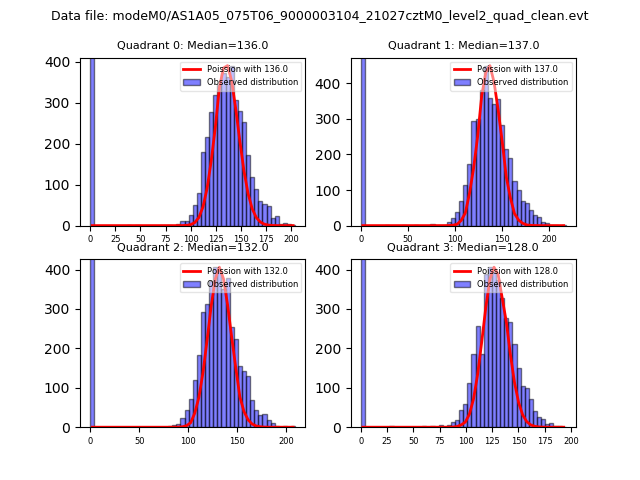 |
 |
| Quadrant-wise count rates Data is divided into 100 sec bins |
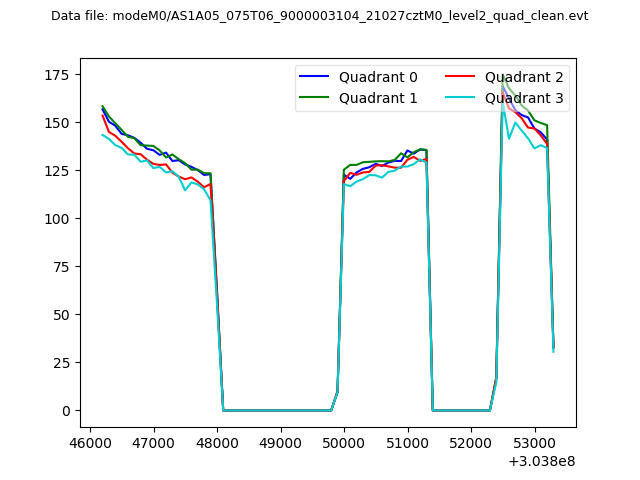 |
|
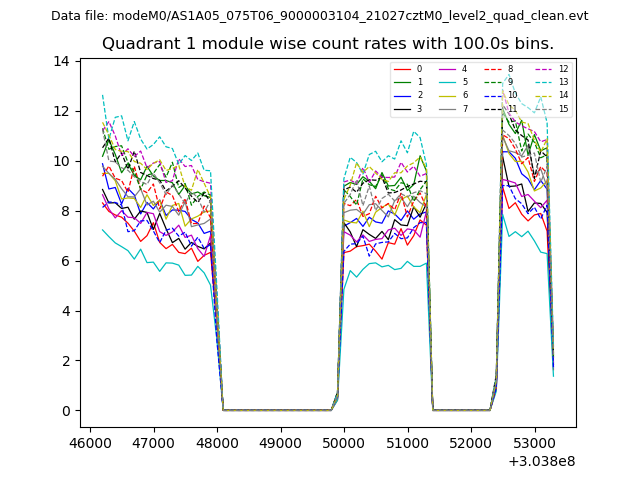
| Module-wise count rates for Quadrant A Data is divided into 100 sec bins |
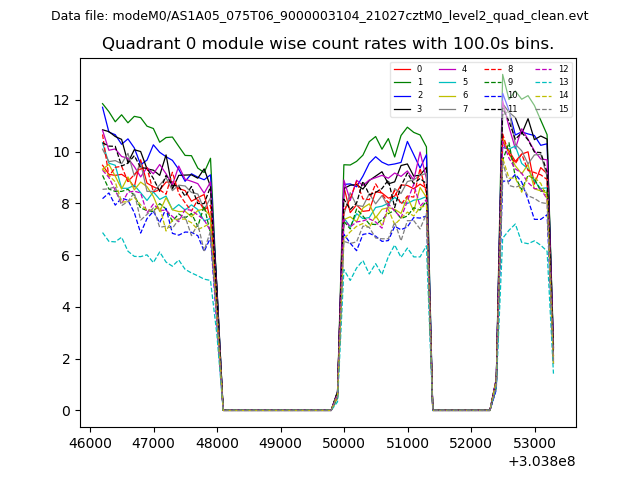 |
 |
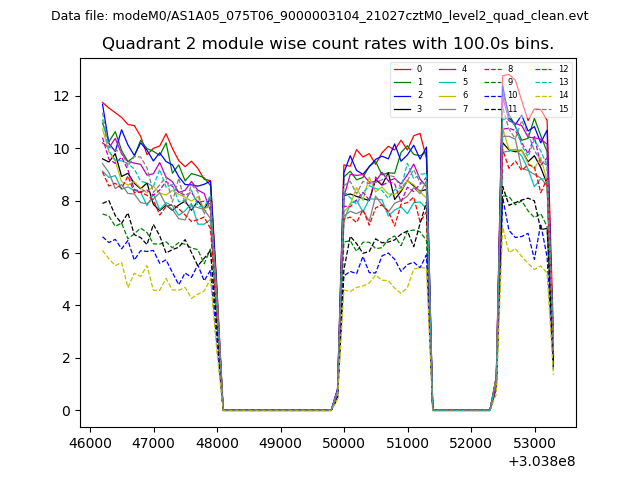
| Module-wise count rates for Quadrant B Data is divided into 100 sec bins |
 |
 |
| Module-wise count rates for Quadrant C Data is divided into 100 sec bins |
 |
 |
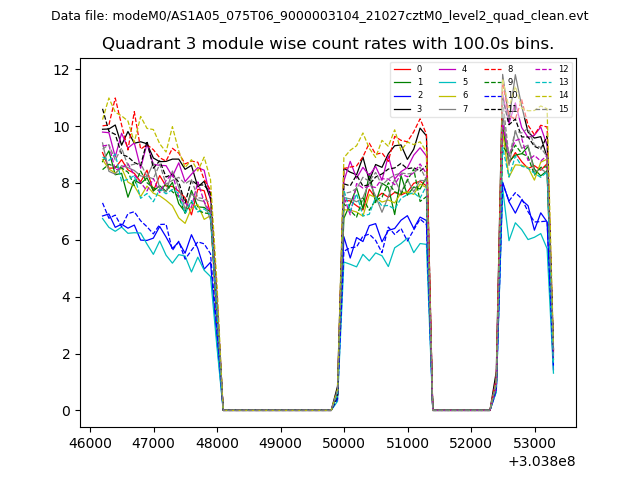
| Module-wise count rates for Quadrant D Data is divided into 100 sec bins |
 |
 |
| Parameter | Plot |
|---|---|
| CZT HV Monitor | 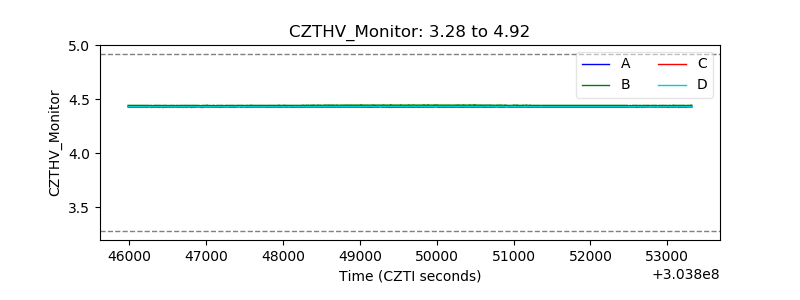 |
| D_VDD | 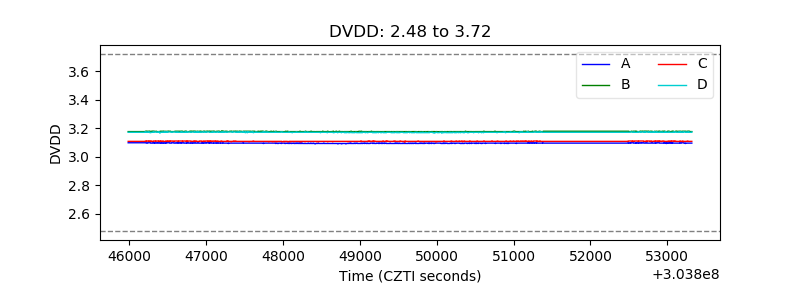 |
| Temperature 1 |  |
| Veto HV Monitor | 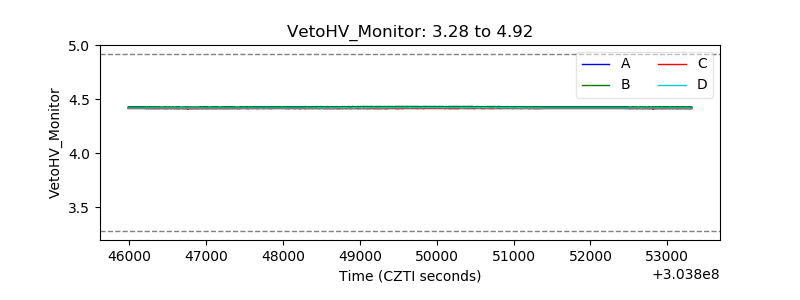 |
| Veto LLD | 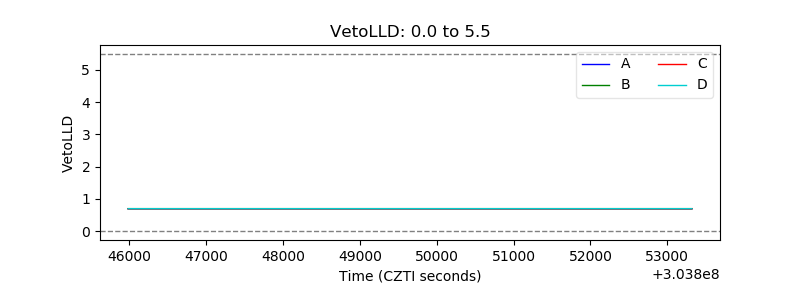 |
| Alpha Counter | 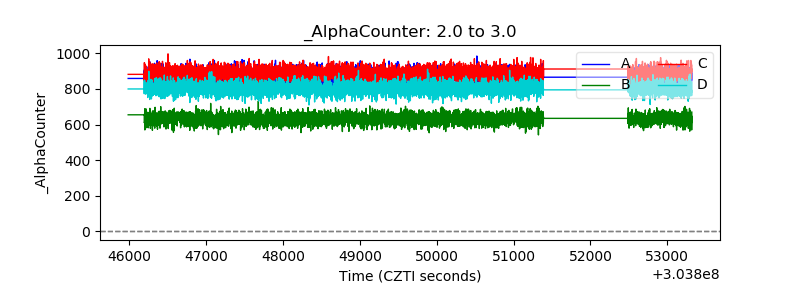 |
| _CPM_Rate | 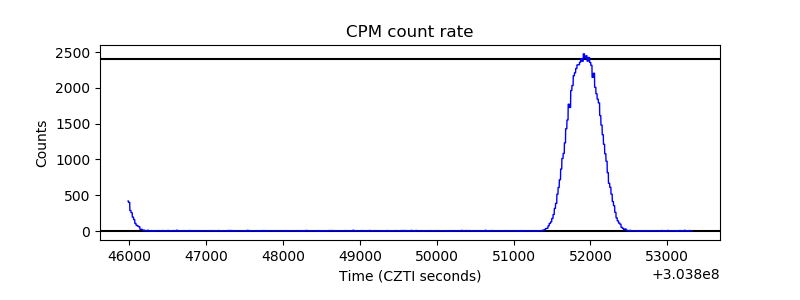 |
| CZT Counter | 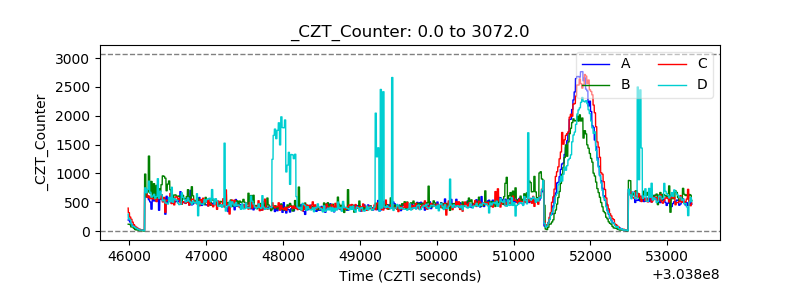 |
| +2.5 Volts monitor | 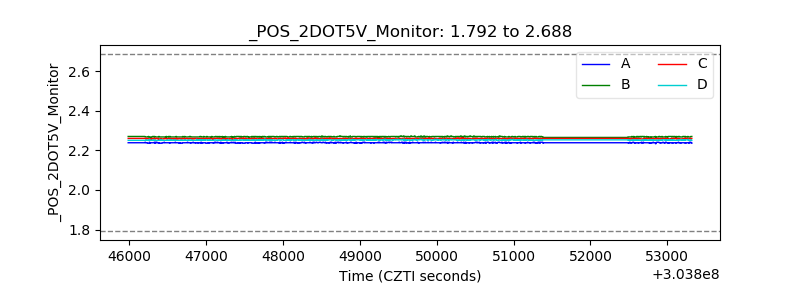 |
| +5 Volts monitor |  |
| _ROLL_ROT |  |
| _Roll_DEC | 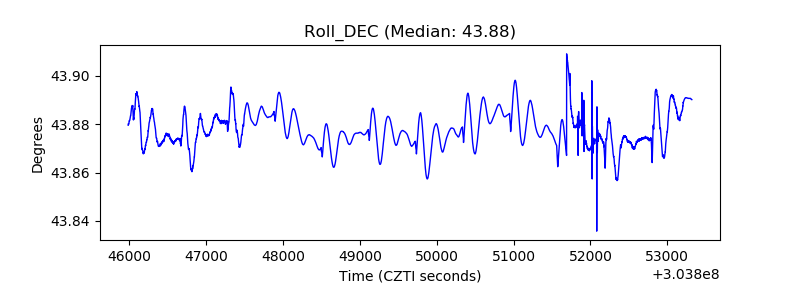 |
| _Roll_RA | 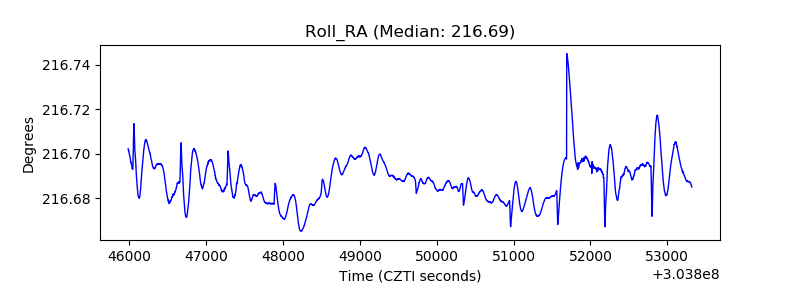 |
| Veto Counter |  |