| Param | Original file | Final file |
|---|---|---|
| Filename | modeM0/AS1A05_088T02_9000003106cztM0_level2.fits | modeM0/AS1A05_088T02_9000003106cztM0_level2_quad_clean.evt |
| Size (bytes) | 682,318,080 | 607,222,080 |
| Size | 650.7 MB | 579.1 MB |
| Events in quadrant A | 4,234,890 | 3,642,689 |
| Events in quadrant B | 4,036,176 | 3,563,722 |
| Events in quadrant C | 4,104,156 | 3,394,661 |
| Events in quadrant D | 3,487,362 | 2,987,714 |
| Mode M9 | |||
|---|---|---|---|
| Quadrant | BADHDUFLAG | Total packets | Discarded packets |
| A | 0 | 116 | 0 |
| B | 0 | 116 | 0 |
| C | 0 | 116 | 0 |
| D | 0 | 116 | 0 |
| Mode SS | |||
|---|---|---|---|
| Quadrant | BADHDUFLAG | Total packets | Discarded packets |
| A | 0 | 1424 | 0 |
| B | 0 | 1424 | 0 |
| C | 0 | 1424 | 0 |
| D | 0 | 1424 | 0 |
| Mode M0 | |||
|---|---|---|---|
| Quadrant | BADHDUFLAG | Total packets | Discarded packets |
| A | 0 | 144581 | 0 |
| B | 0 | 158287 | 0 |
| C | 0 | 144449 | 0 |
| D | 0 | 182605 | 0 |
| Quadrant | Total seconds | Saturated seconds | Saturation percentage |
|---|---|---|---|
| A | 70010 | 943 | 1.346950% |
| B | 70010 | 1763 | 2.518212% |
| C | 70010 | 1167 | 1.666905% |
| D | 70010 | 3696 | 5.279246% |
Noise dominated data is calculated using 1-second bins in cleaned event files. If a bin has >2000 counts, and if more than 50% of those come from <1% of pixels, then it is considered to be noise-dominated and hence unusable.
| Quadrant | # 1 sec bins | Bins with >0 counts | Bins with >2000 counts | High rate bins dominated by noise | Noise dominated (total time) | Noise dominated (detector-on time) | Marked lightcurve |
|---|---|---|---|---|---|---|---|
| A | 81375 | 70010 | 0 | 0 | 0.00% | 0.00% |  |
| B | 81375 | 70009 | 0 | 0 | 0.00% | 0.00% |  |
| C | 81375 | 70011 | 0 | 0 | 0.00% | 0.00% |  |
| D | 81375 | 69954 | 0 | 0 | 0.00% | 0.00% |  |
Top three noisy pixels from each quadrant. If the there are fewer than three noisy pixels in the level2.evt file, extra rows are filled as -1
| Pixel properties | Quadrant properties | ||||||
|---|---|---|---|---|---|---|---|
| Quadrant | DetID | PixID | Counts | Sigma | Mean | Median | Sigma |
| A | 0 | 29 | 4103 | 11.29 | 1102 | 1035 | 271.8 |
| A | 7 | 110 | 3502 | 9.08 | 1102 | 1035 | 271.8 |
| A | 0 | 30 | 3259 | 8.18 | 1102 | 1035 | 271.8 |
| B | 2 | 9 | 3204 | 10.41 | 1069 | 1021 | 209.7 |
| B | 5 | 128 | 2680 | 7.91 | 1069 | 1021 | 209.7 |
| B | 2 | 8 | 2668 | 7.85 | 1069 | 1021 | 209.7 |
| C | 3 | 234 | 3011 | 7.21 | 1084 | 1013 | 277.2 |
| C | 12 | 241 | 2897 | 6.8 | 1084 | 1013 | 277.2 |
| C | 12 | 250 | 2771 | 6.34 | 1084 | 1013 | 277.2 |
| D | 10 | 189 | 2507 | 5.98 | 998 | 908 | 267.5 |
| D | 6 | 67 | 2452 | 5.77 | 998 | 908 | 267.5 |
| D | 6 | 38 | 2440 | 5.73 | 998 | 908 | 267.5 |
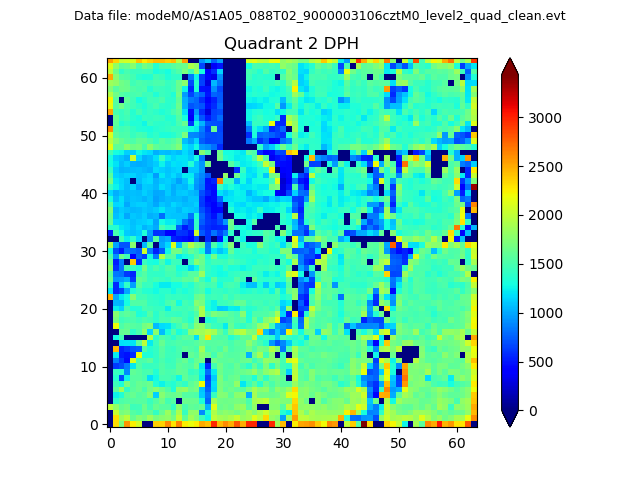
Histogram calculated using DETX and DETY for each event in the final _common_clean file
| Quadrant A |  |
 |
Quadrant B |
|---|---|---|---|
| Quadrant D |  |
 |
Quadrant C |
| Plot type | Count rate plots | Images |
|---|---|---|
| Comparison with Poisson distribution Blue bars denote a histogram of data divided into 1 sec bins. Red curve is a Poisson curve with rate = median count rate of data. |
 |
 |
| Quadrant-wise count rates Data is divided into 100 sec bins |
 |
|
| Module-wise count rates for Quadrant A Data is divided into 100 sec bins |
 |
 |
| Module-wise count rates for Quadrant B Data is divided into 100 sec bins |
 |
 |
| Module-wise count rates for Quadrant C Data is divided into 100 sec bins |
 |
 |
| Module-wise count rates for Quadrant D Data is divided into 100 sec bins |
 |
 |
| Parameter | Plot |
|---|---|
| CZT HV Monitor |  |
| D_VDD |  |
| Temperature 1 |  |
| Veto HV Monitor |  |
| Veto LLD |  |
| Alpha Counter | 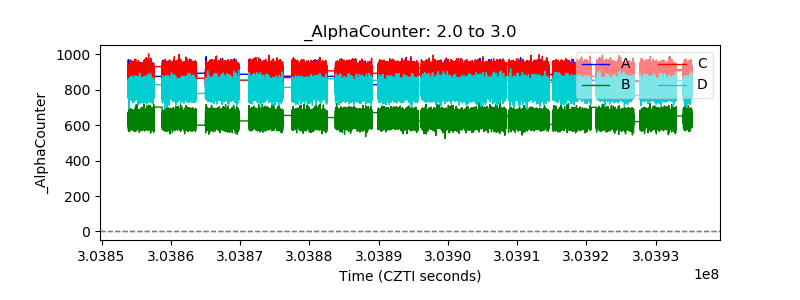 |
| _CPM_Rate | 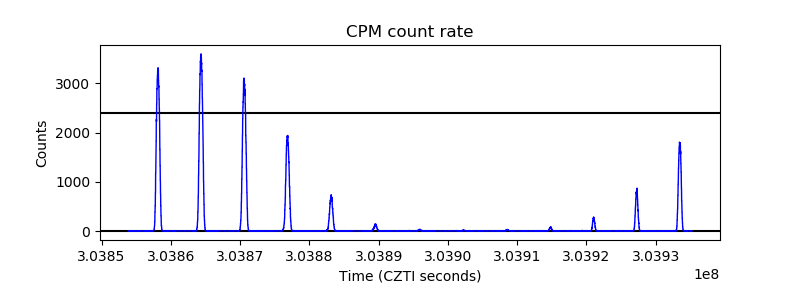 |
| CZT Counter |  |
| +2.5 Volts monitor |  |
| +5 Volts monitor | 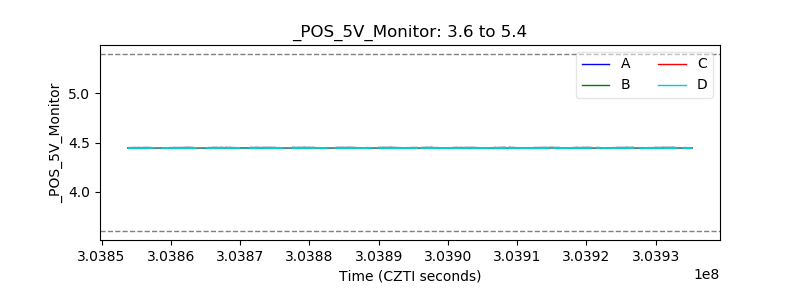 |
| _ROLL_ROT | 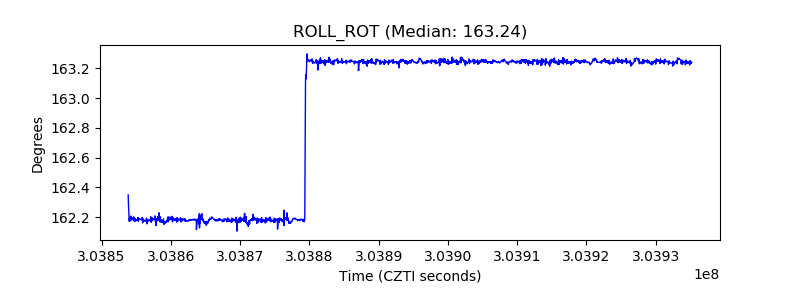 |
| _Roll_DEC |  |
| _Roll_RA | 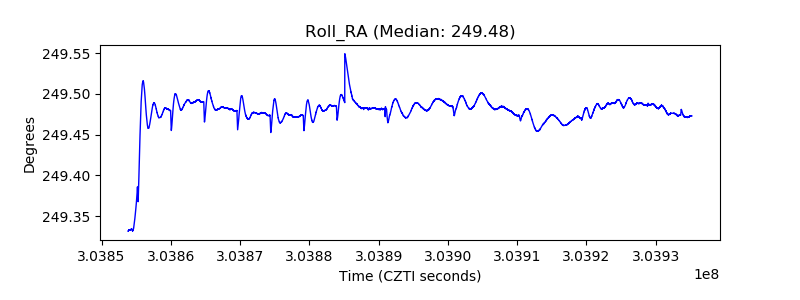 |
| Veto Counter |  |