| Param | Original file | Final file |
|---|---|---|
| Filename | modeM0/AS1A05_088T02_9000003106_21029cztM0_level2.evt | modeM0/AS1A05_088T02_9000003106_21029cztM0_level2_quad_clean.evt |
| Size (bytes) | 337,011,840 | 65,828,160 |
| Size | 321.4 MB | 62.8 MB |
| Events in quadrant A | 2,360,040 | 418,837 |
| Events in quadrant B | 2,640,713 | 427,284 |
| Events in quadrant C | 2,402,071 | 404,987 |
| Events in quadrant D | 2,462,821 | 391,484 |
| Mode M9 | |||
|---|---|---|---|
| Quadrant | BADHDUFLAG | Total packets | Discarded packets |
| A | 0 | 12 | 0 |
| B | 0 | 12 | 0 |
| C | 0 | 12 | 0 |
| D | 0 | 12 | 0 |
| Mode SS | |||
|---|---|---|---|
| Quadrant | BADHDUFLAG | Total packets | Discarded packets |
| A | 0 | 102 | 0 |
| B | 0 | 102 | 0 |
| C | 0 | 102 | 0 |
| D | 0 | 102 | 0 |
| Mode M0 | |||
|---|---|---|---|
| Quadrant | BADHDUFLAG | Total packets | Discarded packets |
| A | 0 | 10300 | 1 |
| B | 0 | 11083 | 1 |
| C | 0 | 10329 | 1 |
| D | 0 | 10779 | 1 |
| Quadrant | Total seconds | Saturated seconds | Saturation percentage |
|---|---|---|---|
| A | 5000 | 7 | 0.140000% |
| B | 5000 | 45 | 0.900000% |
| C | 5000 | 23 | 0.460000% |
| D | 5000 | 18 | 0.360000% |
Noise dominated data is calculated using 1-second bins in cleaned event files. If a bin has >2000 counts, and if more than 50% of those come from <1% of pixels, then it is considered to be noise-dominated and hence unusable.
| Quadrant | # 1 sec bins | Bins with >0 counts | Bins with >2000 counts | High rate bins dominated by noise | Noise dominated (total time) | Noise dominated (detector-on time) | Marked lightcurve |
|---|---|---|---|---|---|---|---|
| A | 6220 | 5001 | 0 | 0 | 0.00% | 0.00% | 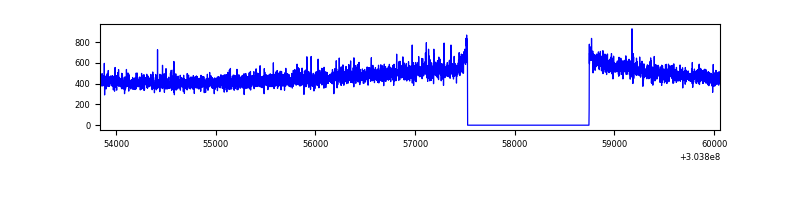 |
| B | 6220 | 5001 | 13 | 13 | 0.21% | 0.26% | 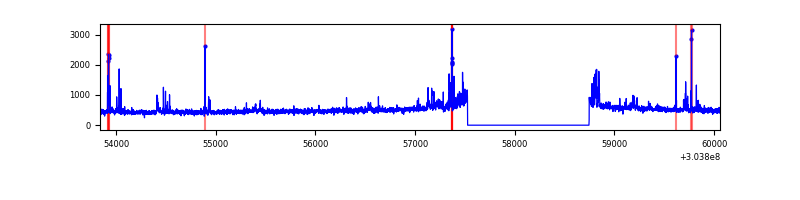 |
| C | 6220 | 5001 | 0 | 0 | 0.00% | 0.00% | 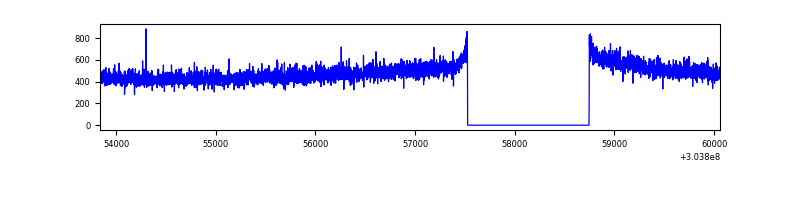 |
| D | 6220 | 5001 | 9 | 9 | 0.14% | 0.18% | 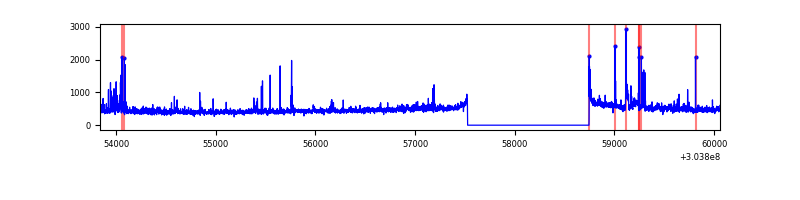 |
Top three noisy pixels from each quadrant. If the there are fewer than three noisy pixels in the level2.evt file, extra rows are filled as -1
| Pixel properties | Quadrant properties | ||||||
|---|---|---|---|---|---|---|---|
| Quadrant | DetID | PixID | Counts | Sigma | Mean | Median | Sigma |
| A | 13 | 254 | 6447 | 46.71 | 612 | 601 | 125.2 |
| A | 0 | 226 | 5215 | 36.86 | 612 | 601 | 125.2 |
| A | 3 | 137 | 4843 | 33.89 | 612 | 601 | 125.2 |
| B | 7 | 220 | 64613 | 552.69 | 615 | 599 | 115.8 |
| B | 0 | 189 | 53119 | 453.45 | 615 | 599 | 115.8 |
| B | 3 | 64 | 43639 | 371.6 | 615 | 599 | 115.8 |
| C | 14 | 238 | 93605 | 664.34 | 592 | 595 | 140.0 |
| C | 13 | 61 | 4216 | 25.86 | 592 | 595 | 140.0 |
| C | 14 | 111 | 1398 | 5.74 | 592 | 595 | 140.0 |
| D | 1 | 239 | 68633 | 476.25 | 591 | 574 | 142.9 |
| D | 1 | 52 | 59783 | 414.32 | 591 | 574 | 142.9 |
| D | 7 | 38 | 25656 | 175.51 | 591 | 574 | 142.9 |
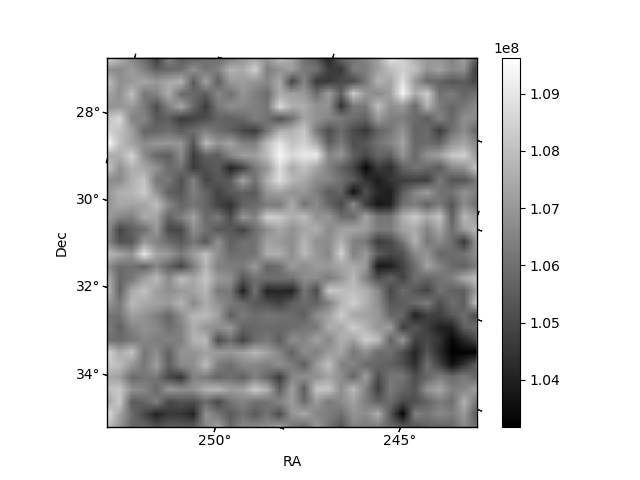
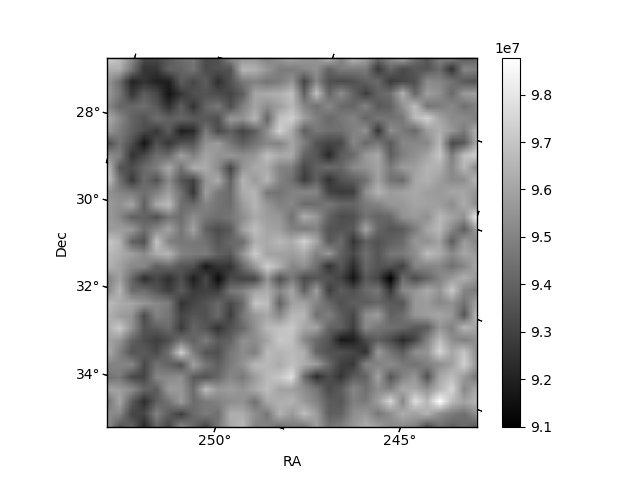
Histogram calculated using DETX and DETY for each event in the final _common_clean file
| Quadrant A | 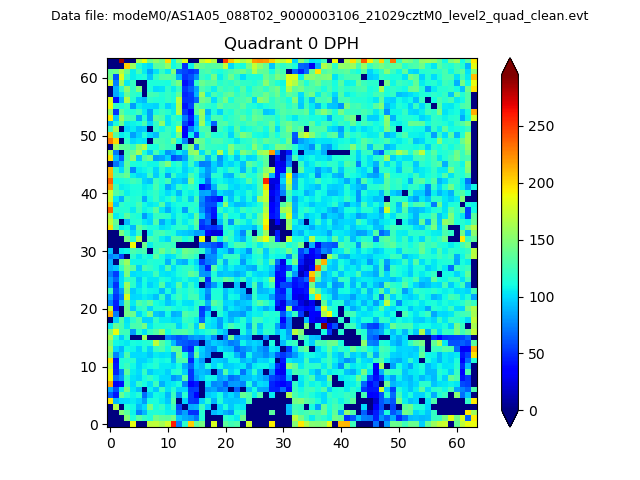 |
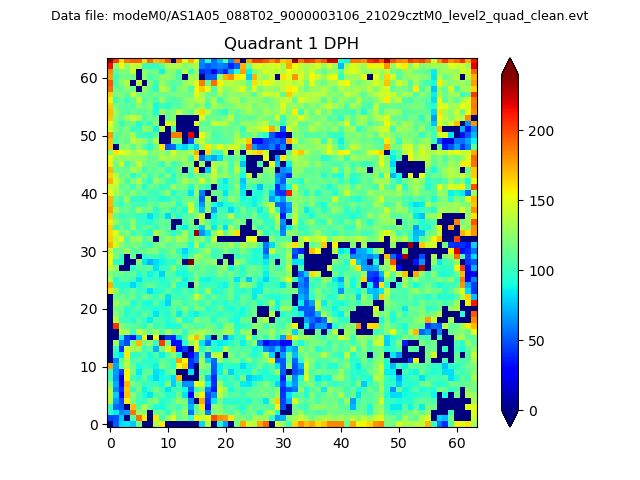 |
Quadrant B |
|---|---|---|---|
| Quadrant D | 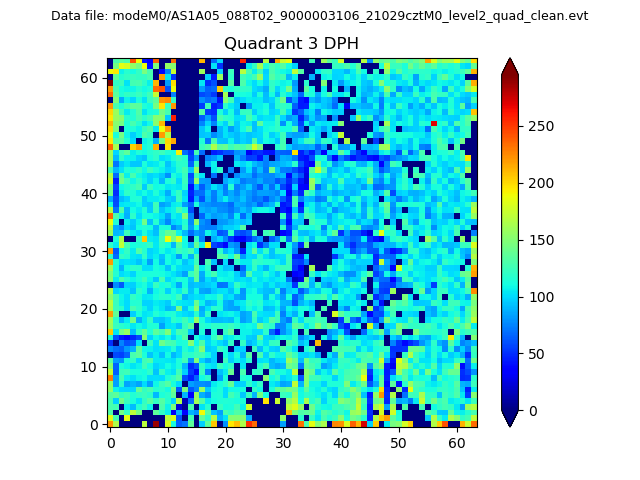 |
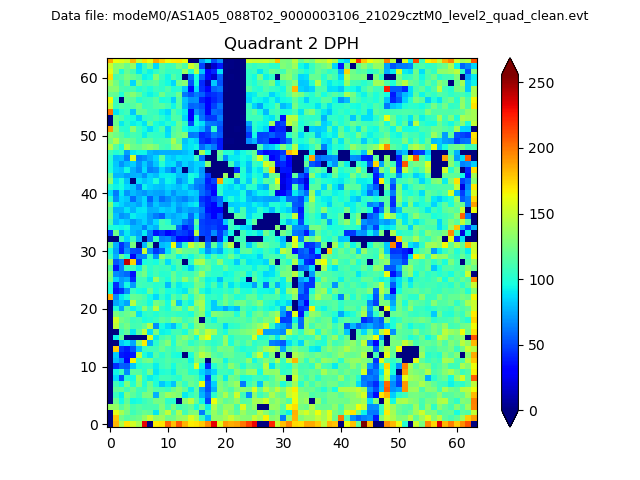 |
Quadrant C |
| Plot type | Count rate plots | Images |
|---|---|---|
| Comparison with Poisson distribution Blue bars denote a histogram of data divided into 1 sec bins. Red curve is a Poisson curve with rate = median count rate of data. |
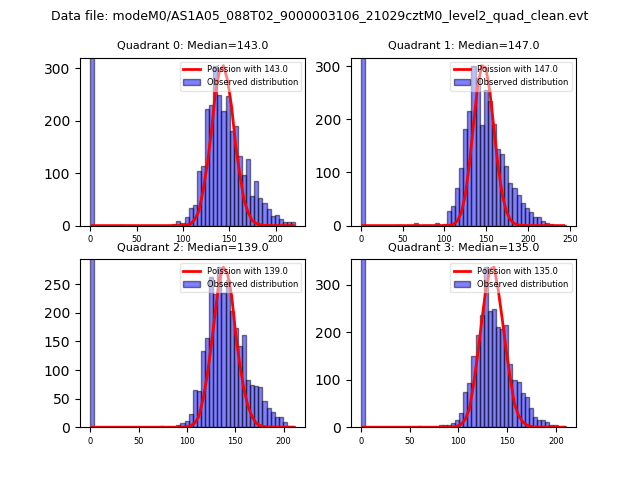 |
 |
| Quadrant-wise count rates Data is divided into 100 sec bins |
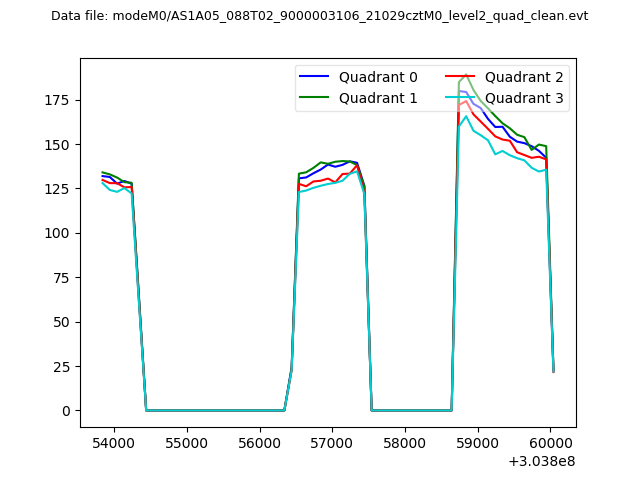 |
|
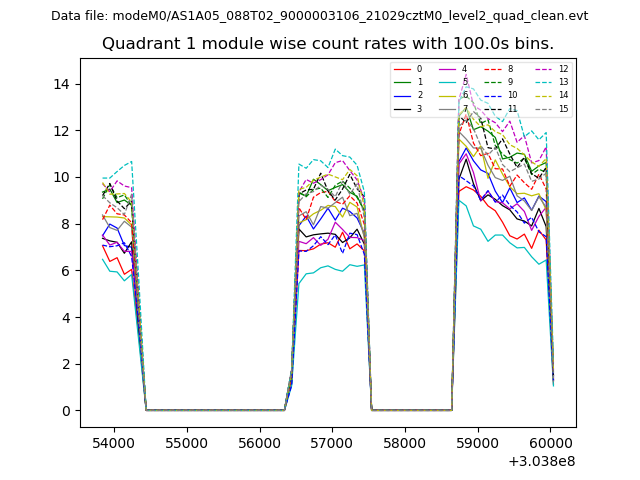
| Module-wise count rates for Quadrant A Data is divided into 100 sec bins |
 |
 |
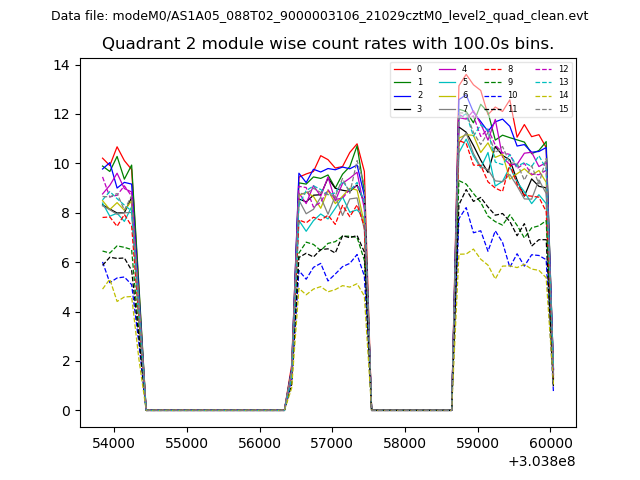
| Module-wise count rates for Quadrant B Data is divided into 100 sec bins |
 |
 |
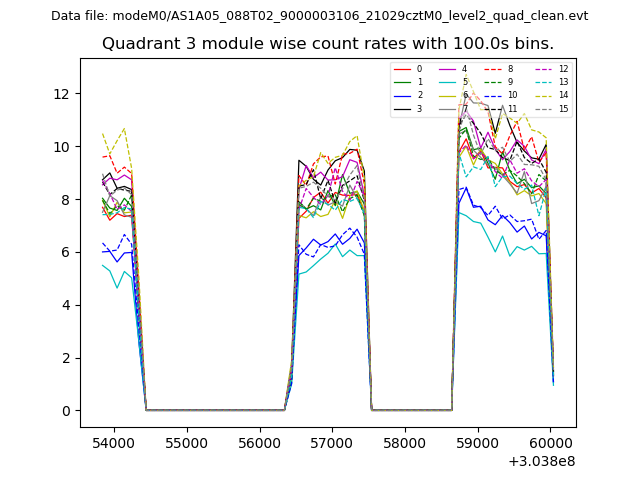
| Module-wise count rates for Quadrant C Data is divided into 100 sec bins |
 |
 |
| Module-wise count rates for Quadrant D Data is divided into 100 sec bins |
 |
 |
| Parameter | Plot |
|---|---|
| CZT HV Monitor |  |
| D_VDD | 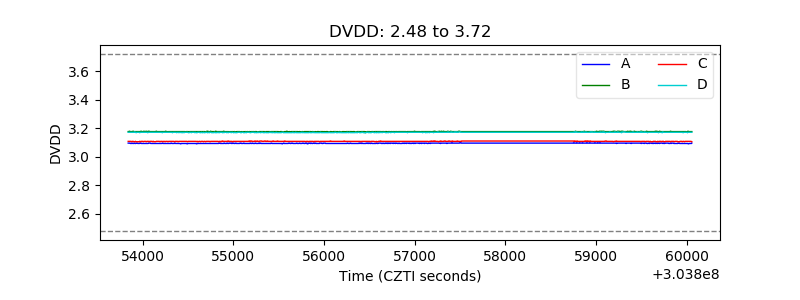 |
| Temperature 1 | 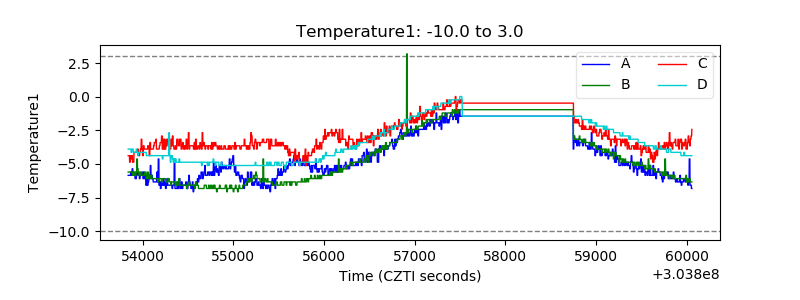 |
| Veto HV Monitor | 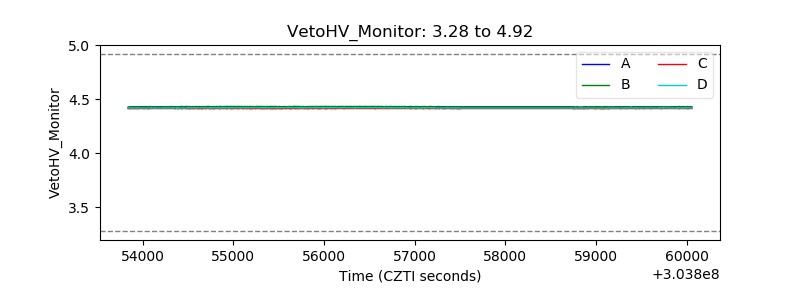 |
| Veto LLD |  |
| Alpha Counter | 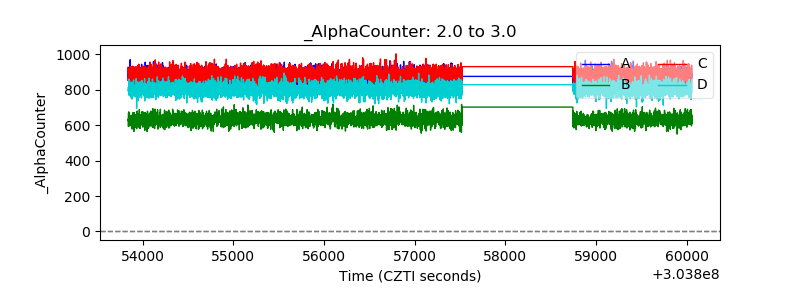 |
| _CPM_Rate | 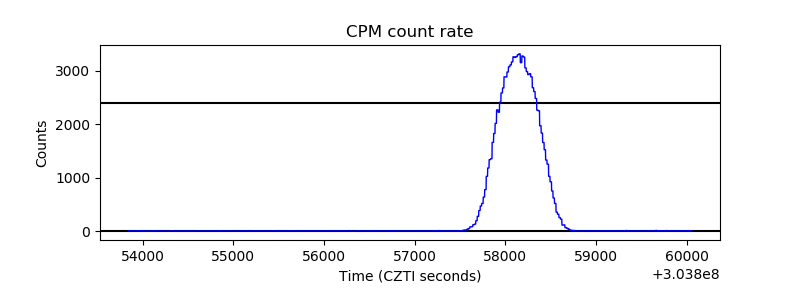 |
| CZT Counter | 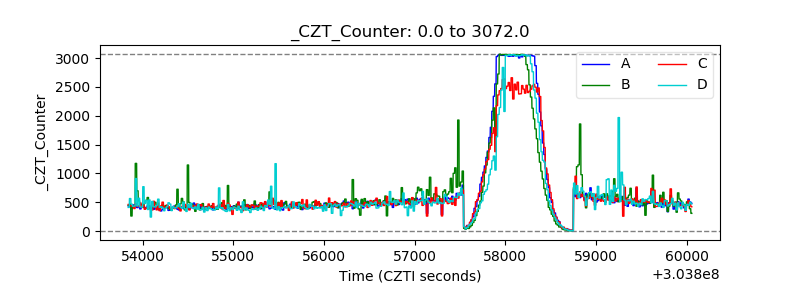 |
| +2.5 Volts monitor | 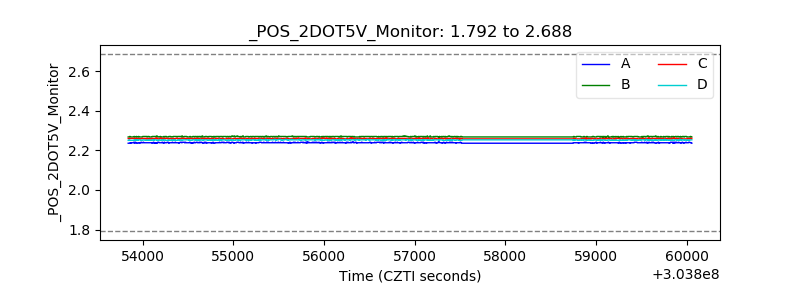 |
| +5 Volts monitor |  |
| _ROLL_ROT |  |
| _Roll_DEC | 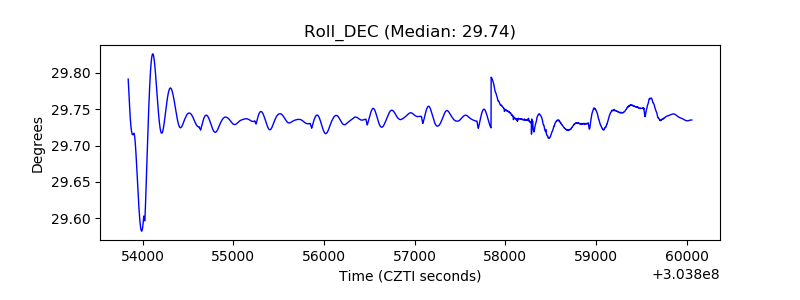 |
| _Roll_RA | 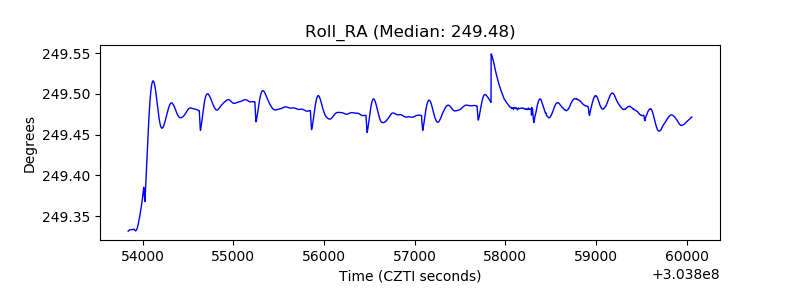 |
| Veto Counter |  |