| Param | Original file | Final file |
|---|---|---|
| Filename | modeM0/AS1A05_088T02_9000003106_21030cztM0_level2.evt | modeM0/AS1A05_088T02_9000003106_21030cztM0_level2_quad_clean.evt |
| Size (bytes) | 440,297,280 | 92,174,400 |
| Size | 419.9 MB | 87.9 MB |
| Events in quadrant A | 3,052,793 | 605,087 |
| Events in quadrant B | 3,471,306 | 617,841 |
| Events in quadrant C | 3,096,610 | 581,911 |
| Events in quadrant D | 3,295,659 | 556,942 |
| Mode M9 | |||
|---|---|---|---|
| Quadrant | BADHDUFLAG | Total packets | Discarded packets |
| A | 0 | 20 | 0 |
| B | 0 | 21 | 0 |
| C | 0 | 21 | 0 |
| D | 0 | 21 | 0 |
| Mode SS | |||
|---|---|---|---|
| Quadrant | BADHDUFLAG | Total packets | Discarded packets |
| A | 0 | 126 | 0 |
| B | 0 | 126 | 0 |
| C | 0 | 126 | 0 |
| D | 0 | 126 | 0 |
| Mode M0 | |||
|---|---|---|---|
| Quadrant | BADHDUFLAG | Total packets | Discarded packets |
| A | 0 | 12852 | 2 |
| B | 0 | 14152 | 2 |
| C | 0 | 12927 | 2 |
| D | 0 | 13889 | 2 |
| Quadrant | Total seconds | Saturated seconds | Saturation percentage |
|---|---|---|---|
| A | 6151 | 6 | 0.097545% |
| B | 6151 | 88 | 1.430662% |
| C | 6151 | 34 | 0.552756% |
| D | 6151 | 49 | 0.796618% |
Noise dominated data is calculated using 1-second bins in cleaned event files. If a bin has >2000 counts, and if more than 50% of those come from <1% of pixels, then it is considered to be noise-dominated and hence unusable.
| Quadrant | # 1 sec bins | Bins with >0 counts | Bins with >2000 counts | High rate bins dominated by noise | Noise dominated (total time) | Noise dominated (detector-on time) | Marked lightcurve |
|---|---|---|---|---|---|---|---|
| A | 7466 | 6152 | 0 | 0 | 0.00% | 0.00% | 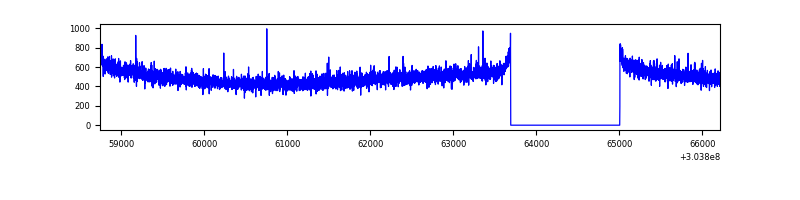 |
| B | 7466 | 6152 | 32 | 32 | 0.43% | 0.52% | 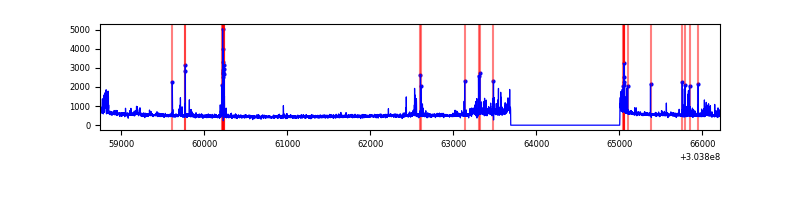 |
| C | 7466 | 6152 | 0 | 0 | 0.00% | 0.00% | 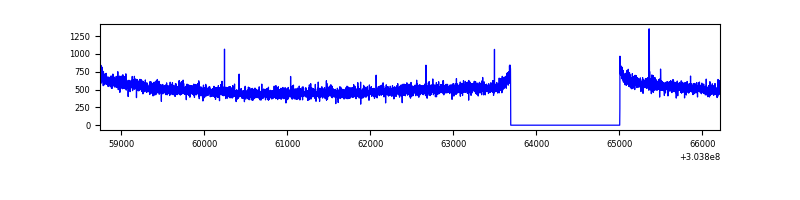 |
| D | 7466 | 6152 | 28 | 28 | 0.38% | 0.46% |  |
Top three noisy pixels from each quadrant. If the there are fewer than three noisy pixels in the level2.evt file, extra rows are filled as -1
| Pixel properties | Quadrant properties | ||||||
|---|---|---|---|---|---|---|---|
| Quadrant | DetID | PixID | Counts | Sigma | Mean | Median | Sigma |
| A | 15 | 192 | 14001 | 84.01 | 788 | 773 | 157.5 |
| A | 13 | 254 | 8111 | 46.61 | 788 | 773 | 157.5 |
| A | 0 | 226 | 6817 | 38.39 | 788 | 773 | 157.5 |
| B | 0 | 189 | 110569 | 745.55 | 793 | 773 | 147.3 |
| B | 7 | 220 | 104082 | 701.5 | 793 | 773 | 147.3 |
| B | 3 | 64 | 78894 | 530.46 | 793 | 773 | 147.3 |
| C | 14 | 238 | 120529 | 674.96 | 761 | 768 | 177.4 |
| C | 13 | 61 | 5124 | 24.55 | 761 | 768 | 177.4 |
| C | 9 | 54 | 4068 | 18.6 | 761 | 768 | 177.4 |
| D | 1 | 52 | 198902 | 1087.71 | 758 | 738 | 182.2 |
| D | 1 | 239 | 72498 | 393.89 | 758 | 738 | 182.2 |
| D | 15 | 0 | 65057 | 353.04 | 758 | 738 | 182.2 |
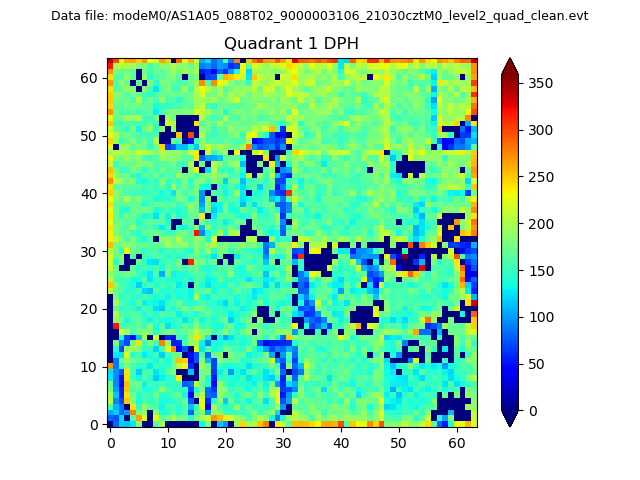
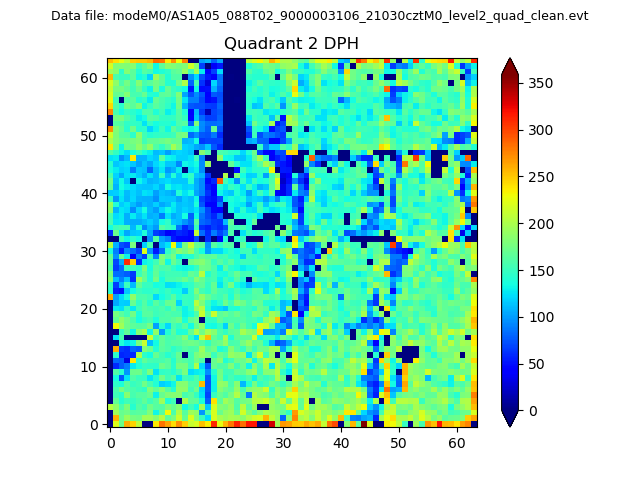
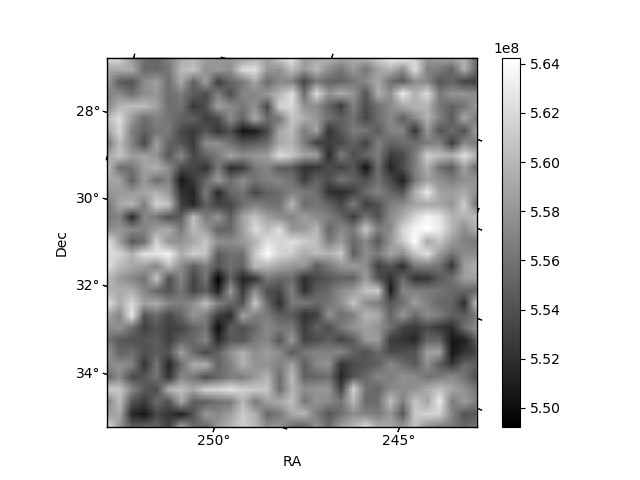
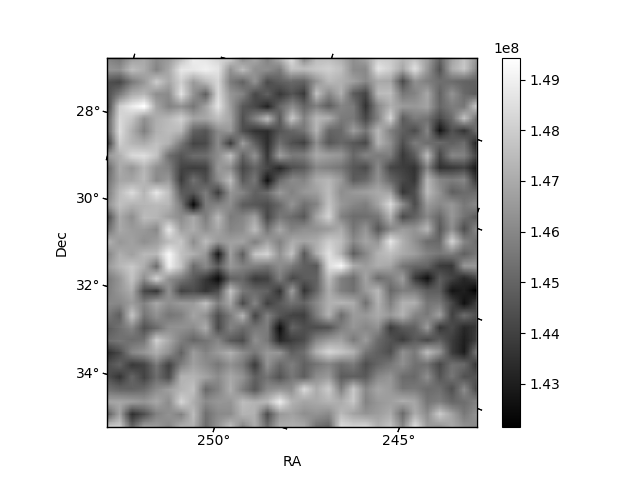
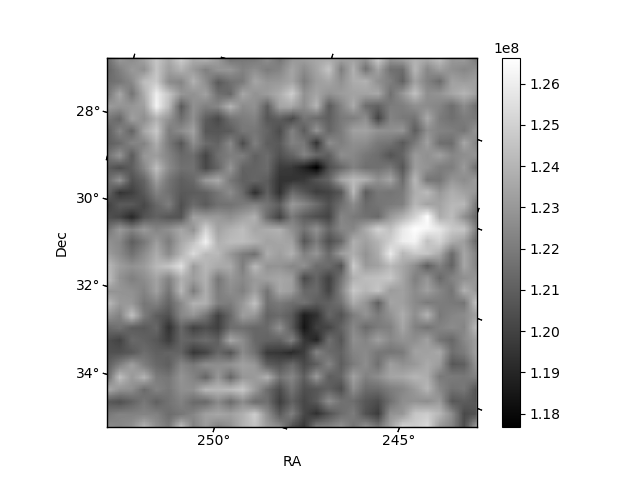
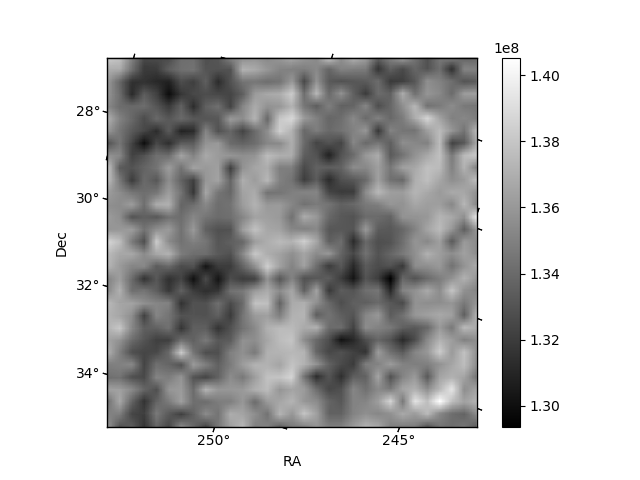
Histogram calculated using DETX and DETY for each event in the final _common_clean file
| Quadrant A | 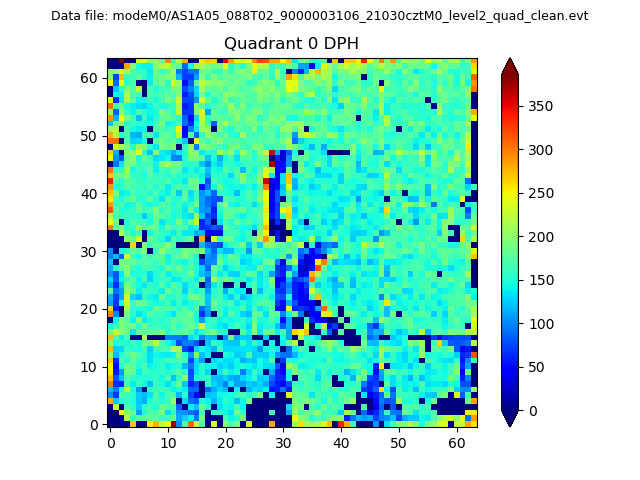 |
 |
Quadrant B |
|---|---|---|---|
| Quadrant D | 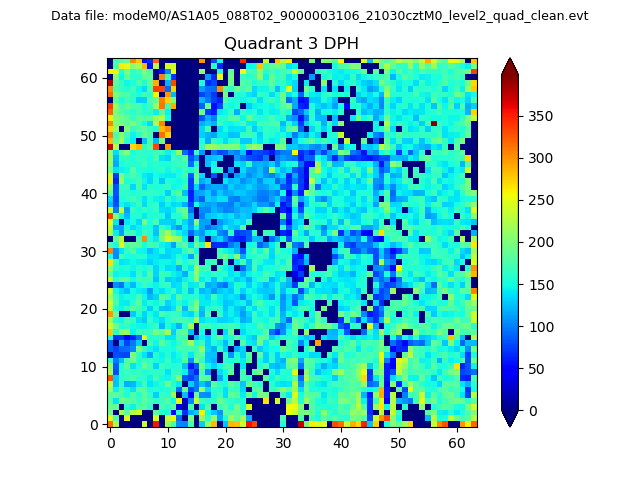 |
 |
Quadrant C |
| Plot type | Count rate plots | Images |
|---|---|---|
| Comparison with Poisson distribution Blue bars denote a histogram of data divided into 1 sec bins. Red curve is a Poisson curve with rate = median count rate of data. |
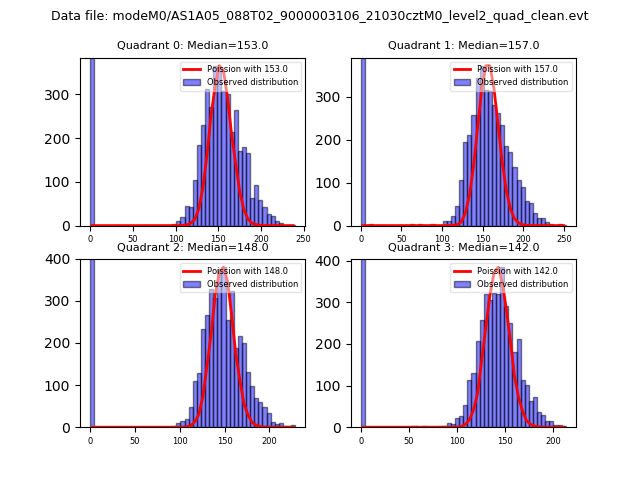 |
 |
| Quadrant-wise count rates Data is divided into 100 sec bins |
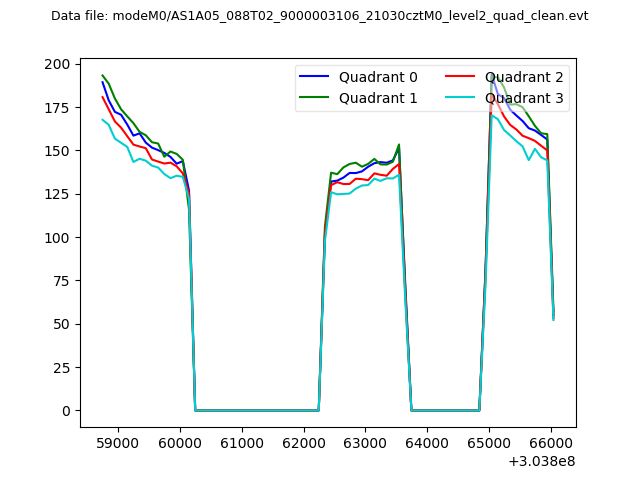 |
|
| Module-wise count rates for Quadrant A Data is divided into 100 sec bins |
 |
 |
| Module-wise count rates for Quadrant B Data is divided into 100 sec bins |
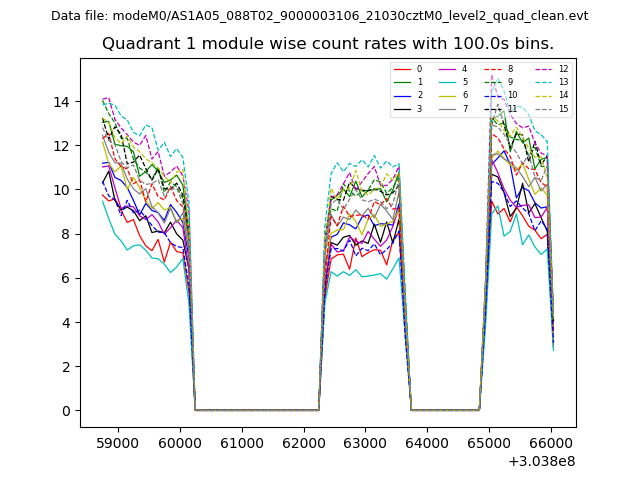 |
 |
| Module-wise count rates for Quadrant C Data is divided into 100 sec bins |
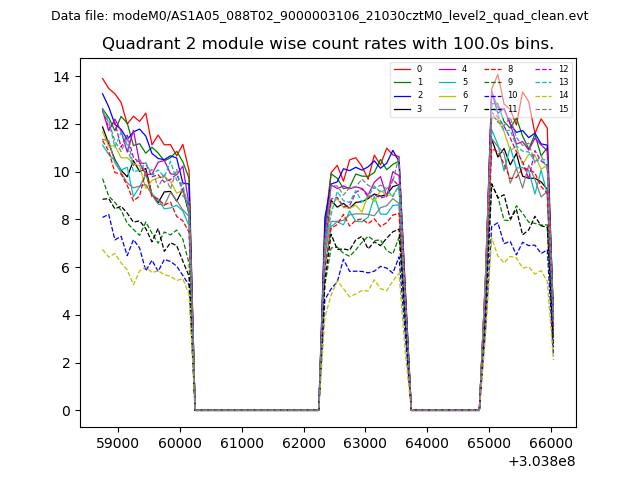 |
 |
| Module-wise count rates for Quadrant D Data is divided into 100 sec bins |
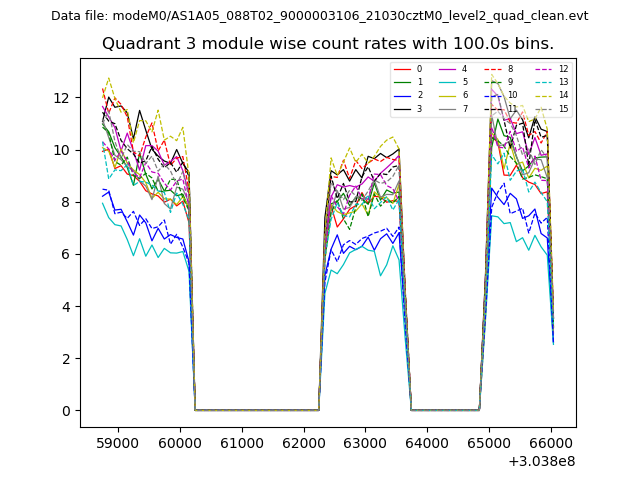 |
 |
| Parameter | Plot |
|---|---|
| CZT HV Monitor | 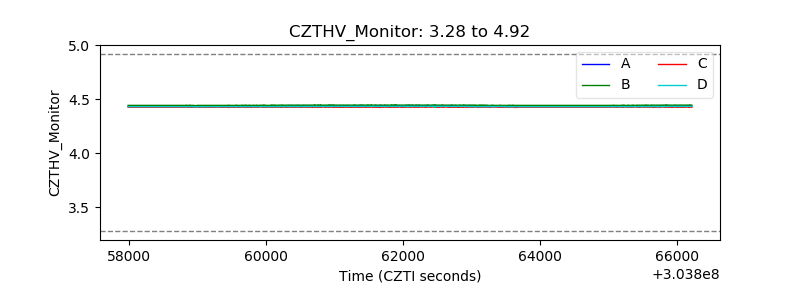 |
| D_VDD | 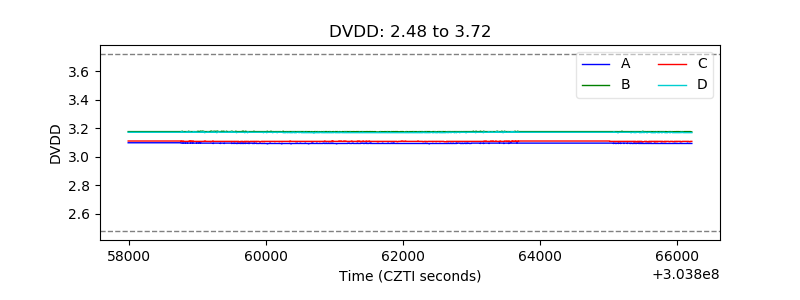 |
| Temperature 1 | 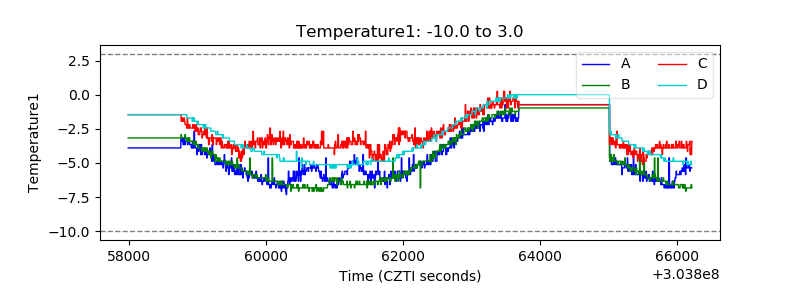 |
| Veto HV Monitor | 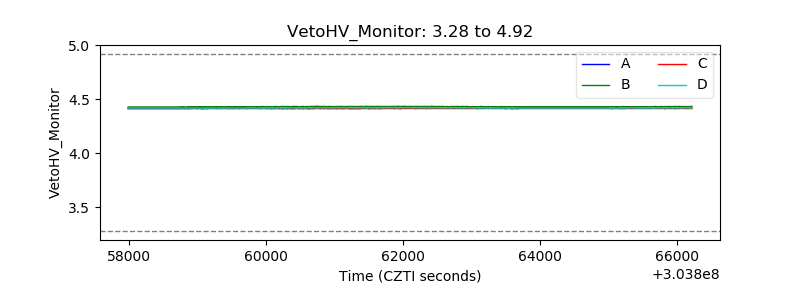 |
| Veto LLD |  |
| Alpha Counter | 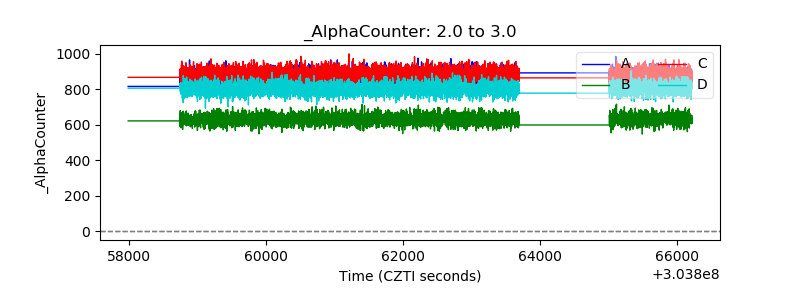 |
| _CPM_Rate | 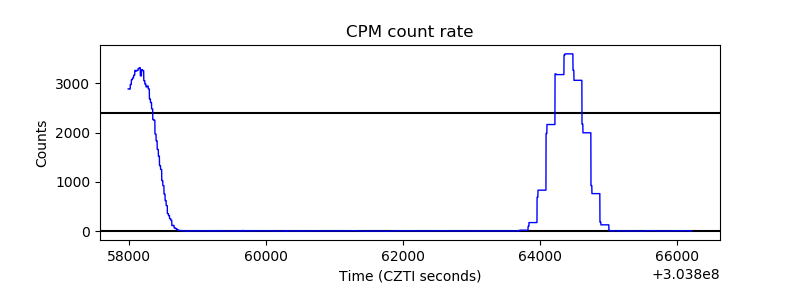 |
| CZT Counter | 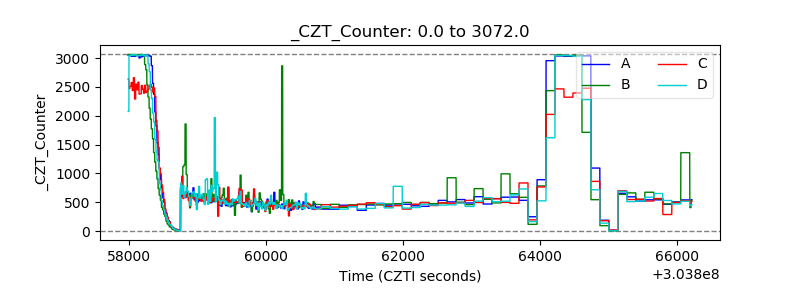 |
| +2.5 Volts monitor |  |
| +5 Volts monitor |  |
| _ROLL_ROT | 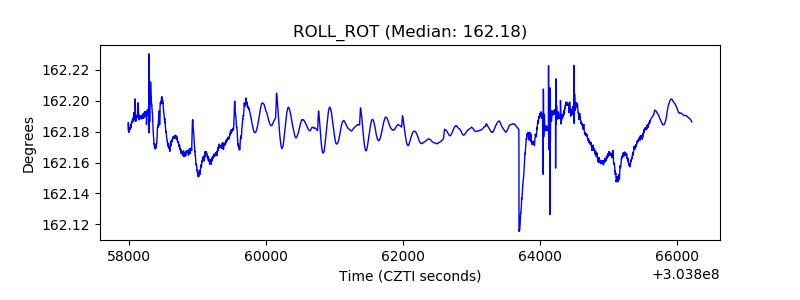 |
| _Roll_DEC | 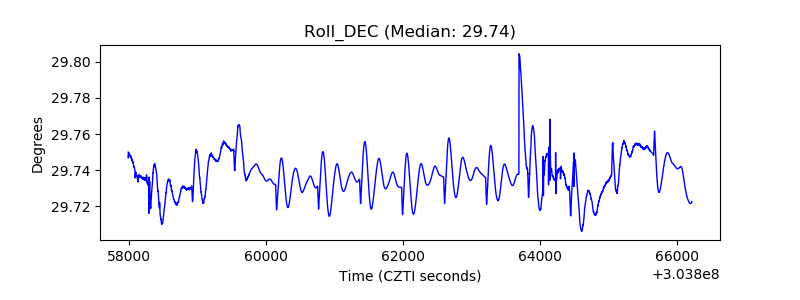 |
| _Roll_RA | 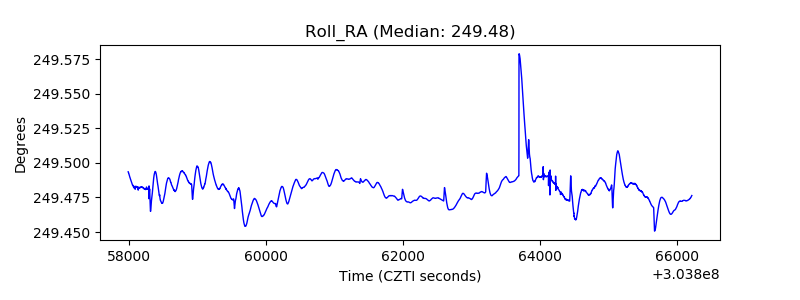 |
| Veto Counter | 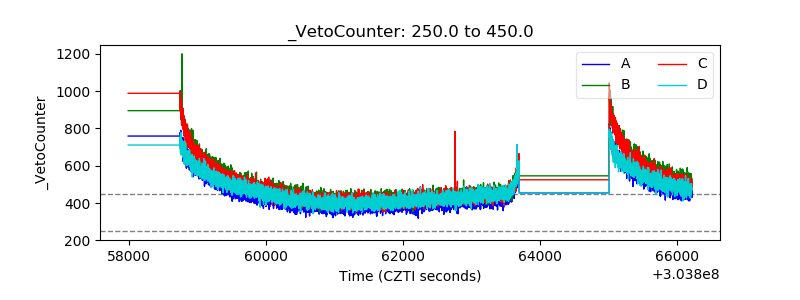 |