| Param | Original file | Final file |
|---|---|---|
| Filename | modeM0/AS1A05_088T02_9000003106_21031cztM0_level2.evt | modeM0/AS1A05_088T02_9000003106_21031cztM0_level2_quad_clean.evt |
| Size (bytes) | 476,311,680 | 83,977,920 |
| Size | 454.2 MB | 80.1 MB |
| Events in quadrant A | 3,096,356 | 545,224 |
| Events in quadrant B | 3,458,433 | 554,268 |
| Events in quadrant C | 3,134,394 | 519,970 |
| Events in quadrant D | 4,320,549 | 496,341 |
| Mode M9 | |||
|---|---|---|---|
| Quadrant | BADHDUFLAG | Total packets | Discarded packets |
| A | 0 | 25 | 0 |
| B | 0 | 26 | 0 |
| C | 0 | 26 | 0 |
| D | 0 | 26 | 0 |
| Mode SS | |||
|---|---|---|---|
| Quadrant | BADHDUFLAG | Total packets | Discarded packets |
| A | 0 | 124 | 0 |
| B | 0 | 124 | 0 |
| C | 0 | 124 | 0 |
| D | 0 | 124 | 0 |
| Mode M0 | |||
|---|---|---|---|
| Quadrant | BADHDUFLAG | Total packets | Discarded packets |
| A | 0 | 12814 | 2 |
| B | 0 | 14068 | 2 |
| C | 0 | 12932 | 2 |
| D | 0 | 16860 | 2 |
| Quadrant | Total seconds | Saturated seconds | Saturation percentage |
|---|---|---|---|
| A | 6122 | 19 | 0.310356% |
| B | 6122 | 49 | 0.800392% |
| C | 6122 | 28 | 0.457367% |
| D | 6122 | 311 | 5.080039% |
Noise dominated data is calculated using 1-second bins in cleaned event files. If a bin has >2000 counts, and if more than 50% of those come from <1% of pixels, then it is considered to be noise-dominated and hence unusable.
| Quadrant | # 1 sec bins | Bins with >0 counts | Bins with >2000 counts | High rate bins dominated by noise | Noise dominated (total time) | Noise dominated (detector-on time) | Marked lightcurve |
|---|---|---|---|---|---|---|---|
| A | 7497 | 6123 | 0 | 0 | 0.00% | 0.00% | 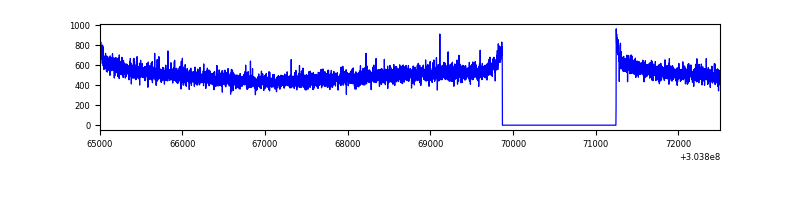 |
| B | 7497 | 6123 | 19 | 19 | 0.25% | 0.31% | 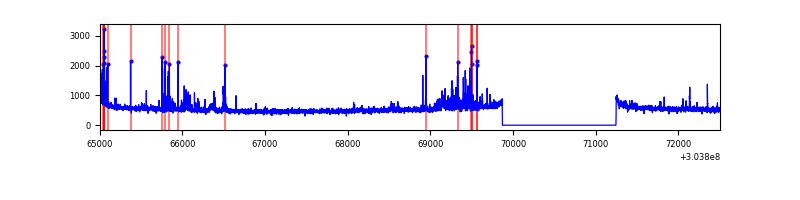 |
| C | 7497 | 6123 | 0 | 0 | 0.00% | 0.00% | 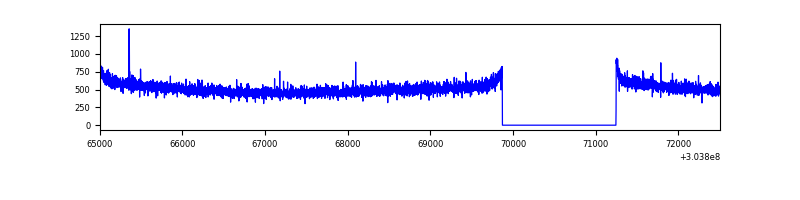 |
| D | 7497 | 6123 | 308 | 308 | 4.11% | 5.03% | 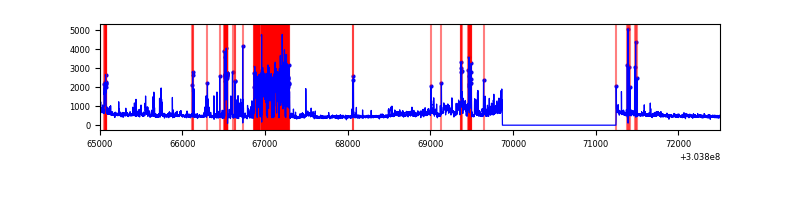 |
Top three noisy pixels from each quadrant. If the there are fewer than three noisy pixels in the level2.evt file, extra rows are filled as -1
| Pixel properties | Quadrant properties | ||||||
|---|---|---|---|---|---|---|---|
| Quadrant | DetID | PixID | Counts | Sigma | Mean | Median | Sigma |
| A | 13 | 254 | 8014 | 45.16 | 804 | 790 | 160.0 |
| A | 0 | 226 | 6880 | 38.07 | 804 | 790 | 160.0 |
| A | 3 | 137 | 6124 | 33.34 | 804 | 790 | 160.0 |
| B | 0 | 189 | 116231 | 769.37 | 810 | 791 | 150.0 |
| B | 7 | 220 | 106649 | 705.51 | 810 | 791 | 150.0 |
| B | 0 | 230 | 20690 | 132.62 | 810 | 791 | 150.0 |
| C | 14 | 238 | 122352 | 677.57 | 772 | 780 | 179.4 |
| C | 13 | 61 | 5351 | 25.48 | 772 | 780 | 179.4 |
| C | 9 | 54 | 4044 | 18.19 | 772 | 780 | 179.4 |
| D | 1 | 52 | 1191793 | 6467.69 | 758 | 739 | 184.2 |
| D | 7 | 223 | 134580 | 726.79 | 758 | 739 | 184.2 |
| D | 15 | 0 | 61638 | 330.69 | 758 | 739 | 184.2 |
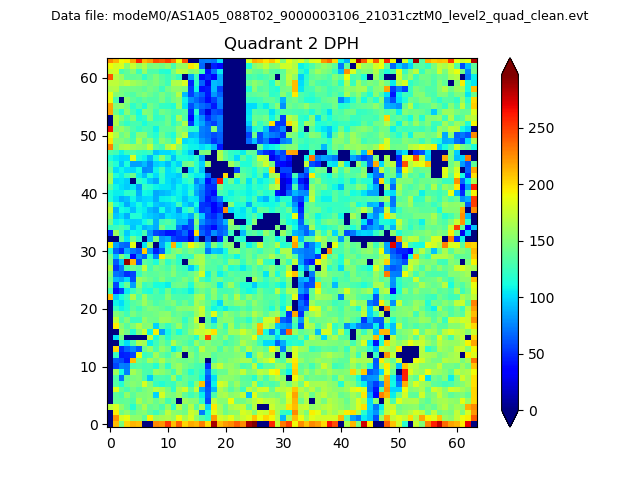
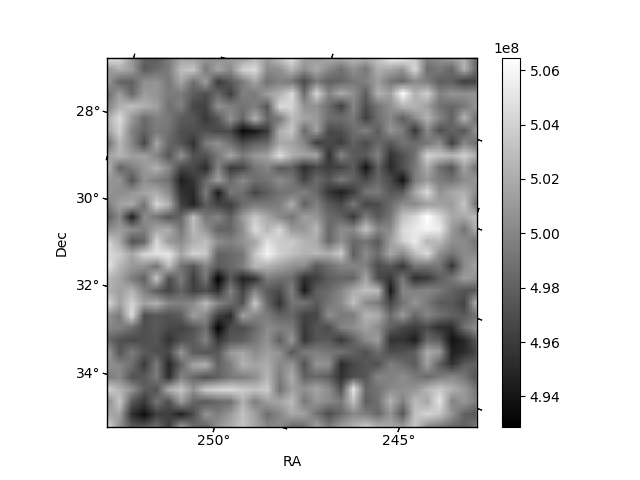
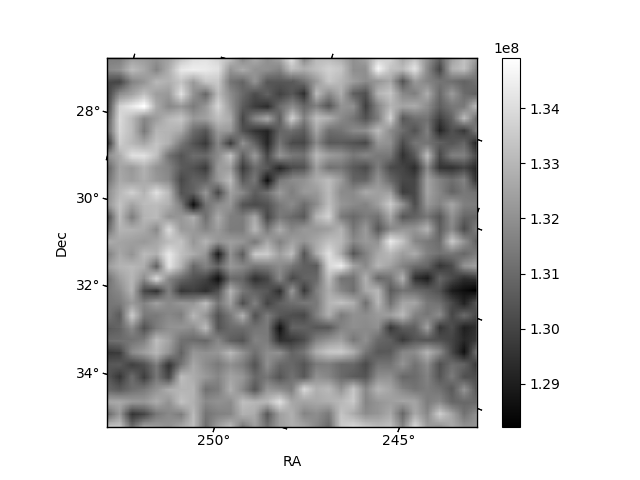
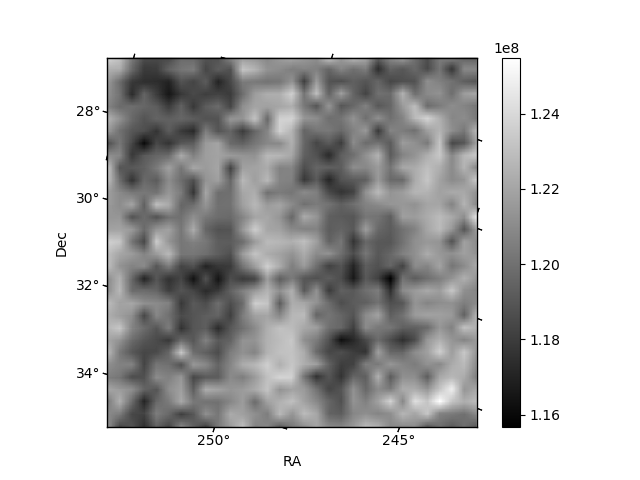
Histogram calculated using DETX and DETY for each event in the final _common_clean file
| Quadrant A | 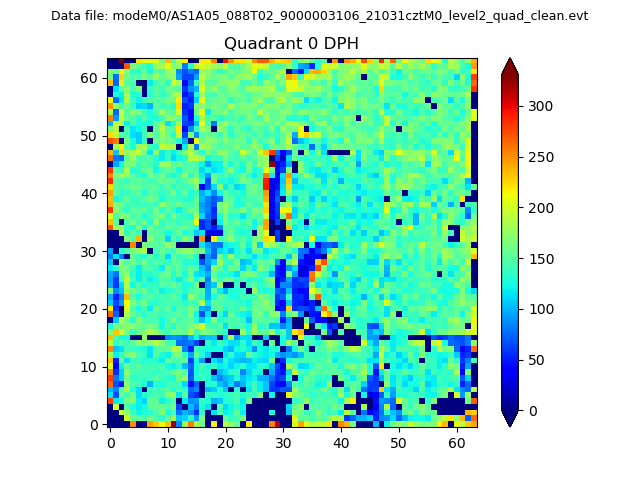 |
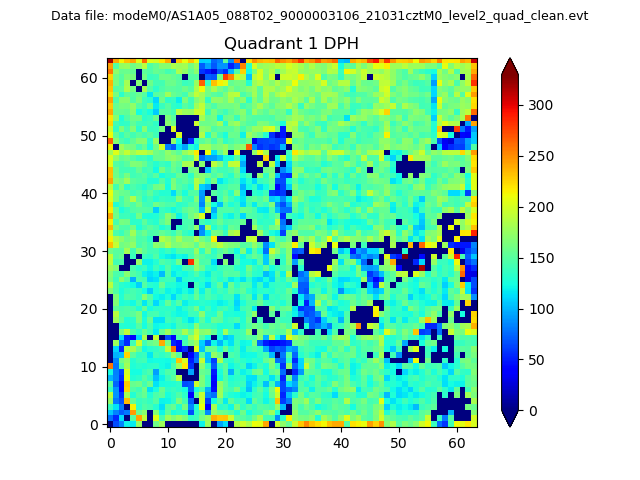 |
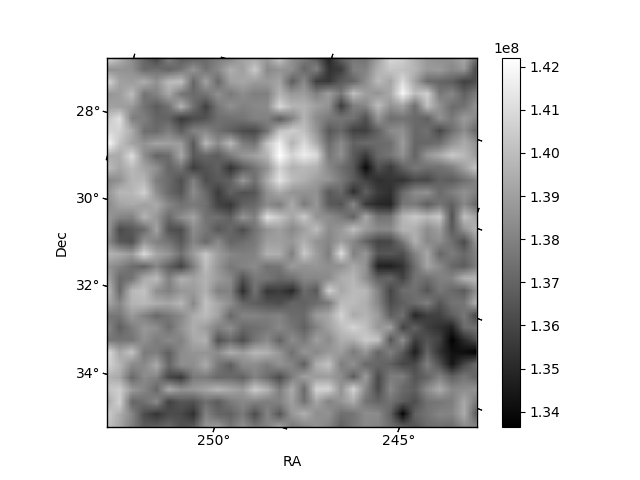
Quadrant B |
|---|---|---|---|
| Quadrant D | 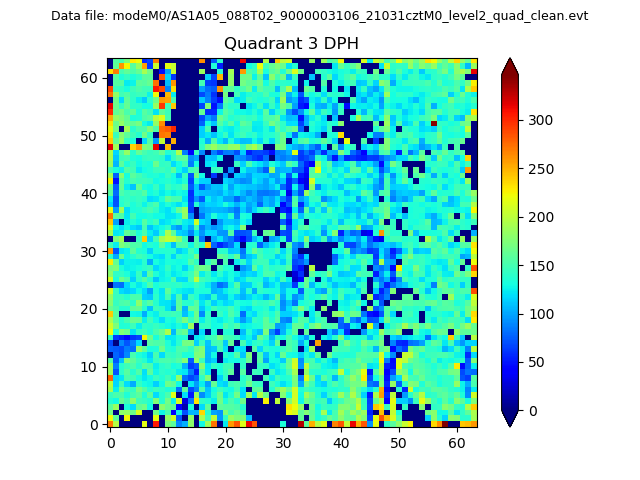 |
 |
Quadrant C |
| Plot type | Count rate plots | Images |
|---|---|---|
| Comparison with Poisson distribution Blue bars denote a histogram of data divided into 1 sec bins. Red curve is a Poisson curve with rate = median count rate of data. |
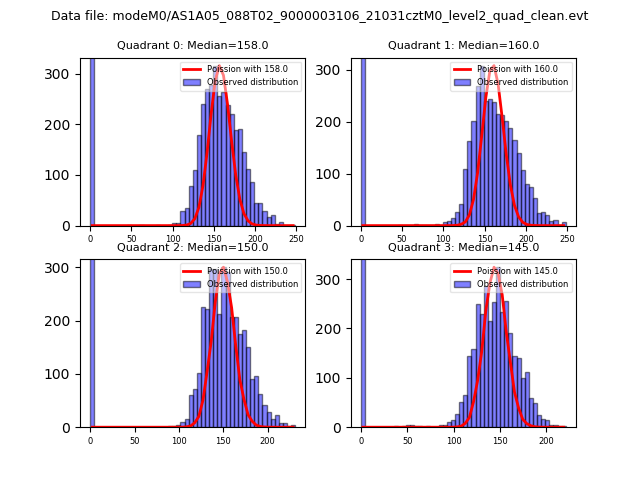 |
 |
| Quadrant-wise count rates Data is divided into 100 sec bins |
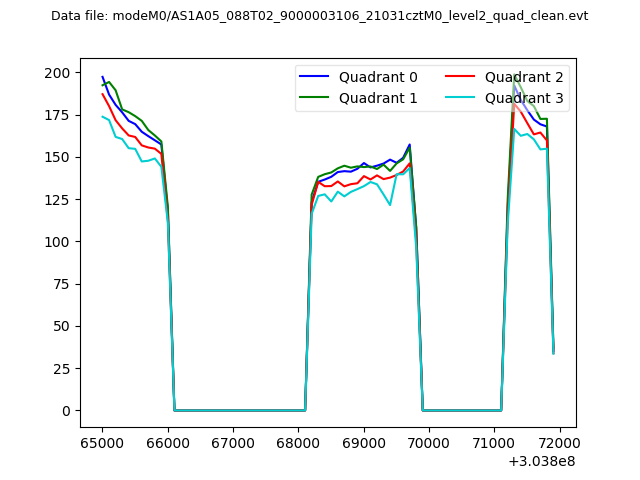 |
|
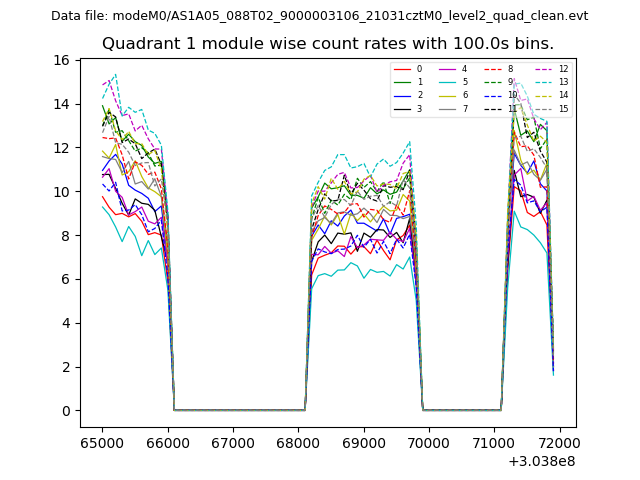
| Module-wise count rates for Quadrant A Data is divided into 100 sec bins |
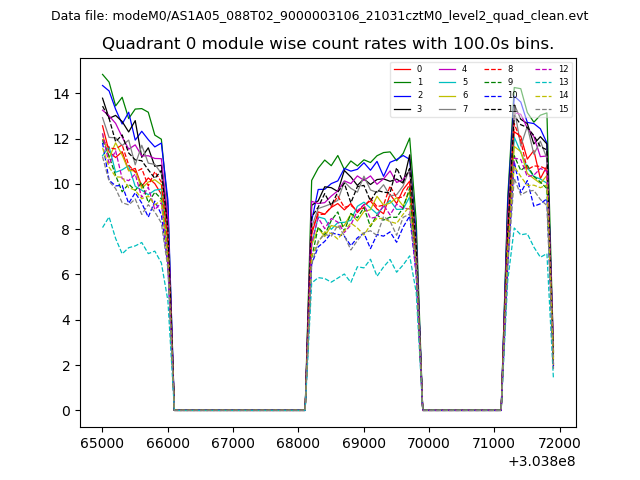 |
 |
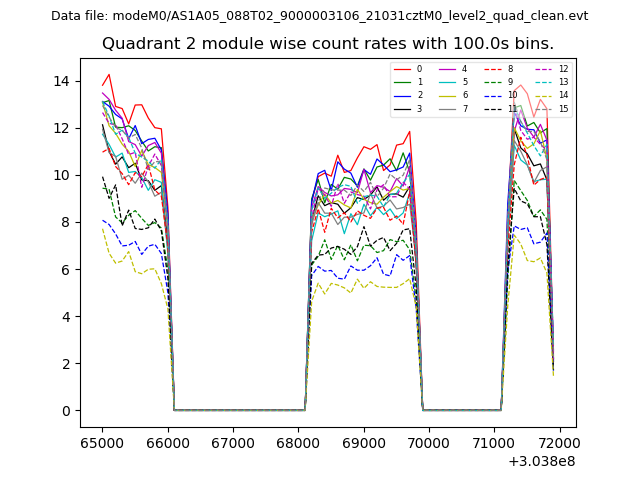
| Module-wise count rates for Quadrant B Data is divided into 100 sec bins |
 |
 |
| Module-wise count rates for Quadrant C Data is divided into 100 sec bins |
 |
 |
| Module-wise count rates for Quadrant D Data is divided into 100 sec bins |
 |
 |
| Parameter | Plot |
|---|---|
| CZT HV Monitor | 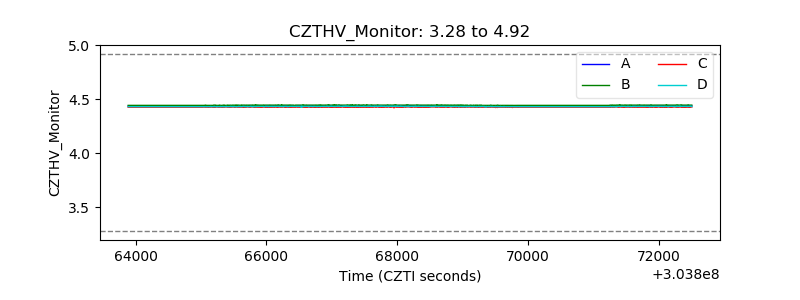 |
| D_VDD | 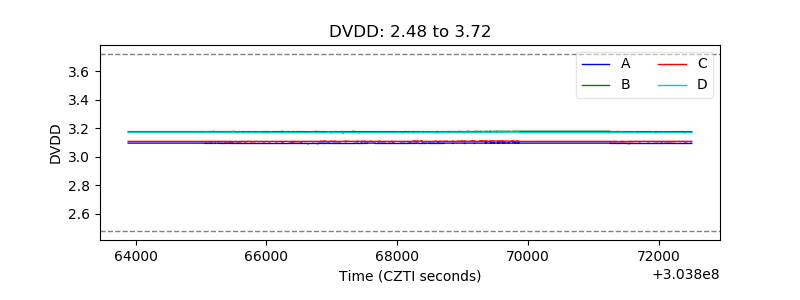 |
| Temperature 1 | 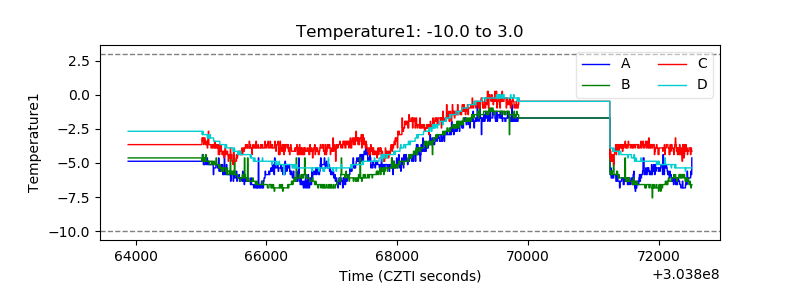 |
| Veto HV Monitor | 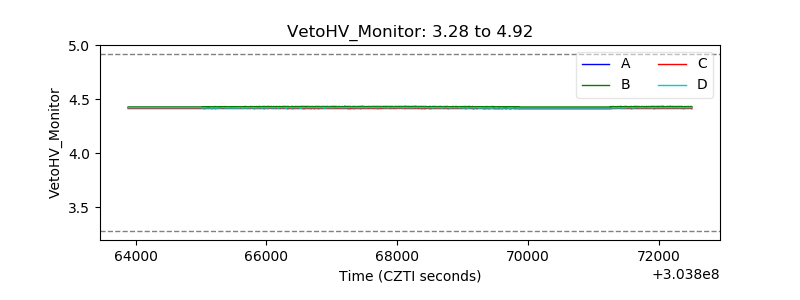 |
| Veto LLD | 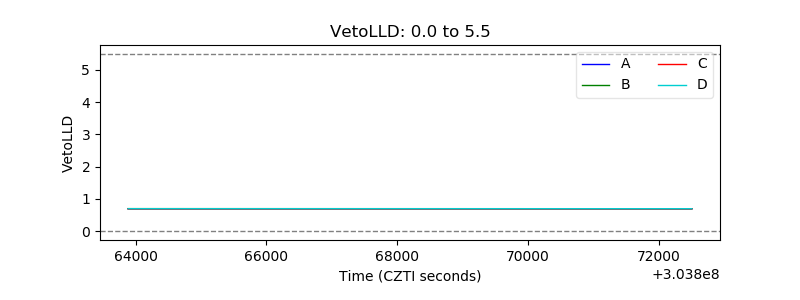 |
| Alpha Counter | 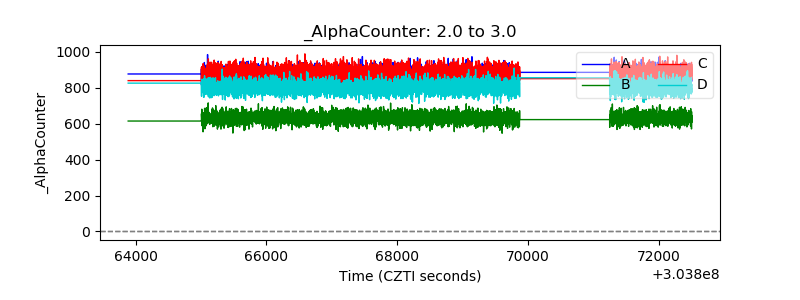 |
| _CPM_Rate | 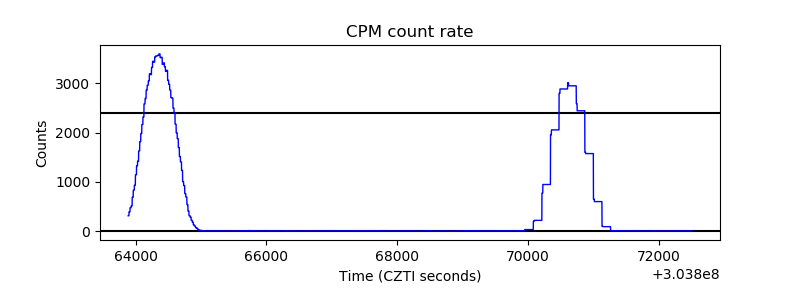 |
| CZT Counter | 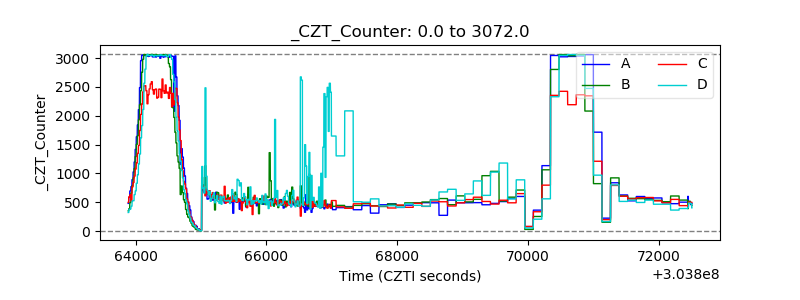 |
| +2.5 Volts monitor |  |
| +5 Volts monitor | 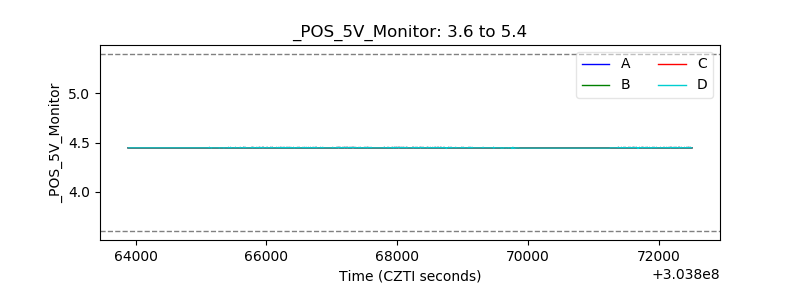 |
| _ROLL_ROT | 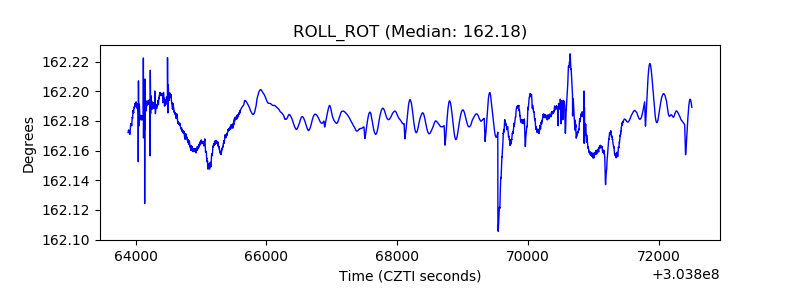 |
| _Roll_DEC | 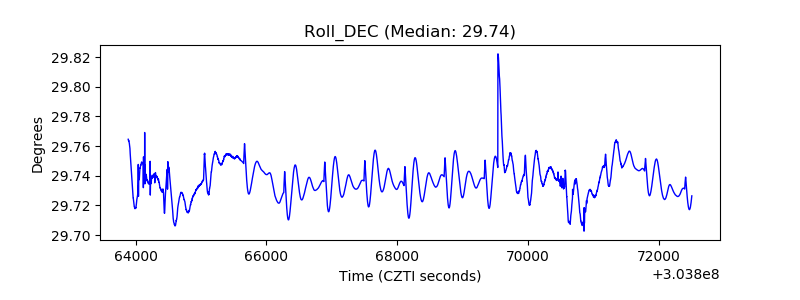 |
| _Roll_RA | 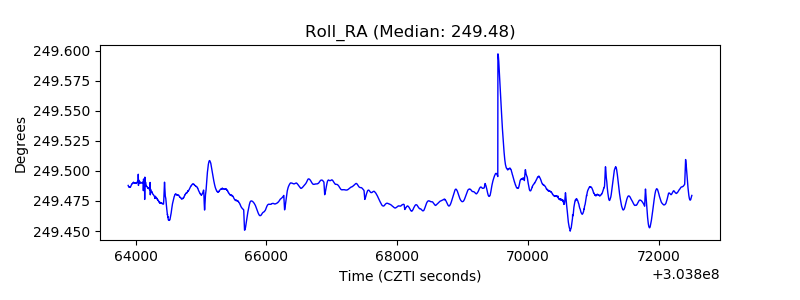 |
| Veto Counter | 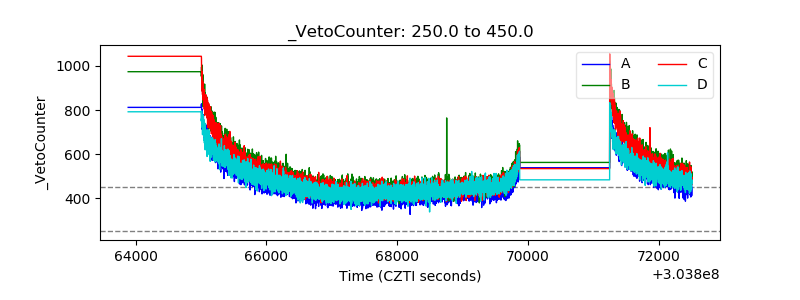 |