| Param | Original file | Final file |
|---|---|---|
| Filename | modeM0/AS1A05_088T02_9000003106_21032cztM0_level2.evt | modeM0/AS1A05_088T02_9000003106_21032cztM0_level2_quad_clean.evt |
| Size (bytes) | 462,816,000 | 76,141,440 |
| Size | 441.4 MB | 72.6 MB |
| Events in quadrant A | 3,259,801 | 477,112 |
| Events in quadrant B | 3,584,754 | 485,968 |
| Events in quadrant C | 3,281,512 | 454,843 |
| Events in quadrant D | 3,455,610 | 441,067 |
| Mode M9 | |||
|---|---|---|---|
| Quadrant | BADHDUFLAG | Total packets | Discarded packets |
| A | 0 | 20 | 0 |
| B | 0 | 21 | 0 |
| C | 0 | 21 | 0 |
| D | 0 | 21 | 0 |
| Mode SS | |||
|---|---|---|---|
| Quadrant | BADHDUFLAG | Total packets | Discarded packets |
| A | 0 | 128 | 0 |
| B | 0 | 128 | 0 |
| C | 0 | 128 | 0 |
| D | 0 | 128 | 0 |
| Mode M0 | |||
|---|---|---|---|
| Quadrant | BADHDUFLAG | Total packets | Discarded packets |
| A | 0 | 13398 | 1 |
| B | 0 | 14428 | 1 |
| C | 0 | 13489 | 1 |
| D | 0 | 14390 | 1 |
| Quadrant | Total seconds | Saturated seconds | Saturation percentage |
|---|---|---|---|
| A | 6408 | 61 | 0.951935% |
| B | 6408 | 106 | 1.654182% |
| C | 6408 | 92 | 1.435705% |
| D | 6408 | 75 | 1.170412% |
Noise dominated data is calculated using 1-second bins in cleaned event files. If a bin has >2000 counts, and if more than 50% of those come from <1% of pixels, then it is considered to be noise-dominated and hence unusable.
| Quadrant | # 1 sec bins | Bins with >0 counts | Bins with >2000 counts | High rate bins dominated by noise | Noise dominated (total time) | Noise dominated (detector-on time) | Marked lightcurve |
|---|---|---|---|---|---|---|---|
| A | 7733 | 6409 | 0 | 0 | 0.00% | 0.00% | 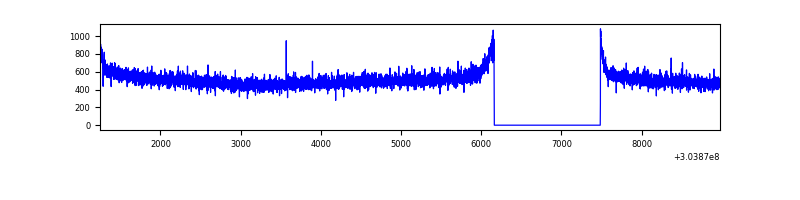 |
| B | 7733 | 6409 | 11 | 11 | 0.14% | 0.17% | 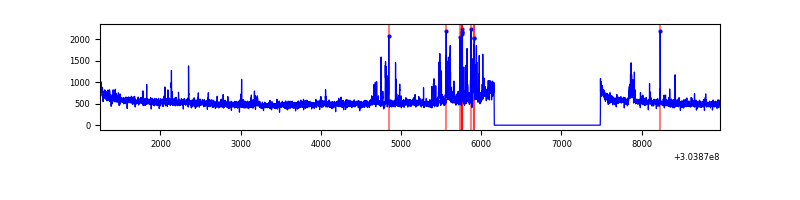 |
| C | 7733 | 6409 | 0 | 0 | 0.00% | 0.00% | 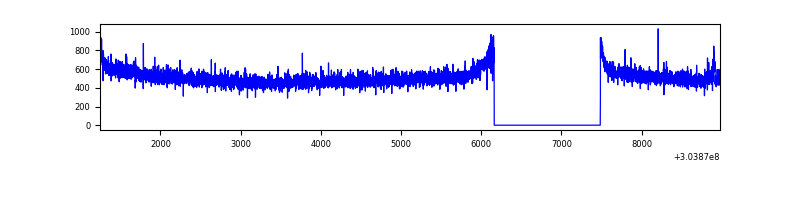 |
| D | 7733 | 6409 | 27 | 27 | 0.35% | 0.42% | 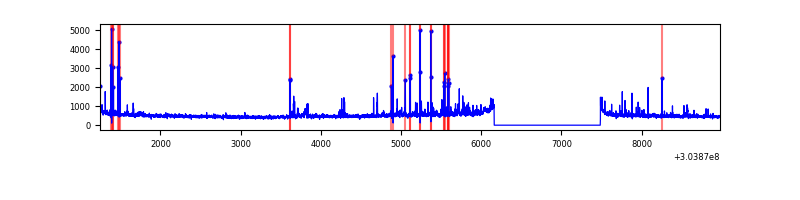 |
Top three noisy pixels from each quadrant. If the there are fewer than three noisy pixels in the level2.evt file, extra rows are filled as -1
| Pixel properties | Quadrant properties | ||||||
|---|---|---|---|---|---|---|---|
| Quadrant | DetID | PixID | Counts | Sigma | Mean | Median | Sigma |
| A | 13 | 254 | 7480 | 39.53 | 845 | 831 | 168.2 |
| A | 0 | 226 | 7294 | 38.42 | 845 | 831 | 168.2 |
| A | 3 | 137 | 6434 | 33.31 | 845 | 831 | 168.2 |
| B | 0 | 190 | 67122 | 416.55 | 852 | 833 | 159.1 |
| B | 0 | 228 | 56490 | 349.74 | 852 | 833 | 159.1 |
| B | 0 | 230 | 40991 | 252.35 | 852 | 833 | 159.1 |
| C | 14 | 238 | 128050 | 679.21 | 807 | 815 | 187.3 |
| C | 9 | 54 | 8678 | 41.97 | 807 | 815 | 187.3 |
| C | 13 | 61 | 5494 | 24.98 | 807 | 815 | 187.3 |
| D | 1 | 52 | 245081 | 1257.46 | 808 | 786 | 194.3 |
| D | 1 | 20 | 46377 | 234.67 | 808 | 786 | 194.3 |
| D | 7 | 223 | 34369 | 172.86 | 808 | 786 | 194.3 |
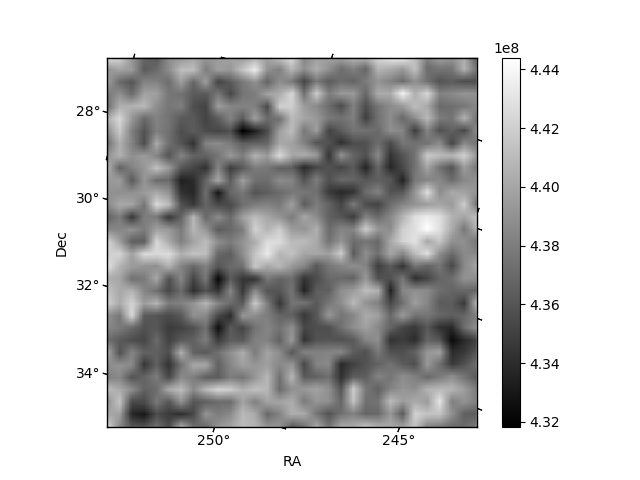
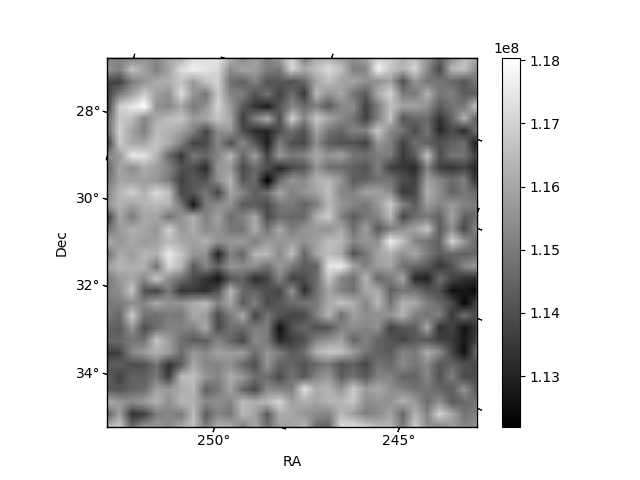
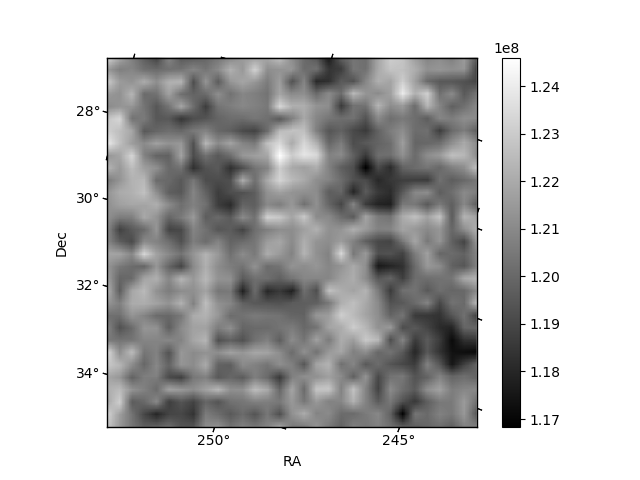
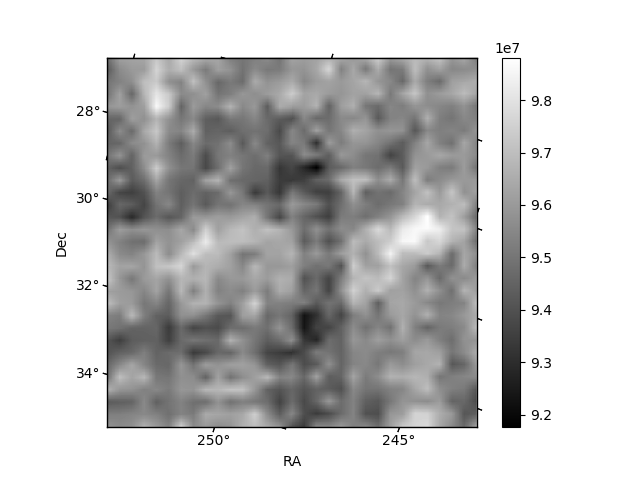
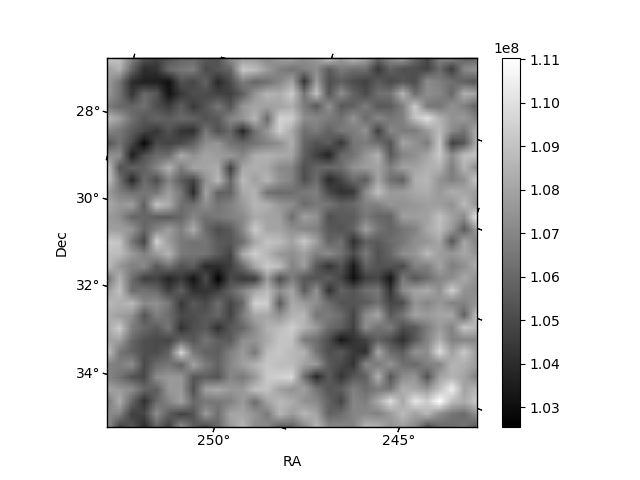
Histogram calculated using DETX and DETY for each event in the final _common_clean file
| Quadrant A | 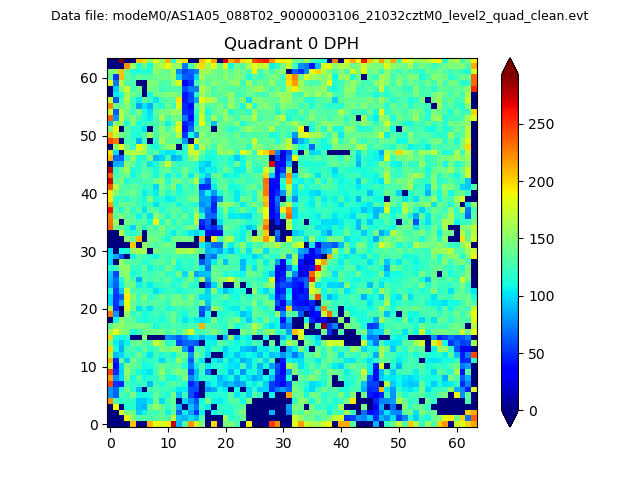 |
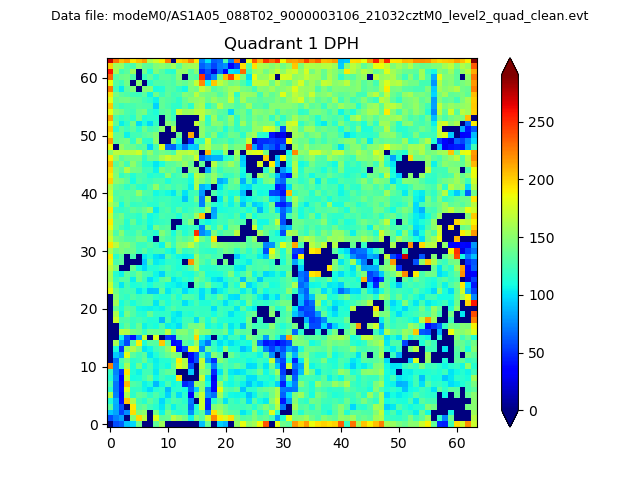 |
Quadrant B |
|---|---|---|---|
| Quadrant D | 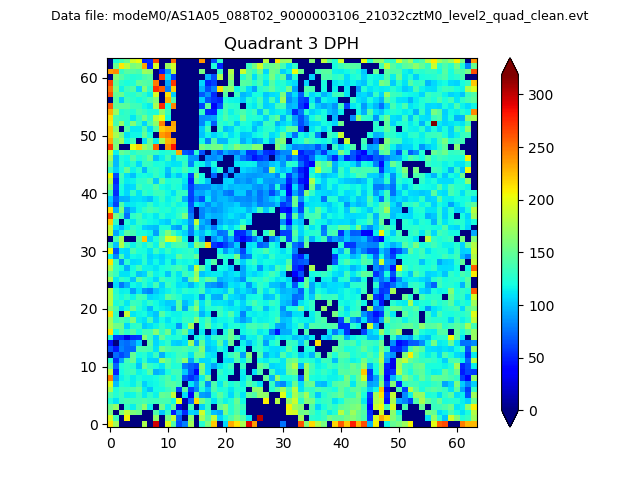 |
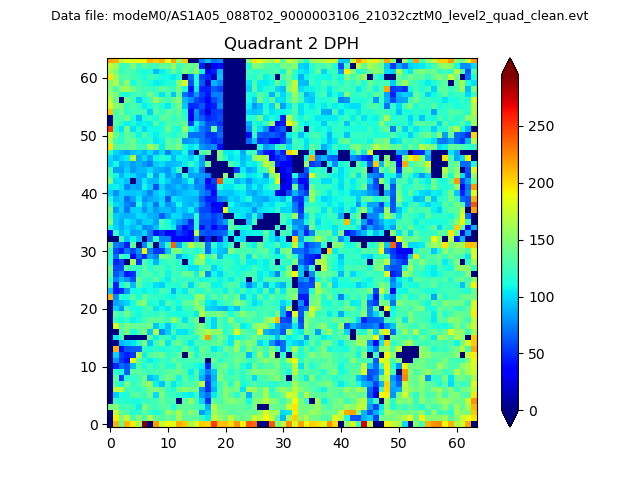 |
Quadrant C |
| Plot type | Count rate plots | Images |
|---|---|---|
| Comparison with Poisson distribution Blue bars denote a histogram of data divided into 1 sec bins. Red curve is a Poisson curve with rate = median count rate of data. |
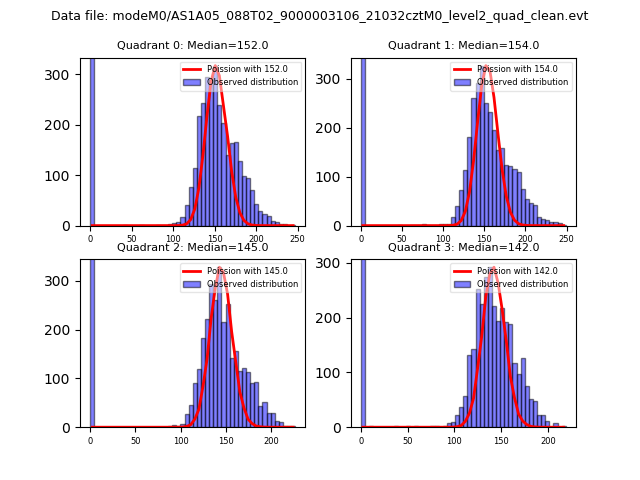 |
 |
| Quadrant-wise count rates Data is divided into 100 sec bins |
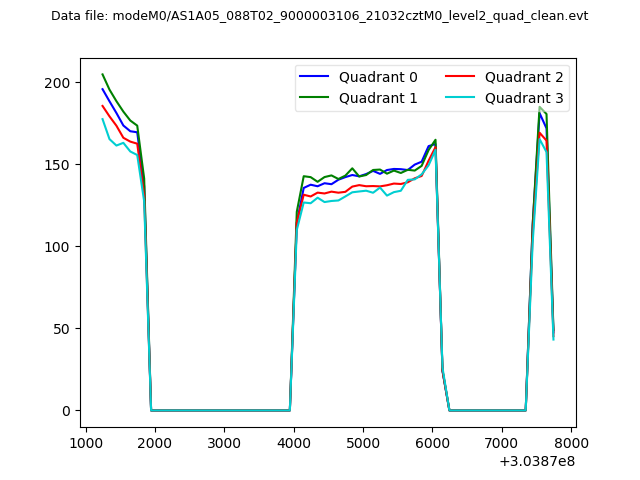 |
|
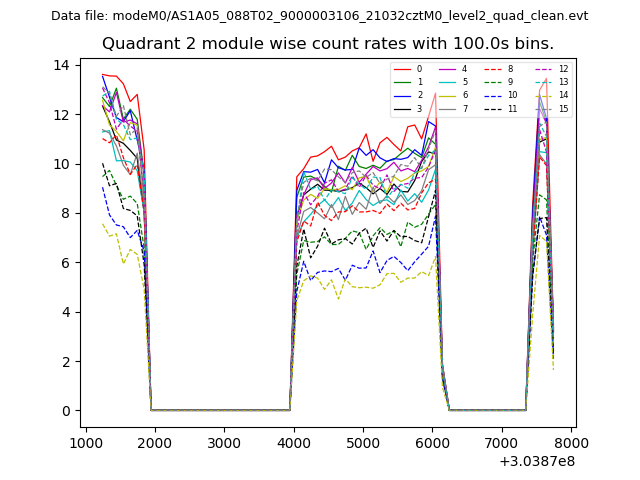
| Module-wise count rates for Quadrant A Data is divided into 100 sec bins |
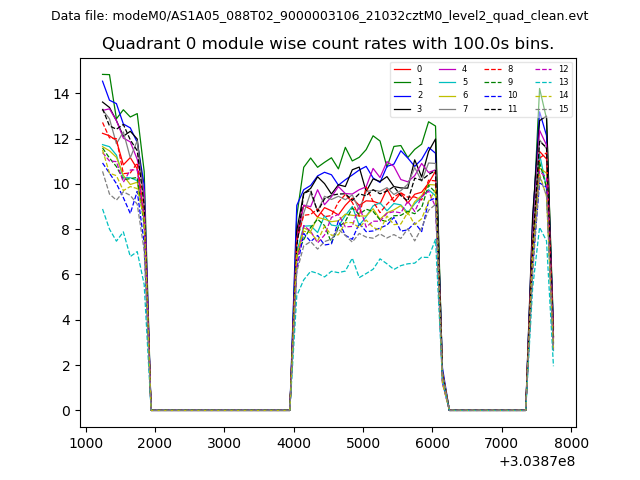 |
 |
| Module-wise count rates for Quadrant B Data is divided into 100 sec bins |
 |
 |
| Module-wise count rates for Quadrant C Data is divided into 100 sec bins |
 |
 |
| Module-wise count rates for Quadrant D Data is divided into 100 sec bins |
 |
 |
| Parameter | Plot |
|---|---|
| CZT HV Monitor |  |
| D_VDD | 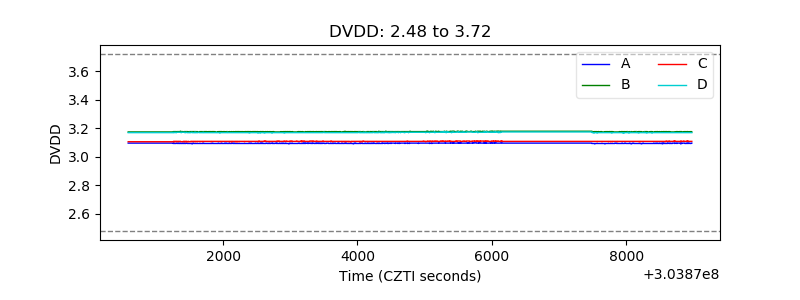 |
| Temperature 1 | 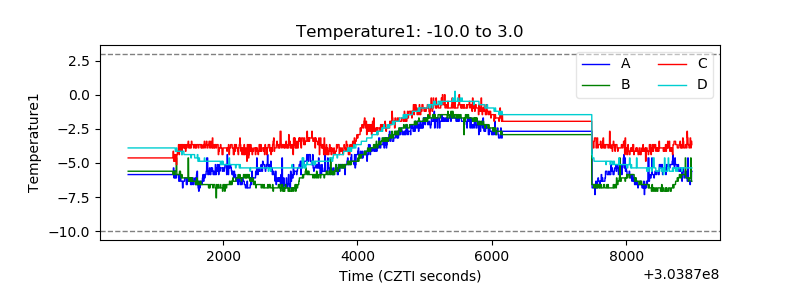 |
| Veto HV Monitor | 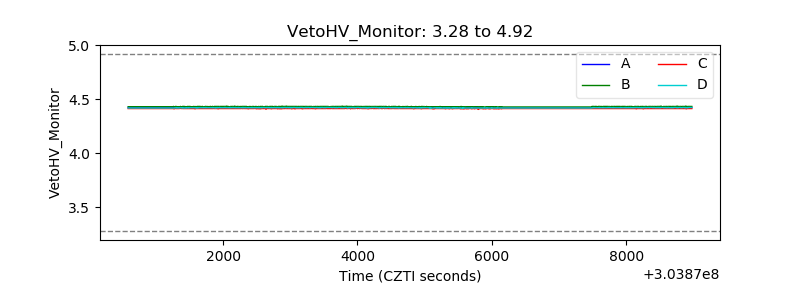 |
| Veto LLD |  |
| Alpha Counter | 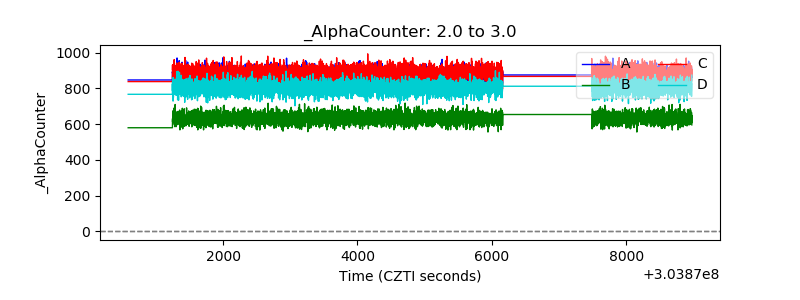 |
| _CPM_Rate | 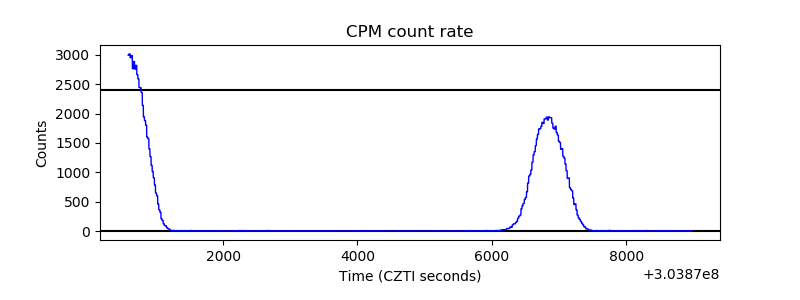 |
| CZT Counter | 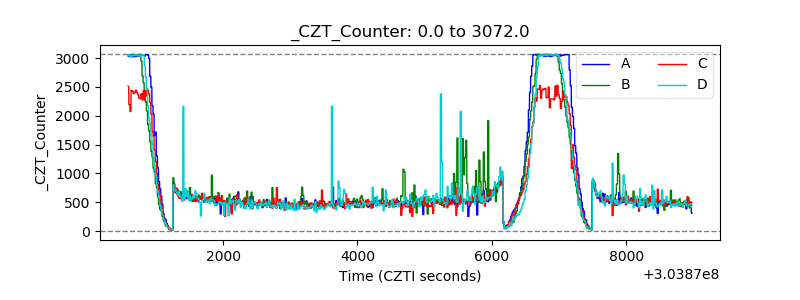 |
| +2.5 Volts monitor |  |
| +5 Volts monitor |  |
| _ROLL_ROT |  |
| _Roll_DEC | 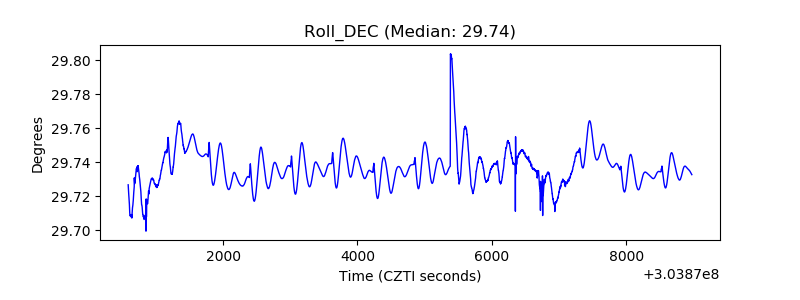 |
| _Roll_RA | 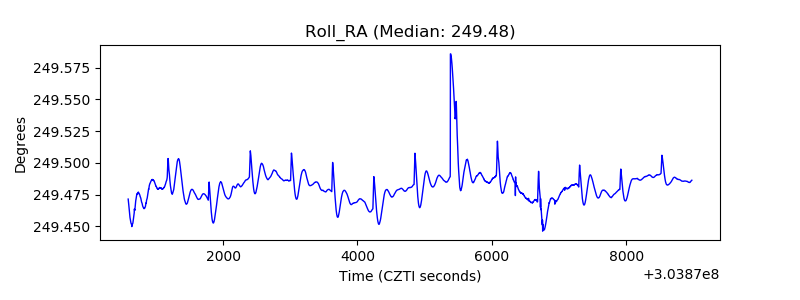 |
| Veto Counter |  |