| Param | Original file | Final file |
|---|---|---|
| Filename | modeM0/AS1A05_088T02_9000003106_21033cztM0_level2.evt | modeM0/AS1A05_088T02_9000003106_21033cztM0_level2_quad_clean.evt |
| Size (bytes) | 461,548,800 | 66,574,080 |
| Size | 440.2 MB | 63.5 MB |
| Events in quadrant A | 3,219,313 | 402,093 |
| Events in quadrant B | 3,472,074 | 404,951 |
| Events in quadrant C | 3,254,993 | 380,973 |
| Events in quadrant D | 3,590,197 | 374,160 |
| Mode M9 | |||
|---|---|---|---|
| Quadrant | BADHDUFLAG | Total packets | Discarded packets |
| A | 0 | 12 | 0 |
| B | 0 | 12 | 0 |
| C | 0 | 12 | 0 |
| D | 0 | 12 | 0 |
| Mode SS | |||
|---|---|---|---|
| Quadrant | BADHDUFLAG | Total packets | Discarded packets |
| A | 0 | 132 | 0 |
| B | 0 | 132 | 0 |
| C | 0 | 132 | 0 |
| D | 0 | 132 | 0 |
| Mode M0 | |||
|---|---|---|---|
| Quadrant | BADHDUFLAG | Total packets | Discarded packets |
| A | 0 | 13392 | 1 |
| B | 0 | 14049 | 1 |
| C | 0 | 13482 | 1 |
| D | 0 | 14822 | 1 |
| Quadrant | Total seconds | Saturated seconds | Saturation percentage |
|---|---|---|---|
| A | 6500 | 39 | 0.600000% |
| B | 6501 | 86 | 1.322873% |
| C | 6500 | 75 | 1.153846% |
| D | 6500 | 84 | 1.292308% |
Noise dominated data is calculated using 1-second bins in cleaned event files. If a bin has >2000 counts, and if more than 50% of those come from <1% of pixels, then it is considered to be noise-dominated and hence unusable.
| Quadrant | # 1 sec bins | Bins with >0 counts | Bins with >2000 counts | High rate bins dominated by noise | Noise dominated (total time) | Noise dominated (detector-on time) | Marked lightcurve |
|---|---|---|---|---|---|---|---|
| A | 7735 | 6501 | 0 | 0 | 0.00% | 0.00% | 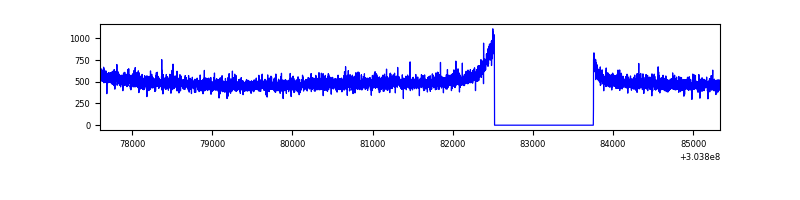 |
| B | 7736 | 6502 | 18 | 18 | 0.23% | 0.28% | 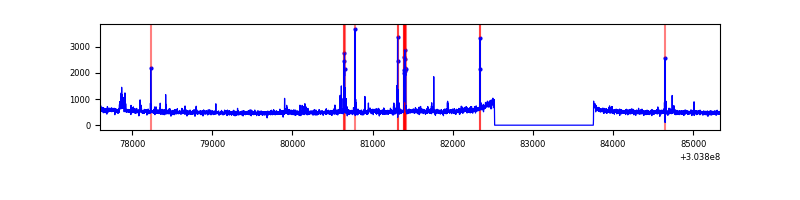 |
| C | 7735 | 6501 | 0 | 0 | 0.00% | 0.00% | 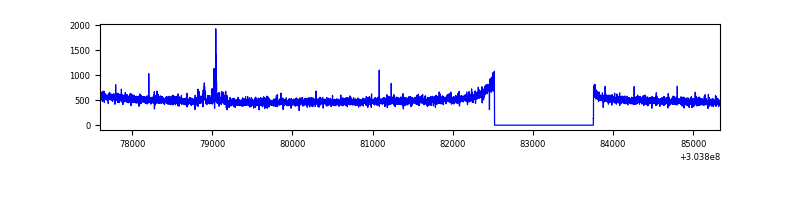 |
| D | 7735 | 6501 | 50 | 50 | 0.65% | 0.77% | 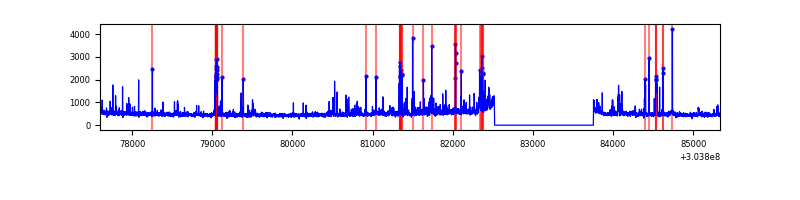 |
Top three noisy pixels from each quadrant. If the there are fewer than three noisy pixels in the level2.evt file, extra rows are filled as -1
| Pixel properties | Quadrant properties | ||||||
|---|---|---|---|---|---|---|---|
| Quadrant | DetID | PixID | Counts | Sigma | Mean | Median | Sigma |
| A | 13 | 254 | 7879 | 42.17 | 836 | 819 | 167.4 |
| A | 0 | 226 | 7143 | 37.78 | 836 | 819 | 167.4 |
| A | 3 | 137 | 6407 | 33.38 | 836 | 819 | 167.4 |
| B | 0 | 189 | 45563 | 285.69 | 836 | 816 | 156.6 |
| B | 0 | 190 | 42378 | 265.35 | 836 | 816 | 156.6 |
| B | 0 | 230 | 31550 | 196.22 | 836 | 816 | 156.6 |
| C | 14 | 238 | 126561 | 676.8 | 796 | 802 | 185.8 |
| C | 9 | 54 | 27285 | 142.52 | 796 | 802 | 185.8 |
| C | 13 | 61 | 5554 | 25.57 | 796 | 802 | 185.8 |
| D | 1 | 52 | 292572 | 1523.76 | 798 | 776 | 191.5 |
| D | 1 | 20 | 79648 | 411.87 | 798 | 776 | 191.5 |
| D | 12 | 233 | 74599 | 385.5 | 798 | 776 | 191.5 |
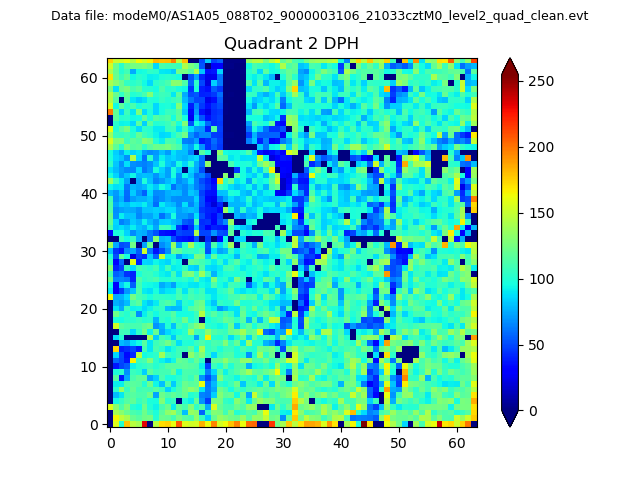
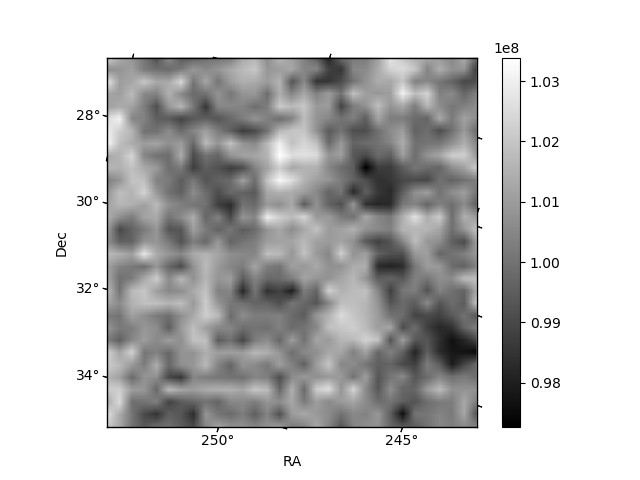
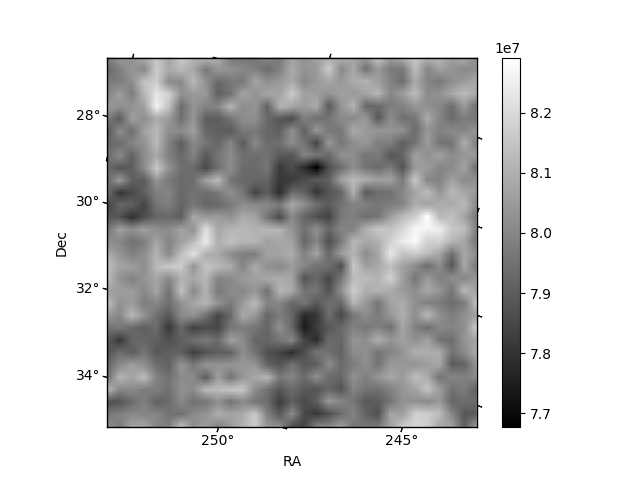
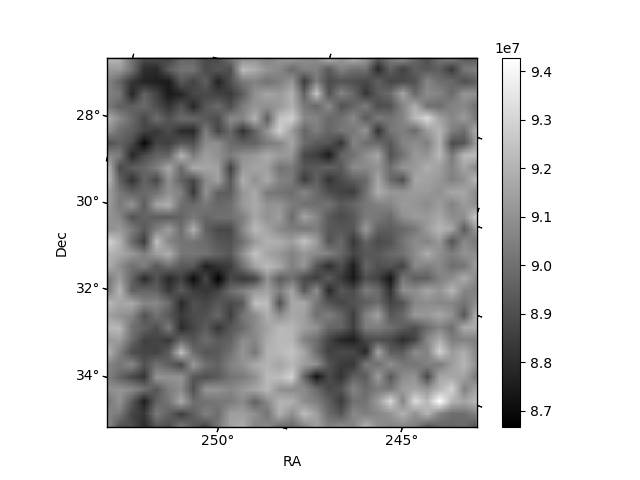
Histogram calculated using DETX and DETY for each event in the final _common_clean file
| Quadrant A | 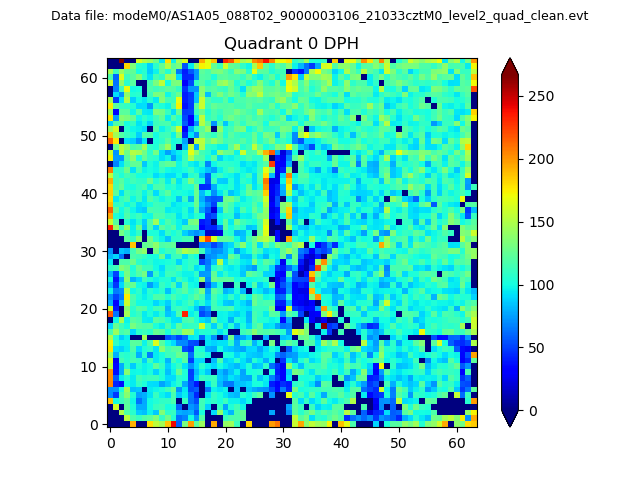 |
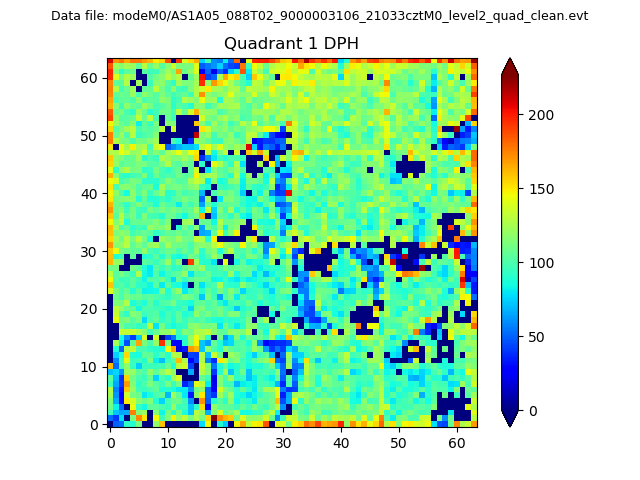 |
Quadrant B |
|---|---|---|---|
| Quadrant D | 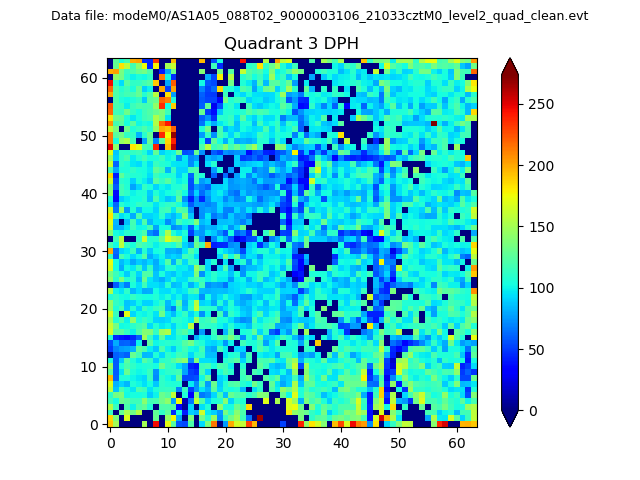 |
 |
Quadrant C |
| Plot type | Count rate plots | Images |
|---|---|---|
| Comparison with Poisson distribution Blue bars denote a histogram of data divided into 1 sec bins. Red curve is a Poisson curve with rate = median count rate of data. |
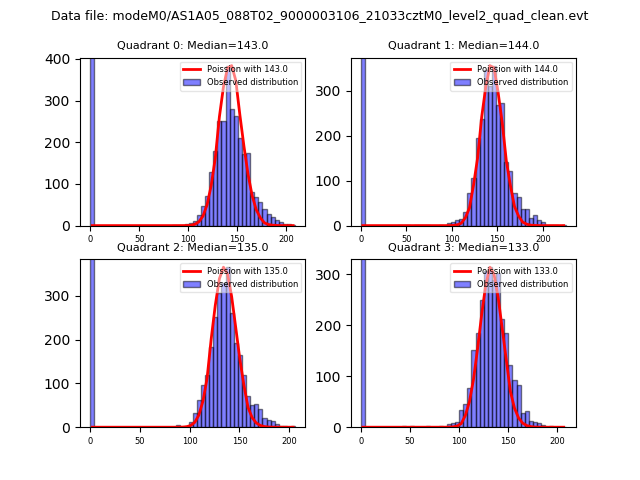 |
 |
| Quadrant-wise count rates Data is divided into 100 sec bins |
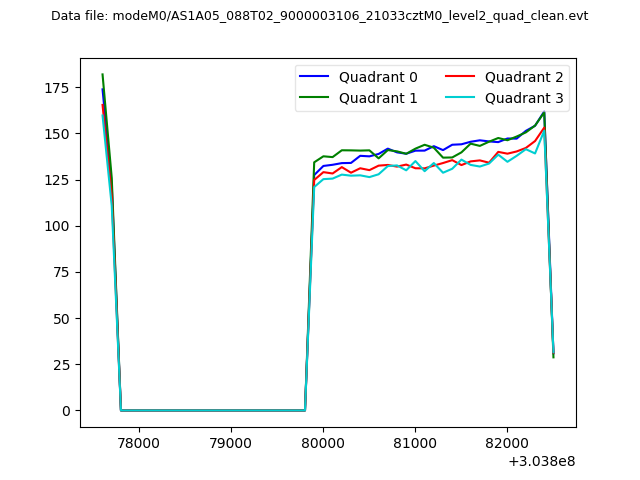 |
|
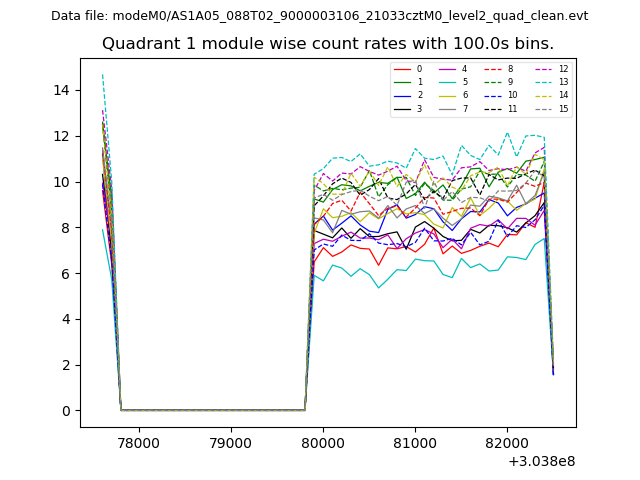
| Module-wise count rates for Quadrant A Data is divided into 100 sec bins |
 |
 |
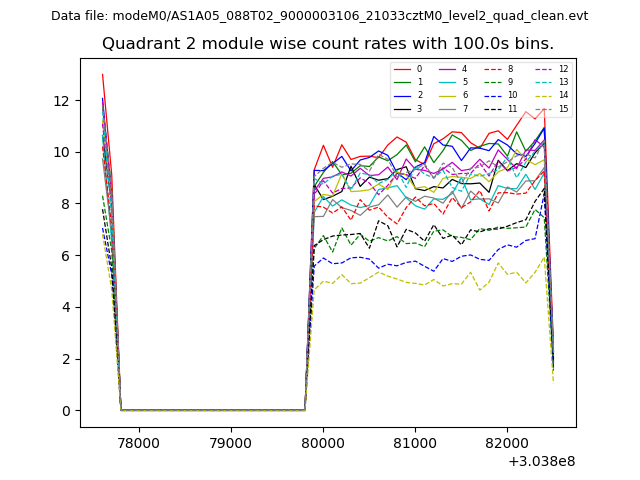
| Module-wise count rates for Quadrant B Data is divided into 100 sec bins |
 |
 |
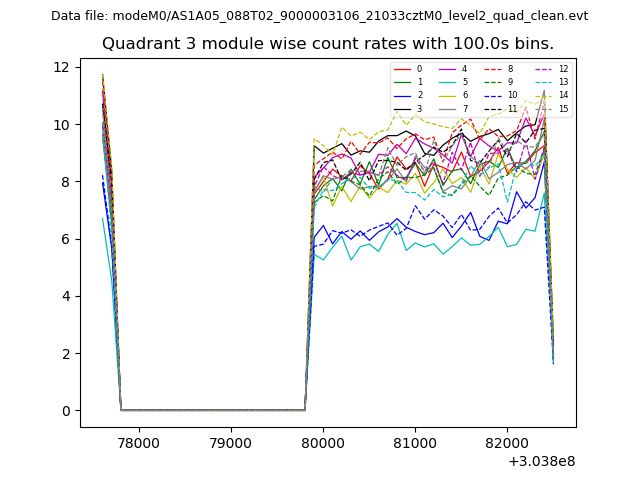
| Module-wise count rates for Quadrant C Data is divided into 100 sec bins |
 |
 |
| Module-wise count rates for Quadrant D Data is divided into 100 sec bins |
 |
 |
| Parameter | Plot |
|---|---|
| CZT HV Monitor | 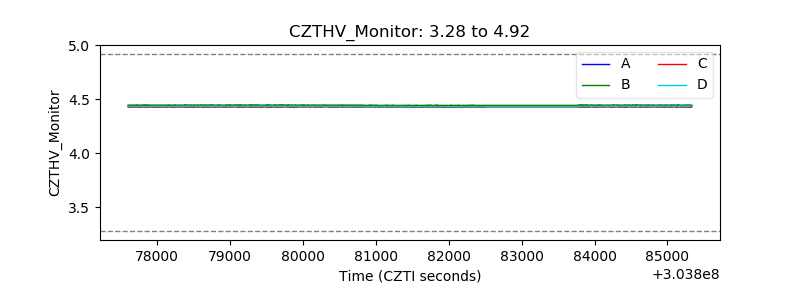 |
| D_VDD | 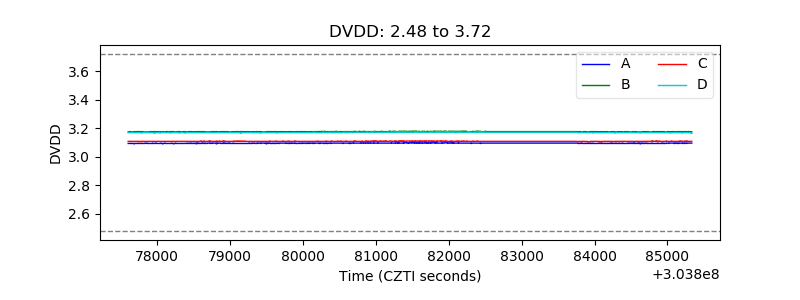 |
| Temperature 1 | 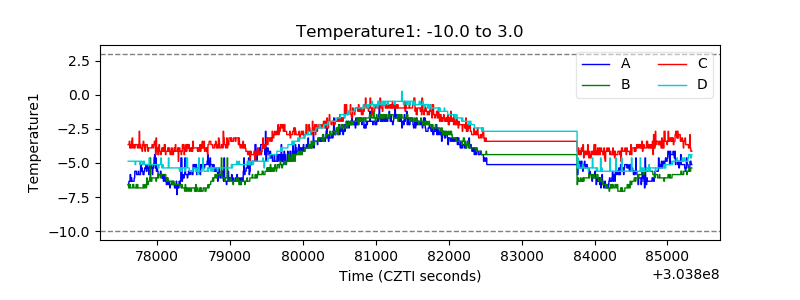 |
| Veto HV Monitor | 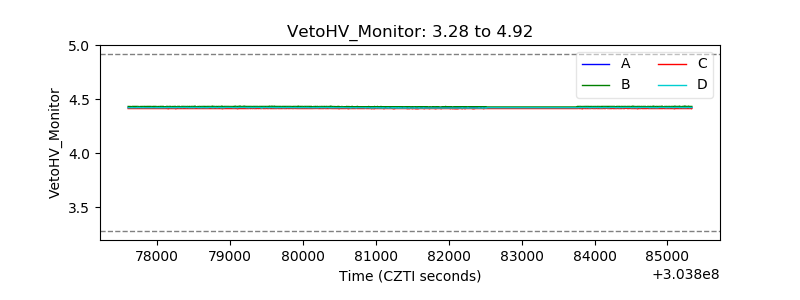 |
| Veto LLD |  |
| Alpha Counter | 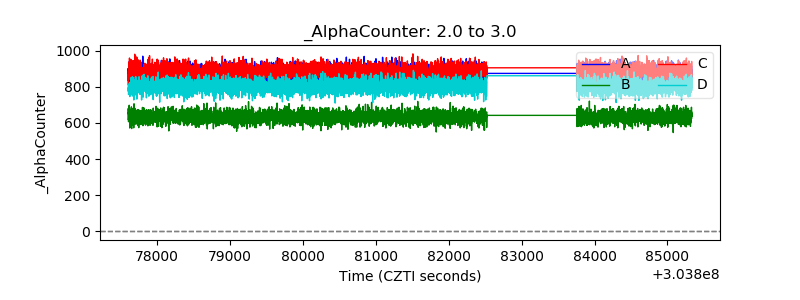 |
| _CPM_Rate | 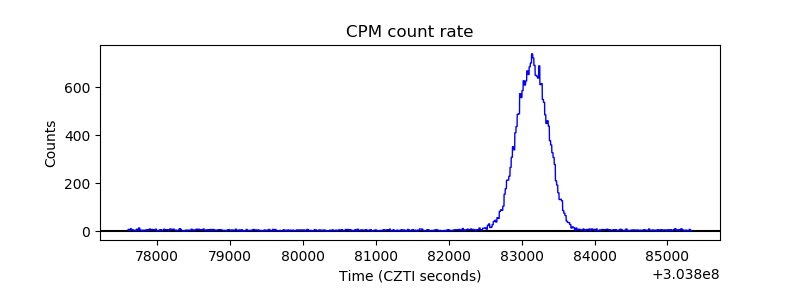 |
| CZT Counter | 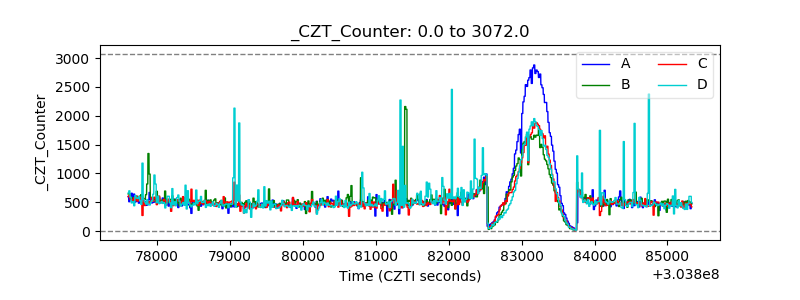 |
| +2.5 Volts monitor |  |
| +5 Volts monitor |  |
| _ROLL_ROT |  |
| _Roll_DEC | 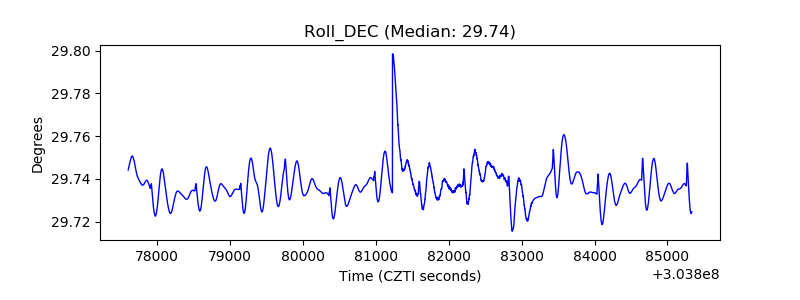 |
| _Roll_RA | 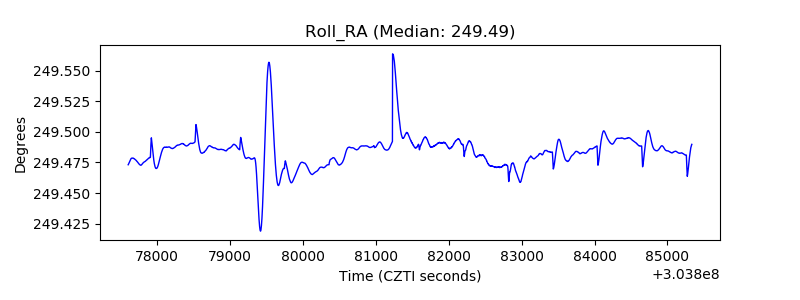 |
| Veto Counter |  |