| Param | Original file | Final file |
|---|---|---|
| Filename | modeM0/AS1A05_088T02_9000003106_21034cztM0_level2.evt | modeM0/AS1A05_088T02_9000003106_21034cztM0_level2_quad_clean.evt |
| Size (bytes) | 485,328,960 | 73,440,000 |
| Size | 462.8 MB | 70.0 MB |
| Events in quadrant A | 3,227,400 | 455,079 |
| Events in quadrant B | 3,638,764 | 455,230 |
| Events in quadrant C | 3,242,674 | 434,136 |
| Events in quadrant D | 4,138,369 | 416,146 |
| Mode M9 | |||
|---|---|---|---|
| Quadrant | BADHDUFLAG | Total packets | Discarded packets |
| A | 0 | 13 | 0 |
| B | 0 | 14 | 0 |
| C | 0 | 14 | 0 |
| D | 0 | 14 | 0 |
| Mode SS | |||
|---|---|---|---|
| Quadrant | BADHDUFLAG | Total packets | Discarded packets |
| A | 0 | 134 | 0 |
| B | 0 | 134 | 0 |
| C | 0 | 134 | 0 |
| D | 0 | 134 | 0 |
| Mode M0 | |||
|---|---|---|---|
| Quadrant | BADHDUFLAG | Total packets | Discarded packets |
| A | 0 | 13692 | 2 |
| B | 0 | 14874 | 2 |
| C | 0 | 13688 | 2 |
| D | 0 | 16671 | 2 |
| Quadrant | Total seconds | Saturated seconds | Saturation percentage |
|---|---|---|---|
| A | 6643 | 98 | 1.475237% |
| B | 6643 | 140 | 2.107482% |
| C | 6643 | 130 | 1.956947% |
| D | 6643 | 215 | 3.236490% |
Noise dominated data is calculated using 1-second bins in cleaned event files. If a bin has >2000 counts, and if more than 50% of those come from <1% of pixels, then it is considered to be noise-dominated and hence unusable.
| Quadrant | # 1 sec bins | Bins with >0 counts | Bins with >2000 counts | High rate bins dominated by noise | Noise dominated (total time) | Noise dominated (detector-on time) | Marked lightcurve |
|---|---|---|---|---|---|---|---|
| A | 7493 | 6644 | 0 | 0 | 0.00% | 0.00% | 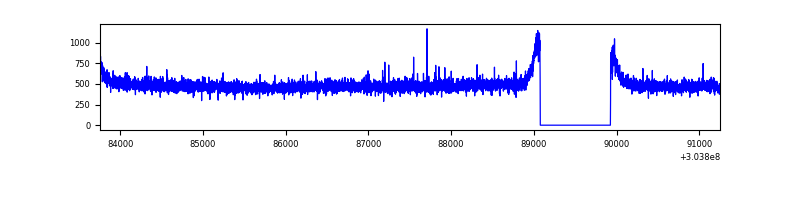 |
| B | 7493 | 6644 | 9 | 9 | 0.12% | 0.14% | 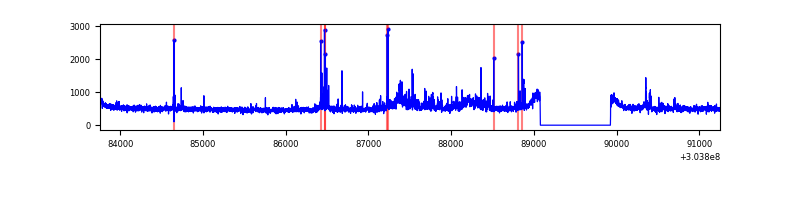 |
| C | 7493 | 6644 | 0 | 0 | 0.00% | 0.00% | 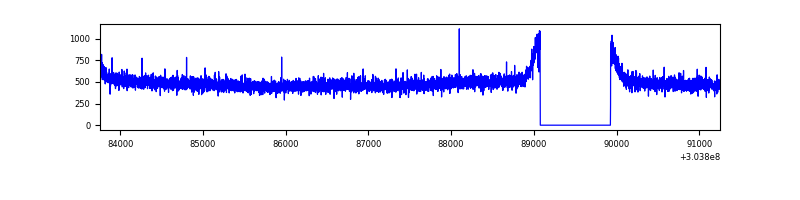 |
| D | 7493 | 6644 | 95 | 95 | 1.27% | 1.43% | 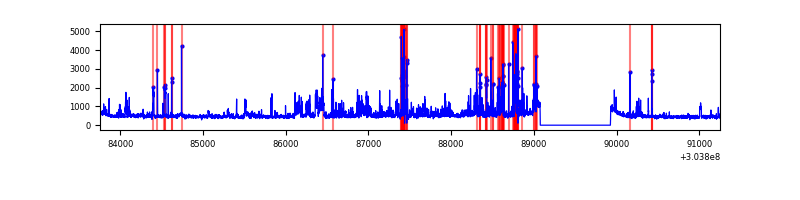 |
Top three noisy pixels from each quadrant. If the there are fewer than three noisy pixels in the level2.evt file, extra rows are filled as -1
| Pixel properties | Quadrant properties | ||||||
|---|---|---|---|---|---|---|---|
| Quadrant | DetID | PixID | Counts | Sigma | Mean | Median | Sigma |
| A | 13 | 254 | 8866 | 47.78 | 837 | 818 | 168.4 |
| A | 0 | 226 | 7187 | 37.81 | 837 | 818 | 168.4 |
| A | 3 | 137 | 6736 | 35.13 | 837 | 818 | 168.4 |
| B | 0 | 189 | 185023 | 1167.63 | 836 | 816 | 157.8 |
| B | 0 | 182 | 76327 | 478.64 | 836 | 816 | 157.8 |
| B | 7 | 220 | 32732 | 202.31 | 836 | 816 | 157.8 |
| C | 14 | 238 | 124830 | 663.91 | 799 | 804 | 186.8 |
| C | 13 | 61 | 5570 | 25.51 | 799 | 804 | 186.8 |
| C | 0 | 207 | 2941 | 11.44 | 799 | 804 | 186.8 |
| D | 1 | 52 | 443220 | 2261.89 | 799 | 776 | 195.6 |
| D | 1 | 20 | 261282 | 1331.77 | 799 | 776 | 195.6 |
| D | 12 | 233 | 169564 | 862.89 | 799 | 776 | 195.6 |
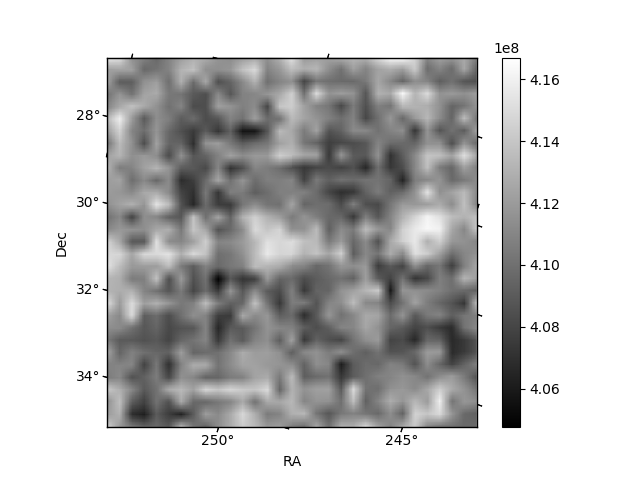
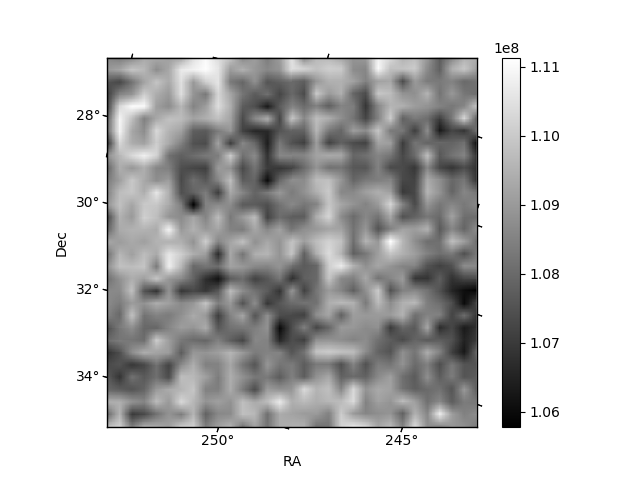
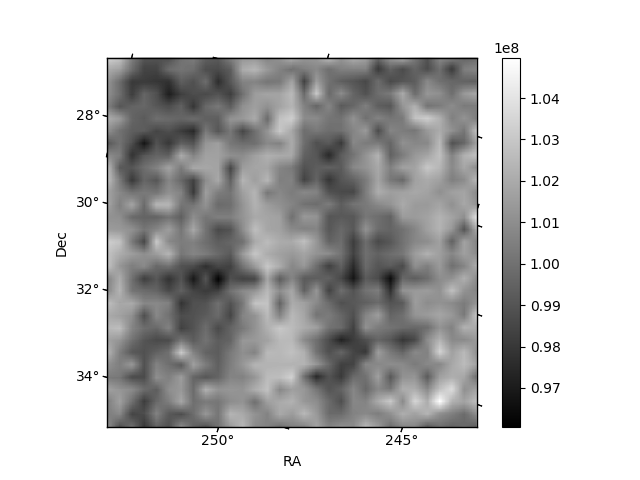
Histogram calculated using DETX and DETY for each event in the final _common_clean file
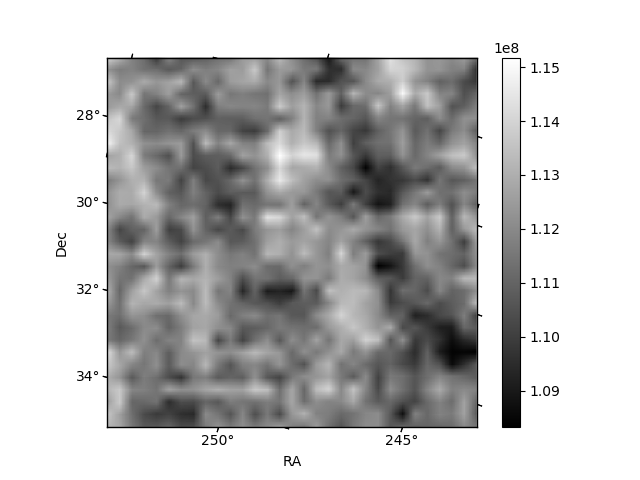
| Quadrant A | 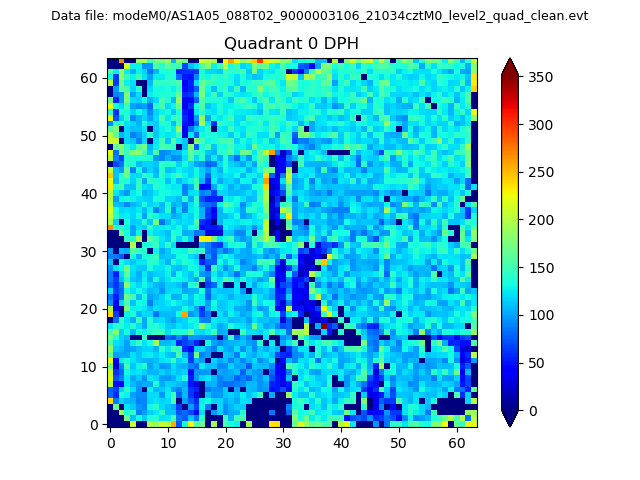 |
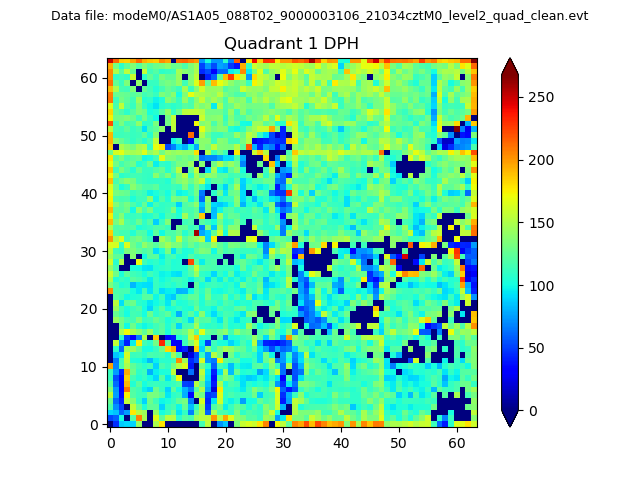 |
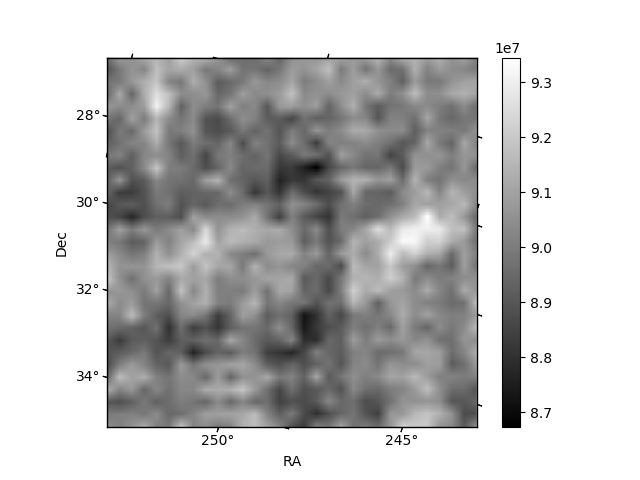
Quadrant B |
|---|---|---|---|
| Quadrant D | 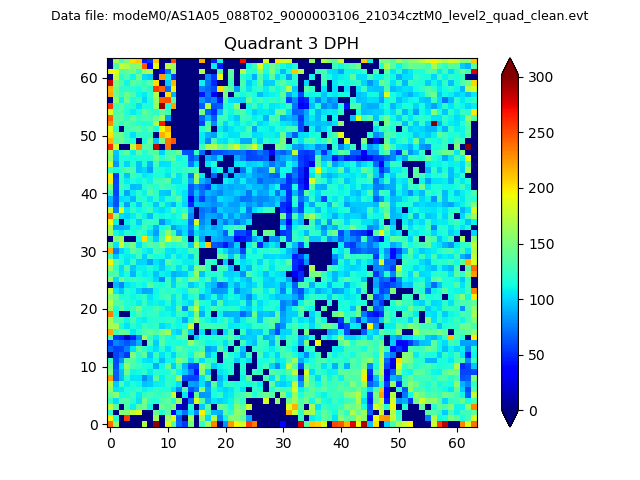 |
 |
Quadrant C |
| Plot type | Count rate plots | Images |
|---|---|---|
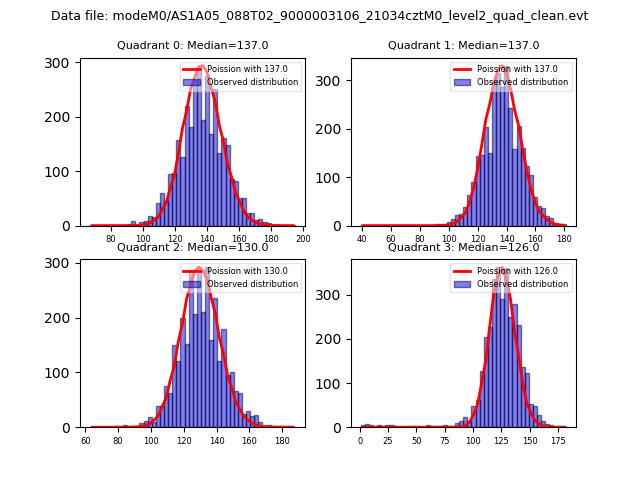
| Comparison with Poisson distribution Blue bars denote a histogram of data divided into 1 sec bins. Red curve is a Poisson curve with rate = median count rate of data. |
 |
 |
| Quadrant-wise count rates Data is divided into 100 sec bins |
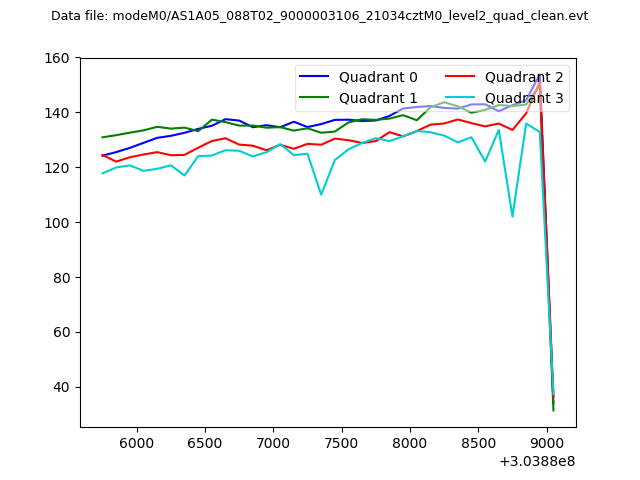 |
|
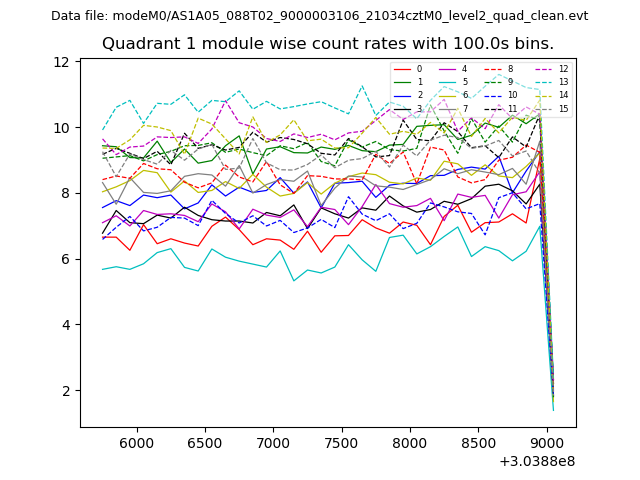
| Module-wise count rates for Quadrant A Data is divided into 100 sec bins |
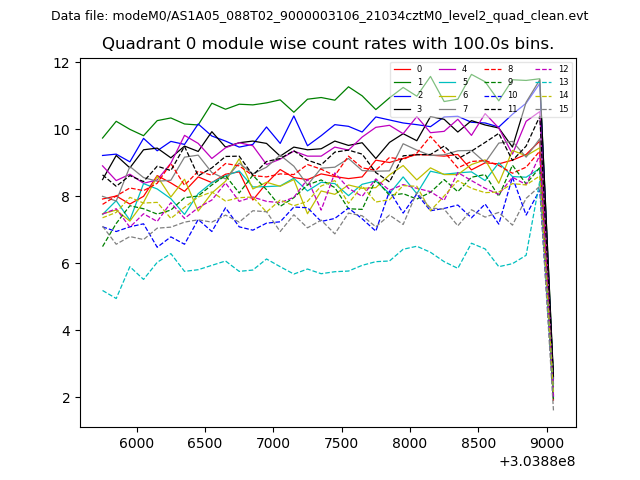 |
 |
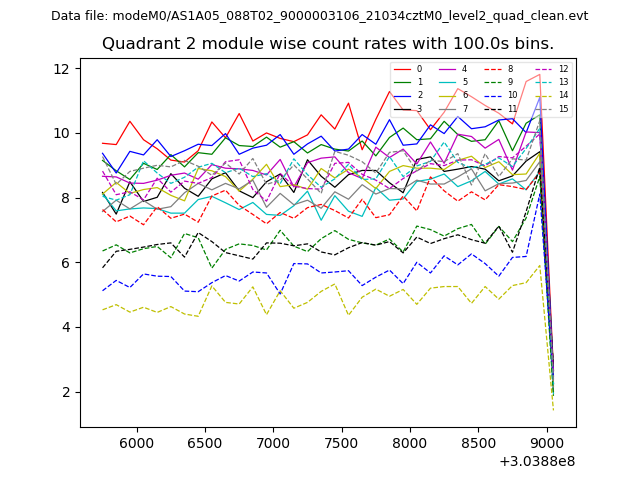
| Module-wise count rates for Quadrant B Data is divided into 100 sec bins |
 |
 |
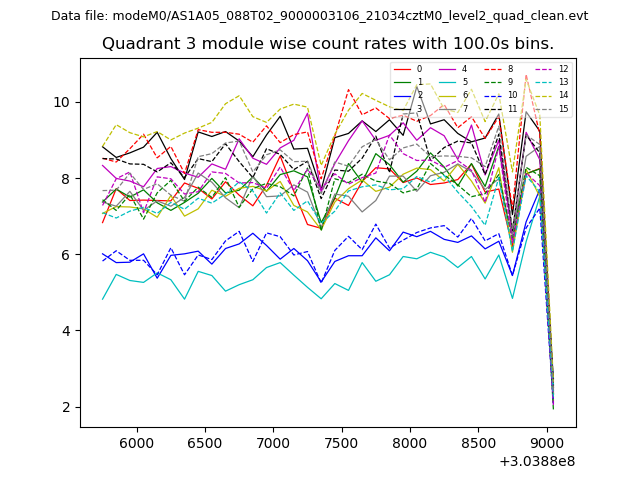
| Module-wise count rates for Quadrant C Data is divided into 100 sec bins |
 |
 |
| Module-wise count rates for Quadrant D Data is divided into 100 sec bins |
 |
 |
| Parameter | Plot |
|---|---|
| CZT HV Monitor | 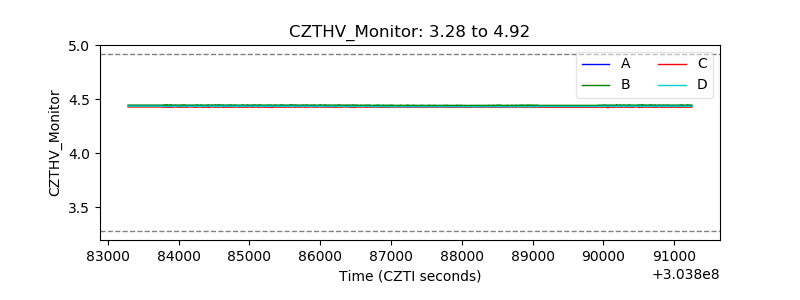 |
| D_VDD | 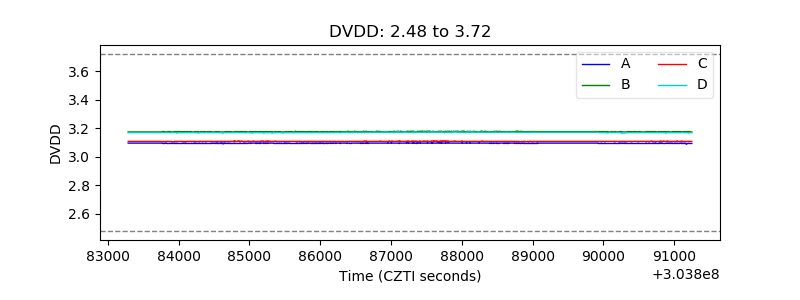 |
| Temperature 1 | 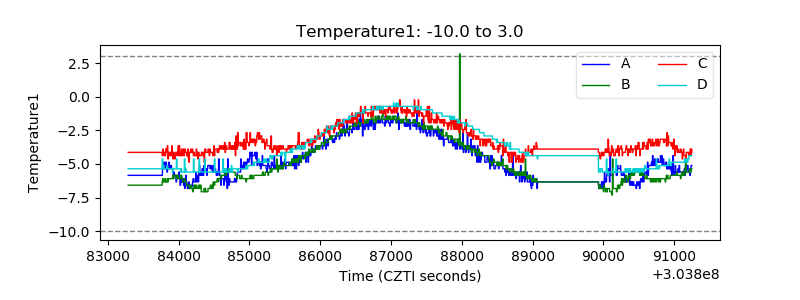 |
| Veto HV Monitor | 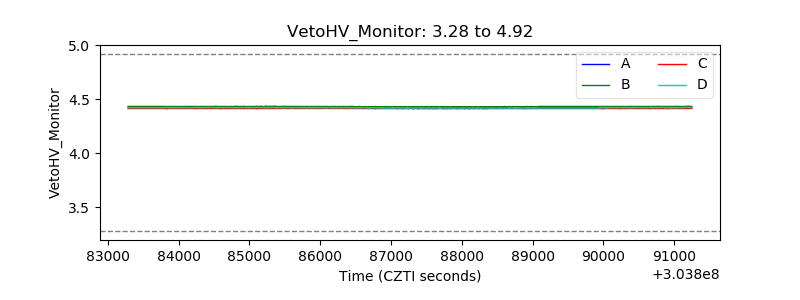 |
| Veto LLD | 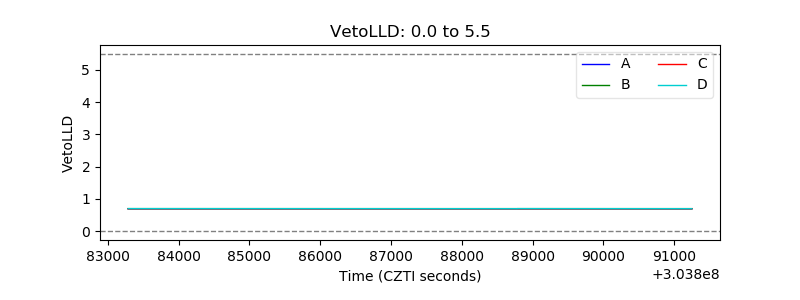 |
| Alpha Counter | 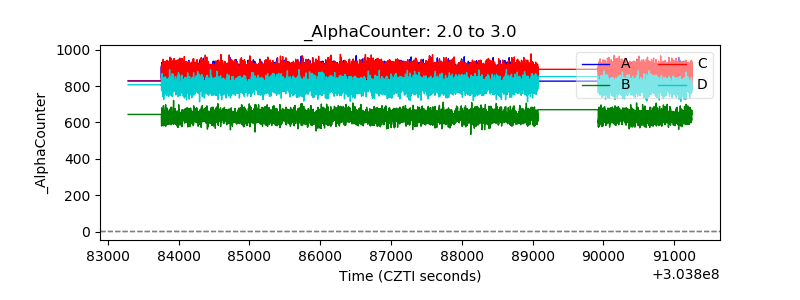 |
| _CPM_Rate | 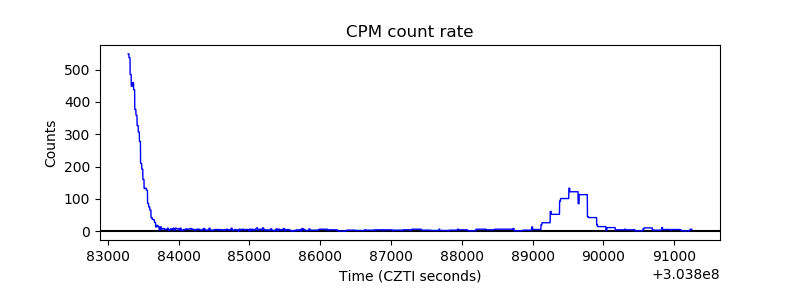 |
| CZT Counter |  |
| +2.5 Volts monitor |  |
| +5 Volts monitor | 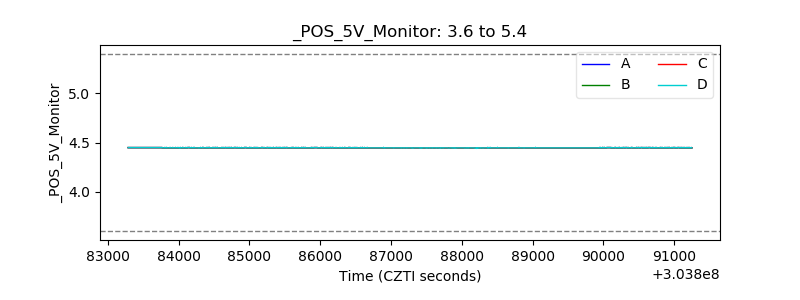 |
| _ROLL_ROT | 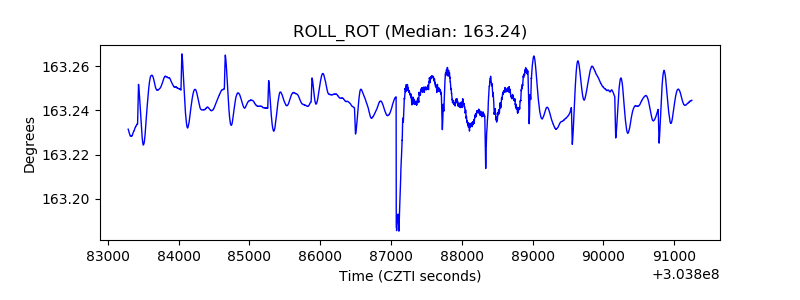 |
| _Roll_DEC | 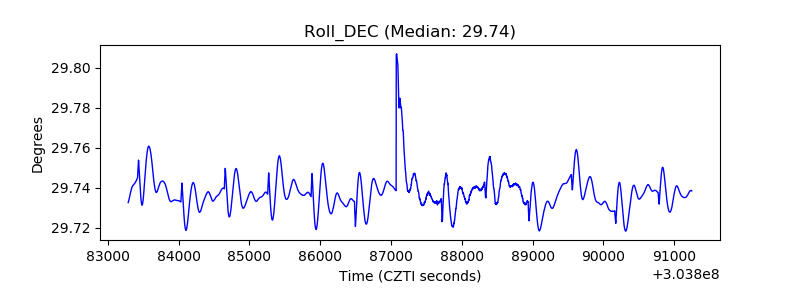 |
| _Roll_RA |  |
| Veto Counter | 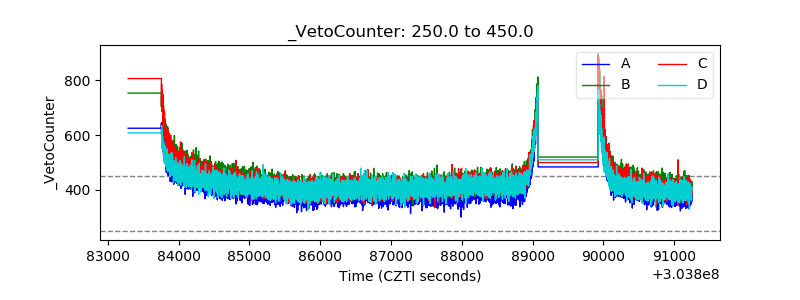 |