| Param | Original file | Final file |
|---|---|---|
| Filename | modeM0/AS1A05_088T02_9000003106_21035cztM0_level2.evt | modeM0/AS1A05_088T02_9000003106_21035cztM0_level2_quad_clean.evt |
| Size (bytes) | 540,152,640 | 88,470,720 |
| Size | 515.1 MB | 84.4 MB |
| Events in quadrant A | 3,657,844 | 553,075 |
| Events in quadrant B | 3,942,895 | 554,436 |
| Events in quadrant C | 3,711,539 | 528,562 |
| Events in quadrant D | 4,532,534 | 516,672 |
| Mode M9 | |||
|---|---|---|---|
| Quadrant | BADHDUFLAG | Total packets | Discarded packets |
| A | 0 | 13 | 0 |
| B | 0 | 13 | 0 |
| C | 0 | 13 | 0 |
| D | 0 | 13 | 0 |
| Mode SS | |||
|---|---|---|---|
| Quadrant | BADHDUFLAG | Total packets | Discarded packets |
| A | 0 | 156 | 0 |
| B | 0 | 156 | 0 |
| C | 0 | 156 | 0 |
| D | 0 | 156 | 0 |
| Mode M0 | |||
|---|---|---|---|
| Quadrant | BADHDUFLAG | Total packets | Discarded packets |
| A | 0 | 15729 | 2 |
| B | 0 | 16306 | 2 |
| C | 0 | 15855 | 2 |
| D | 0 | 18491 | 2 |
| Quadrant | Total seconds | Saturated seconds | Saturation percentage |
|---|---|---|---|
| A | 7562 | 249 | 3.292780% |
| B | 7562 | 304 | 4.020101% |
| C | 7563 | 269 | 3.556790% |
| D | 7563 | 279 | 3.689012% |
Noise dominated data is calculated using 1-second bins in cleaned event files. If a bin has >2000 counts, and if more than 50% of those come from <1% of pixels, then it is considered to be noise-dominated and hence unusable.
| Quadrant | # 1 sec bins | Bins with >0 counts | Bins with >2000 counts | High rate bins dominated by noise | Noise dominated (total time) | Noise dominated (detector-on time) | Marked lightcurve |
|---|---|---|---|---|---|---|---|
| A | 8852 | 7564 | 0 | 0 | 0.00% | 0.00% | 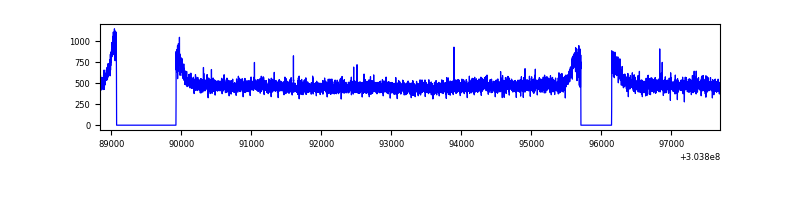 |
| B | 8852 | 7564 | 9 | 9 | 0.10% | 0.12% | 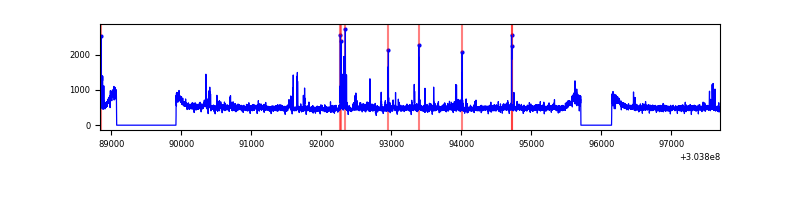 |
| C | 8853 | 7565 | 0 | 0 | 0.00% | 0.00% | 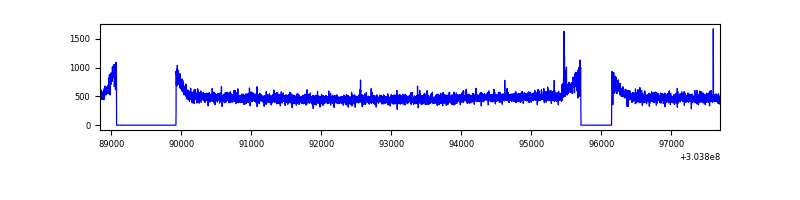 |
| D | 8853 | 7565 | 56 | 56 | 0.63% | 0.74% | 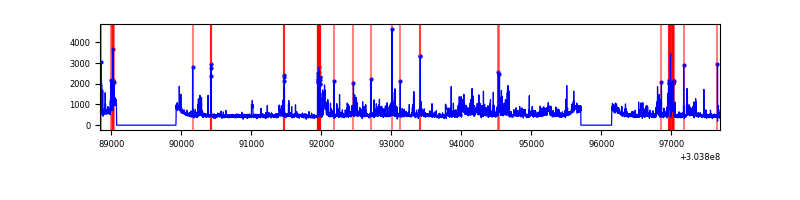 |
Top three noisy pixels from each quadrant. If the there are fewer than three noisy pixels in the level2.evt file, extra rows are filled as -1
| Pixel properties | Quadrant properties | ||||||
|---|---|---|---|---|---|---|---|
| Quadrant | DetID | PixID | Counts | Sigma | Mean | Median | Sigma |
| A | 13 | 254 | 9713 | 45.61 | 949 | 927 | 192.6 |
| A | 0 | 226 | 8133 | 37.41 | 949 | 927 | 192.6 |
| A | 3 | 137 | 7990 | 36.66 | 949 | 927 | 192.6 |
| B | 0 | 189 | 95785 | 518.58 | 946 | 920 | 182.9 |
| B | 3 | 64 | 33462 | 177.89 | 946 | 920 | 182.9 |
| B | 0 | 228 | 31826 | 168.95 | 946 | 920 | 182.9 |
| C | 14 | 238 | 140896 | 656.04 | 909 | 914 | 213.4 |
| C | 9 | 54 | 24581 | 110.92 | 909 | 914 | 213.4 |
| C | 13 | 61 | 6314 | 25.31 | 909 | 914 | 213.4 |
| D | 1 | 52 | 696044 | 3102.2 | 918 | 889 | 224.1 |
| D | 1 | 20 | 188598 | 837.67 | 918 | 889 | 224.1 |
| D | 12 | 233 | 50099 | 219.6 | 918 | 889 | 224.1 |
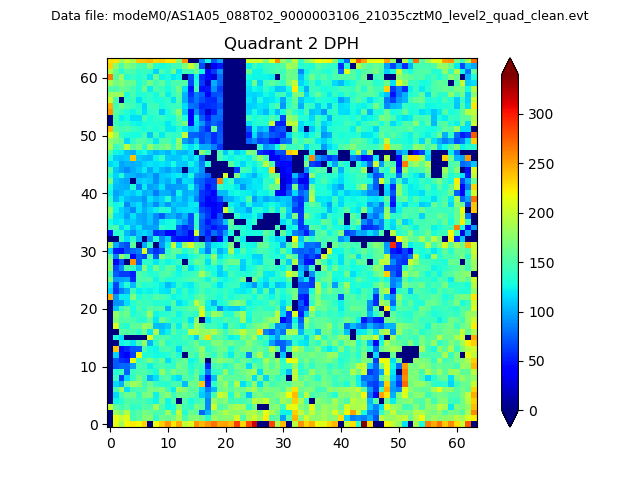
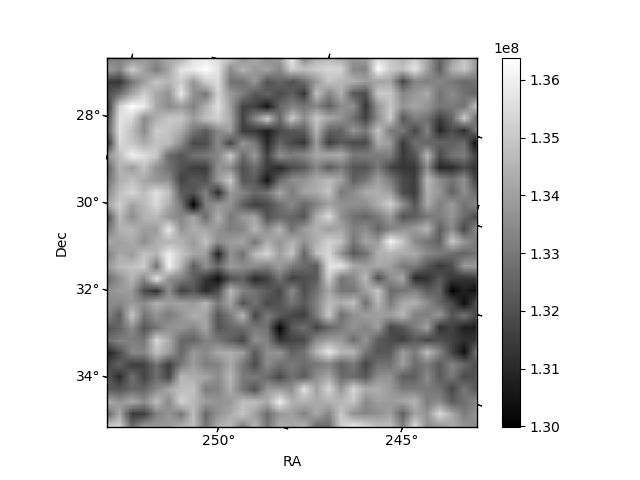
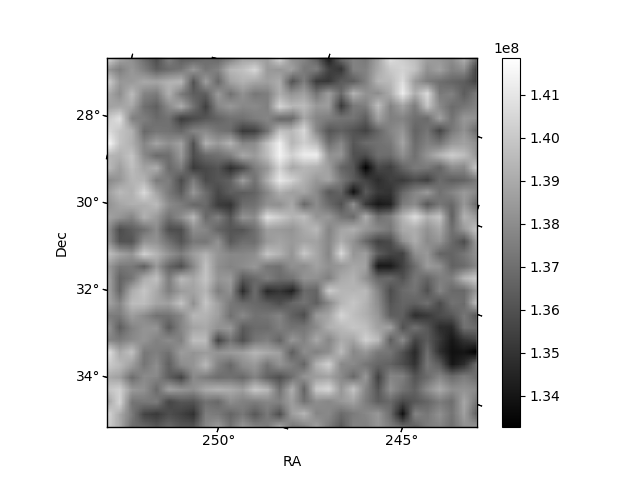
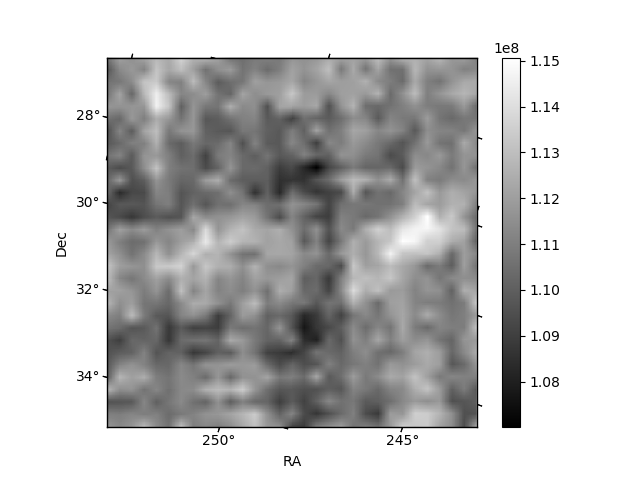
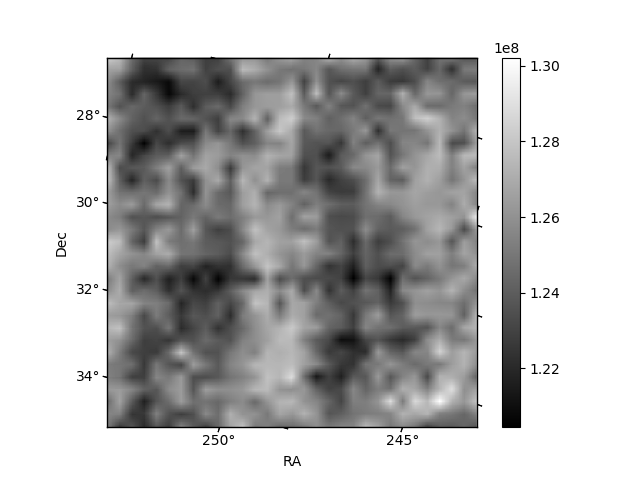
Histogram calculated using DETX and DETY for each event in the final _common_clean file
| Quadrant A |  |
 |
Quadrant B |
|---|---|---|---|
| Quadrant D | 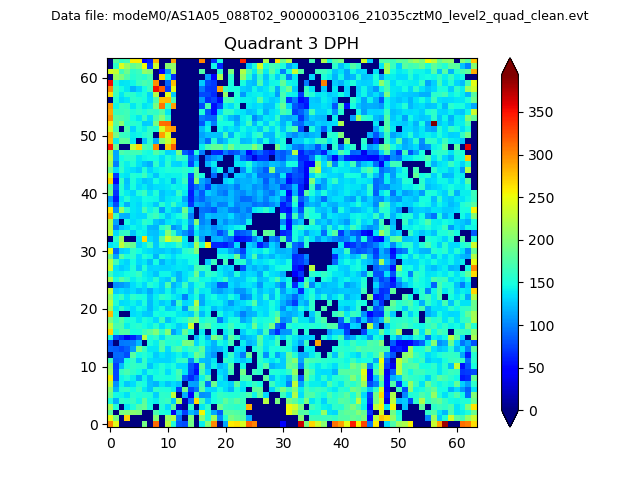 |
 |
Quadrant C |
| Plot type | Count rate plots | Images |
|---|---|---|
| Comparison with Poisson distribution Blue bars denote a histogram of data divided into 1 sec bins. Red curve is a Poisson curve with rate = median count rate of data. |
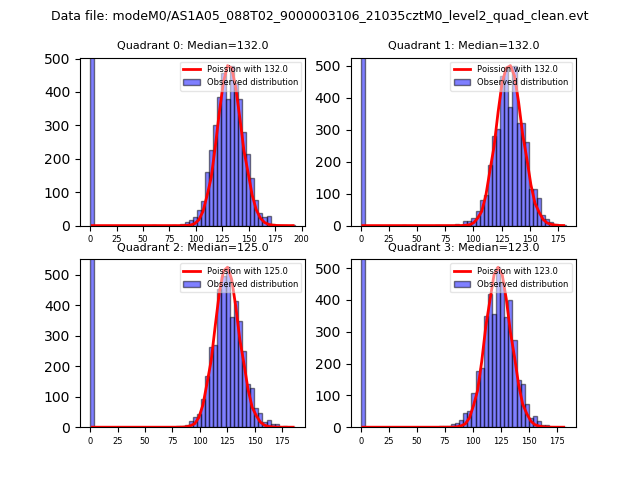 |
 |
| Quadrant-wise count rates Data is divided into 100 sec bins |
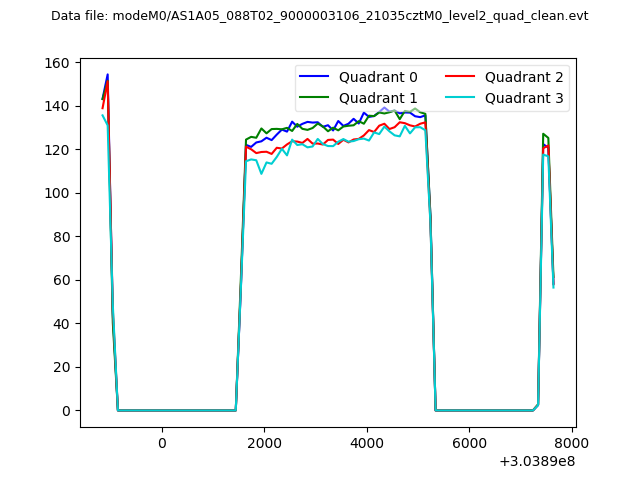 |
|
| Module-wise count rates for Quadrant A Data is divided into 100 sec bins |
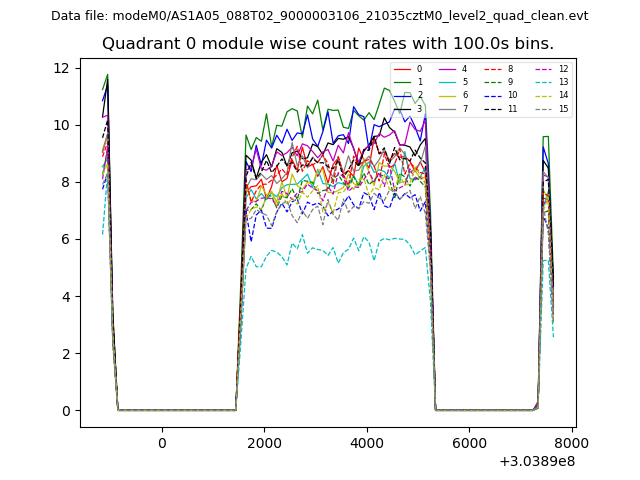 |
 |
| Module-wise count rates for Quadrant B Data is divided into 100 sec bins |
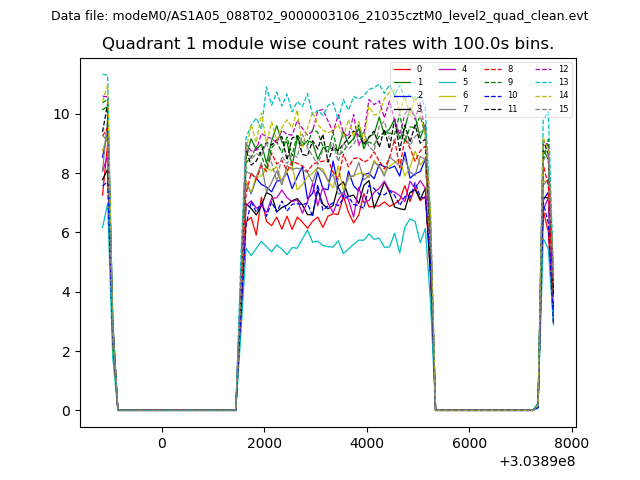 |
 |
| Module-wise count rates for Quadrant C Data is divided into 100 sec bins |
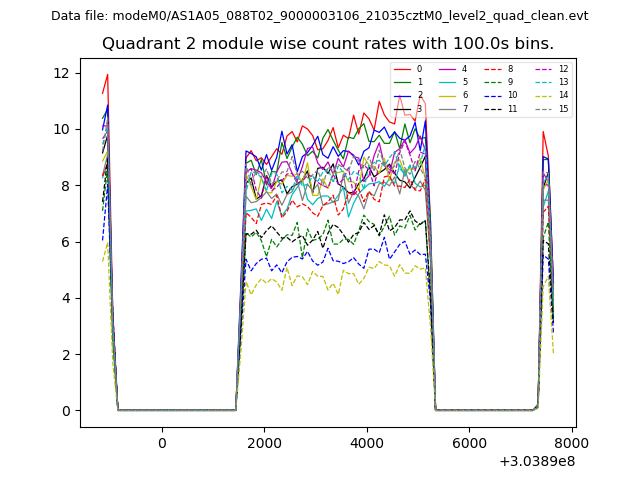 |
 |
| Module-wise count rates for Quadrant D Data is divided into 100 sec bins |
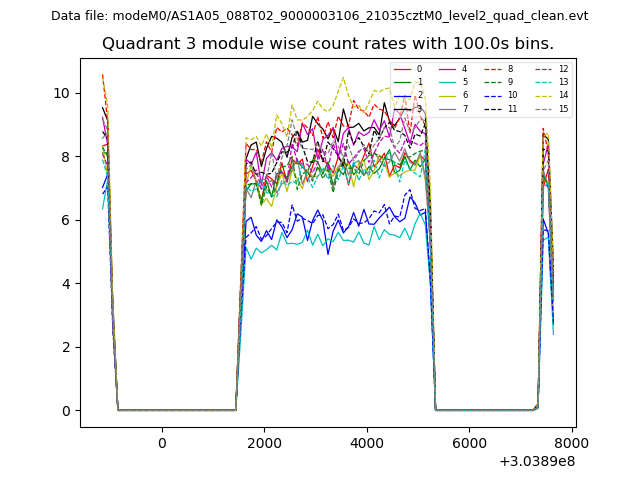 |
 |
| Parameter | Plot |
|---|---|
| CZT HV Monitor | 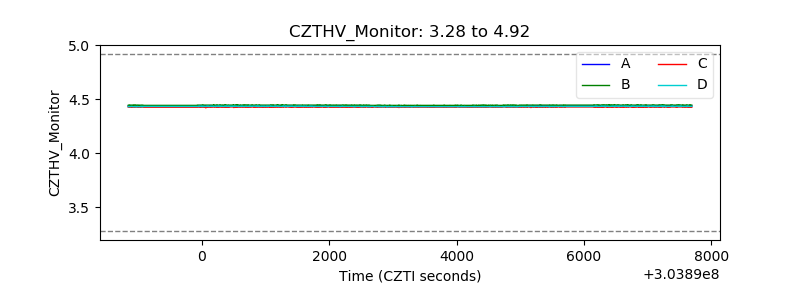 |
| D_VDD | 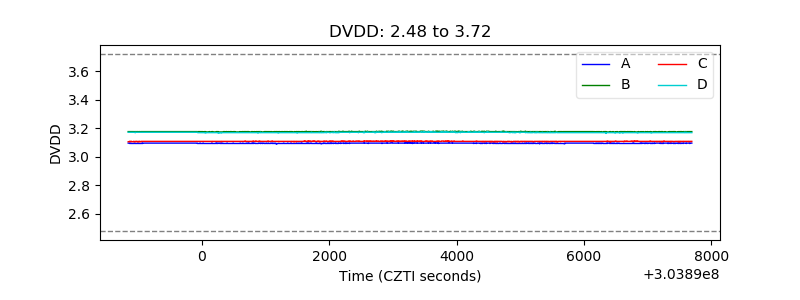 |
| Temperature 1 |  |
| Veto HV Monitor | 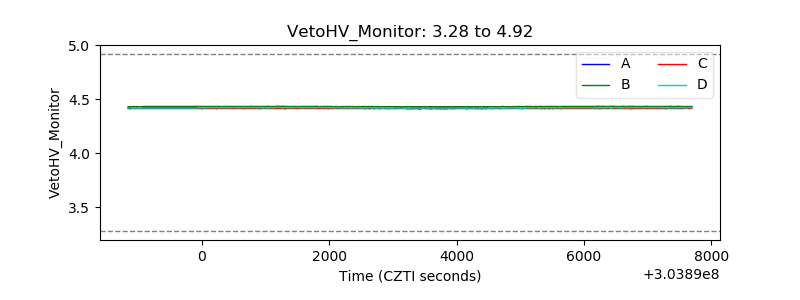 |
| Veto LLD |  |
| Alpha Counter | 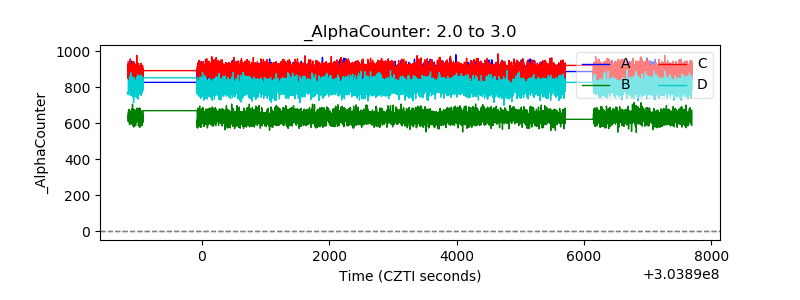 |
| _CPM_Rate | 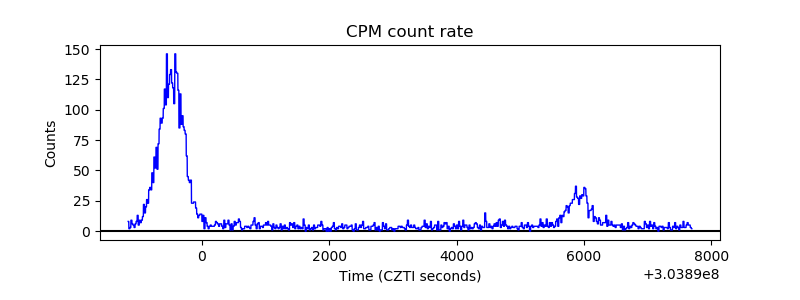 |
| CZT Counter | 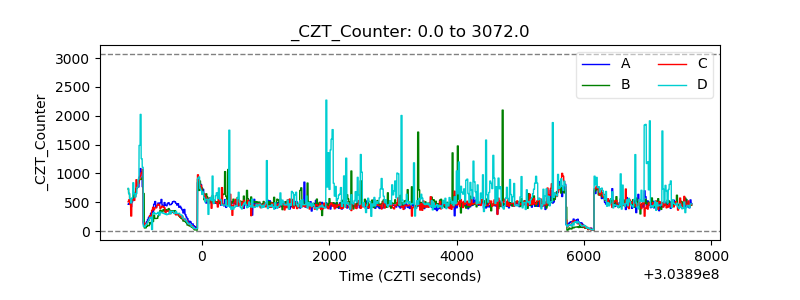 |
| +2.5 Volts monitor |  |
| +5 Volts monitor | 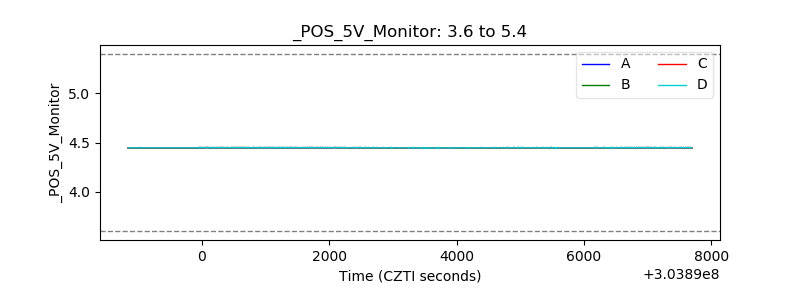 |
| _ROLL_ROT |  |
| _Roll_DEC | 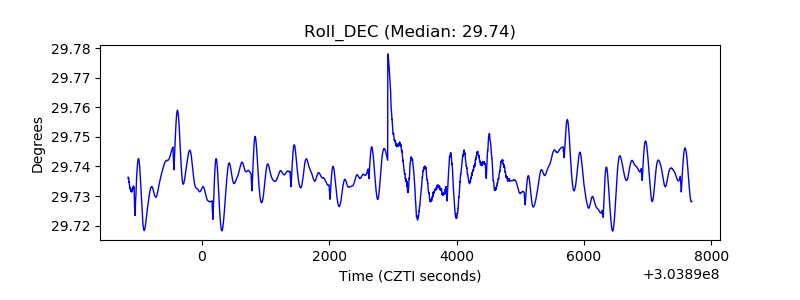 |
| _Roll_RA | 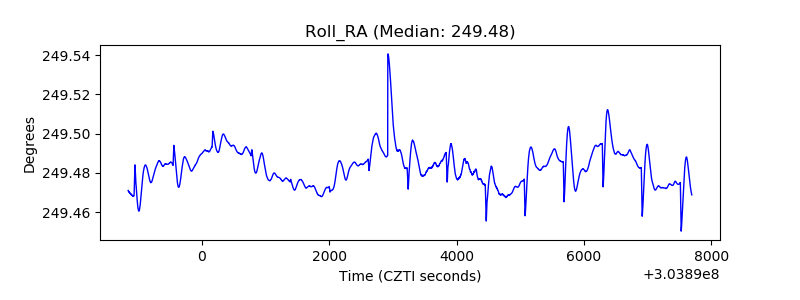 |
| Veto Counter |  |