| Param | Original file | Final file |
|---|---|---|
| Filename | modeM0/AS1A05_088T02_9000003106_21036cztM0_level2.evt | modeM0/AS1A05_088T02_9000003106_21036cztM0_level2_quad_clean.evt |
| Size (bytes) | 523,532,160 | 90,385,920 |
| Size | 499.3 MB | 86.2 MB |
| Events in quadrant A | 3,572,236 | 568,223 |
| Events in quadrant B | 3,964,712 | 568,367 |
| Events in quadrant C | 3,608,269 | 544,209 |
| Events in quadrant D | 4,193,949 | 528,019 |
| Mode M9 | |||
|---|---|---|---|
| Quadrant | BADHDUFLAG | Total packets | Discarded packets |
| A | 0 | 2 | 0 |
| B | 0 | 2 | 0 |
| C | 0 | 2 | 0 |
| D | 0 | 2 | 0 |
| Mode SS | |||
|---|---|---|---|
| Quadrant | BADHDUFLAG | Total packets | Discarded packets |
| A | 0 | 154 | 0 |
| B | 0 | 154 | 0 |
| C | 0 | 154 | 0 |
| D | 0 | 154 | 0 |
| Mode M0 | |||
|---|---|---|---|
| Quadrant | BADHDUFLAG | Total packets | Discarded packets |
| A | 0 | 15621 | 1 |
| B | 0 | 16530 | 1 |
| C | 0 | 15641 | 1 |
| D | 0 | 17559 | 1 |
| Quadrant | Total seconds | Saturated seconds | Saturation percentage |
|---|---|---|---|
| A | 7600 | 251 | 3.302632% |
| B | 7600 | 304 | 4.000000% |
| C | 7601 | 274 | 3.604789% |
| D | 7601 | 346 | 4.552033% |
Noise dominated data is calculated using 1-second bins in cleaned event files. If a bin has >2000 counts, and if more than 50% of those come from <1% of pixels, then it is considered to be noise-dominated and hence unusable.
| Quadrant | # 1 sec bins | Bins with >0 counts | Bins with >2000 counts | High rate bins dominated by noise | Noise dominated (total time) | Noise dominated (detector-on time) | Marked lightcurve |
|---|---|---|---|---|---|---|---|
| A | 7735 | 7603 | 0 | 0 | 0.00% | 0.00% | 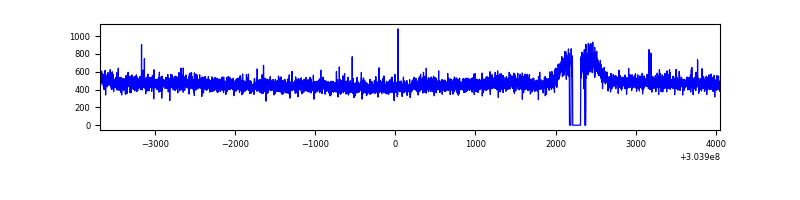 |
| B | 7735 | 7603 | 22 | 22 | 0.28% | 0.29% | 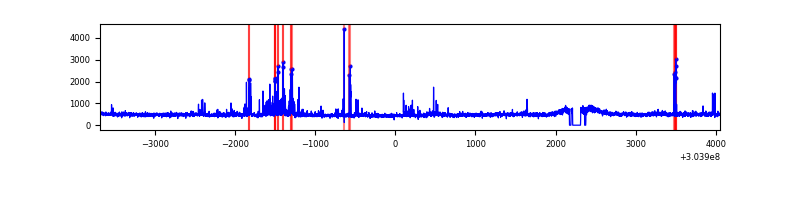 |
| C | 7736 | 7604 | 0 | 0 | 0.00% | 0.00% | 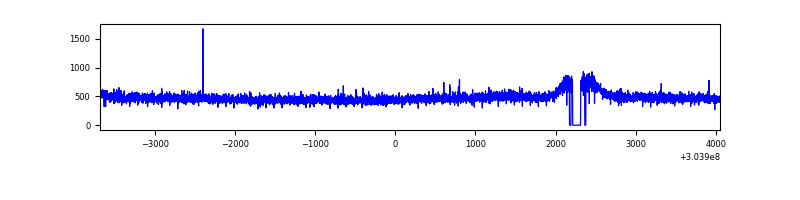 |
| D | 7736 | 7604 | 112 | 112 | 1.45% | 1.47% | 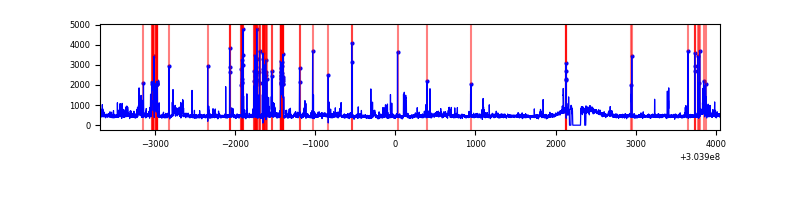 |
Top three noisy pixels from each quadrant. If the there are fewer than three noisy pixels in the level2.evt file, extra rows are filled as -1
| Pixel properties | Quadrant properties | ||||||
|---|---|---|---|---|---|---|---|
| Quadrant | DetID | PixID | Counts | Sigma | Mean | Median | Sigma |
| A | 13 | 254 | 8464 | 40.1 | 927 | 905 | 188.5 |
| A | 0 | 226 | 8016 | 37.72 | 927 | 905 | 188.5 |
| A | 3 | 137 | 7792 | 36.54 | 927 | 905 | 188.5 |
| B | 7 | 220 | 175525 | 992.61 | 923 | 899 | 175.9 |
| B | 0 | 189 | 51483 | 287.53 | 923 | 899 | 175.9 |
| B | 3 | 64 | 35529 | 196.84 | 923 | 899 | 175.9 |
| C | 14 | 238 | 139032 | 662.39 | 889 | 890 | 208.6 |
| C | 13 | 61 | 6117 | 25.06 | 889 | 890 | 208.6 |
| C | 2 | 0 | 4260 | 16.16 | 889 | 890 | 208.6 |
| D | 1 | 52 | 385373 | 1760.79 | 894 | 867 | 218.4 |
| D | 1 | 20 | 214448 | 978.06 | 894 | 867 | 218.4 |
| D | 1 | 239 | 91474 | 414.92 | 894 | 867 | 218.4 |
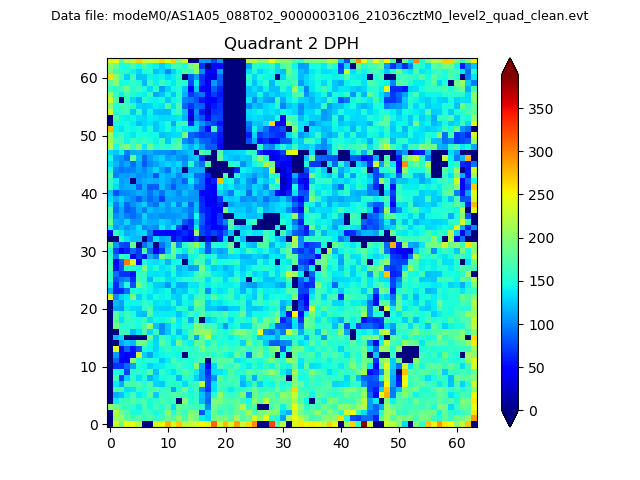
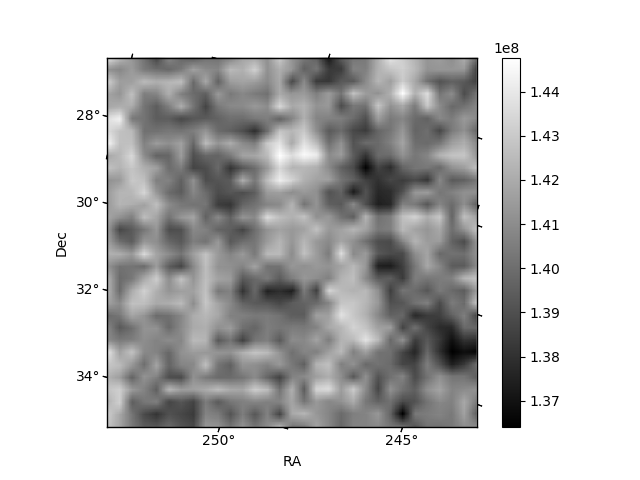
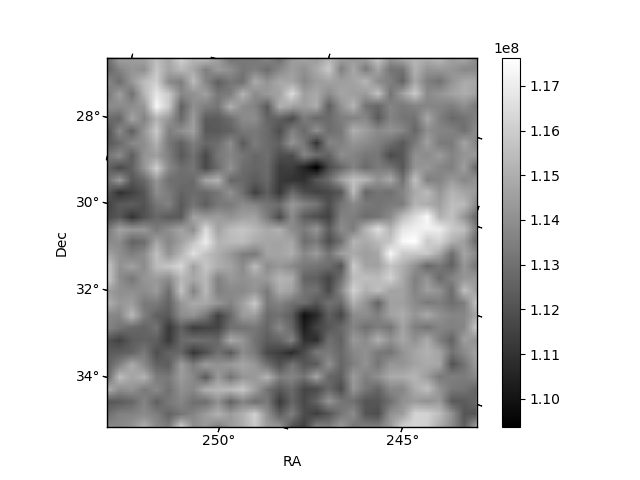
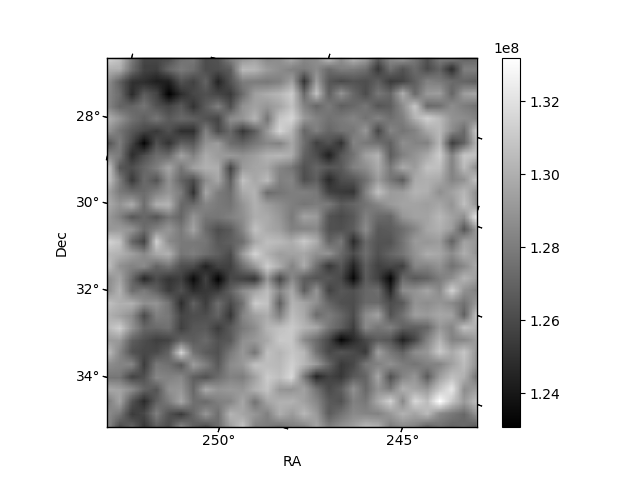
Histogram calculated using DETX and DETY for each event in the final _common_clean file
| Quadrant A |  |
 |
Quadrant B |
|---|---|---|---|
| Quadrant D | 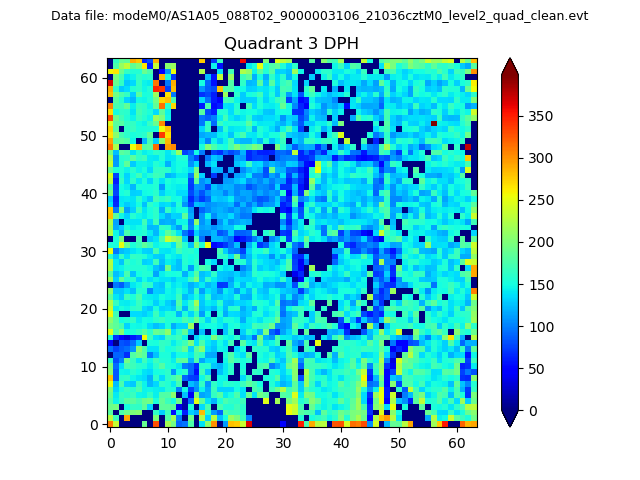 |
 |
Quadrant C |
| Plot type | Count rate plots | Images |
|---|---|---|
| Comparison with Poisson distribution Blue bars denote a histogram of data divided into 1 sec bins. Red curve is a Poisson curve with rate = median count rate of data. |
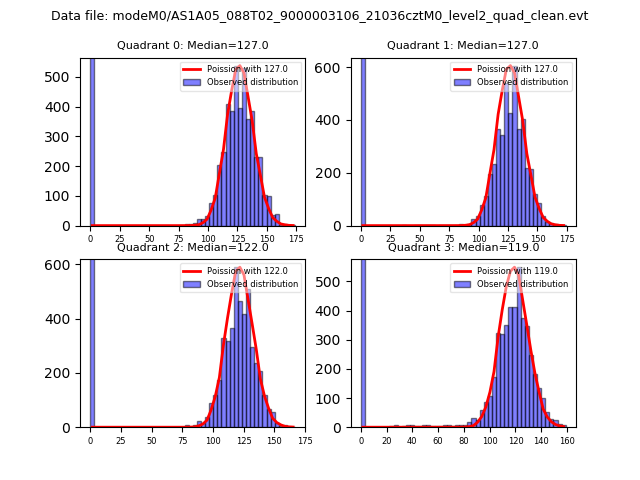 |
 |
| Quadrant-wise count rates Data is divided into 100 sec bins |
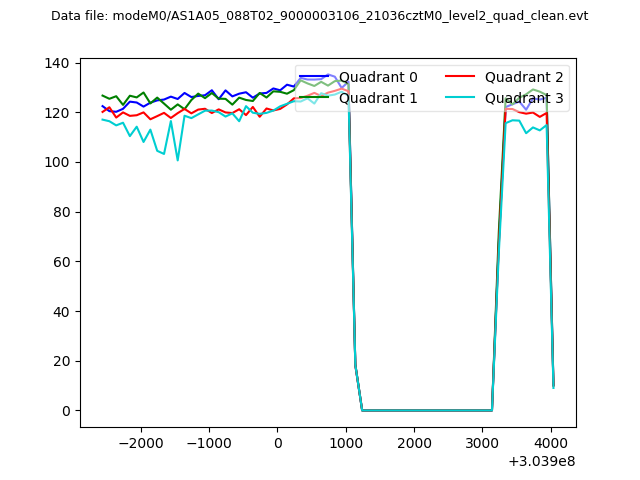 |
|
| Module-wise count rates for Quadrant A Data is divided into 100 sec bins |
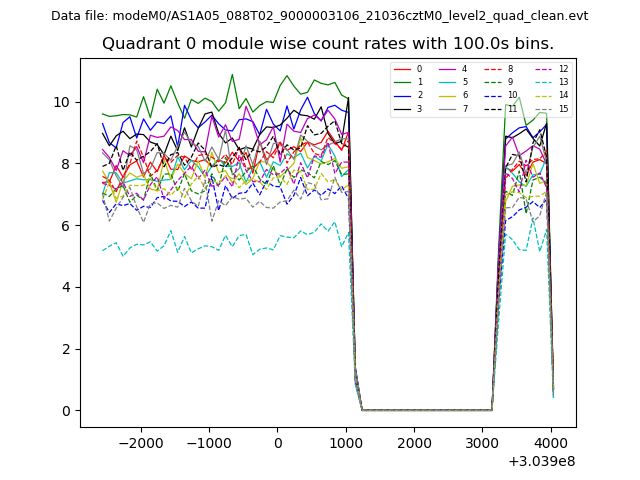 |
 |
| Module-wise count rates for Quadrant B Data is divided into 100 sec bins |
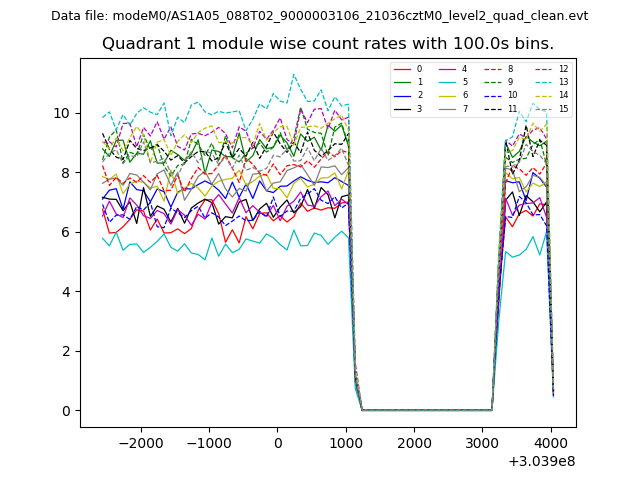 |
 |
| Module-wise count rates for Quadrant C Data is divided into 100 sec bins |
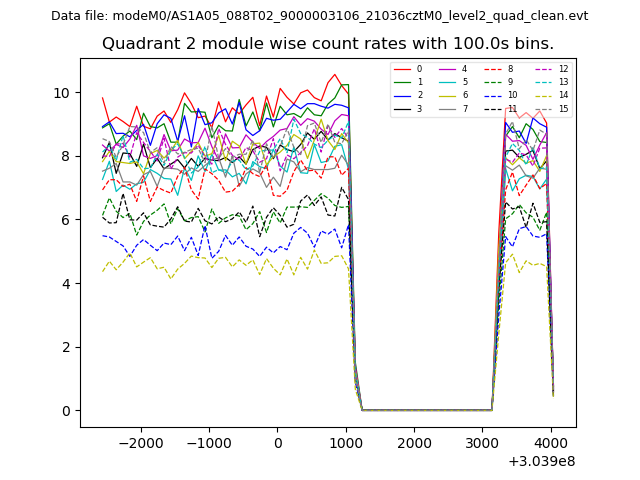 |
 |
| Module-wise count rates for Quadrant D Data is divided into 100 sec bins |
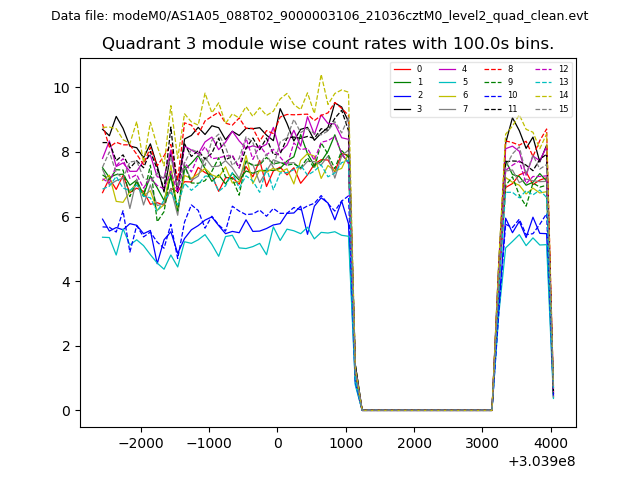 |
 |
| Parameter | Plot |
|---|---|
| CZT HV Monitor | 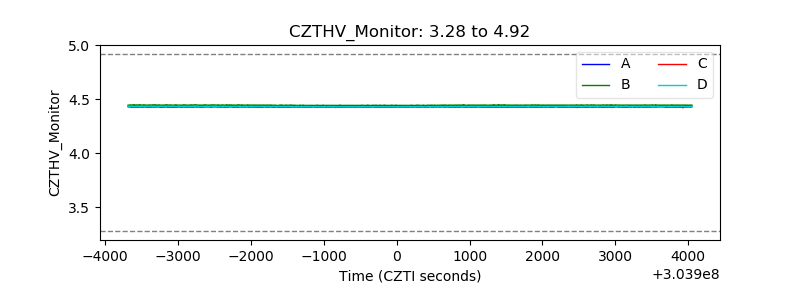 |
| D_VDD | 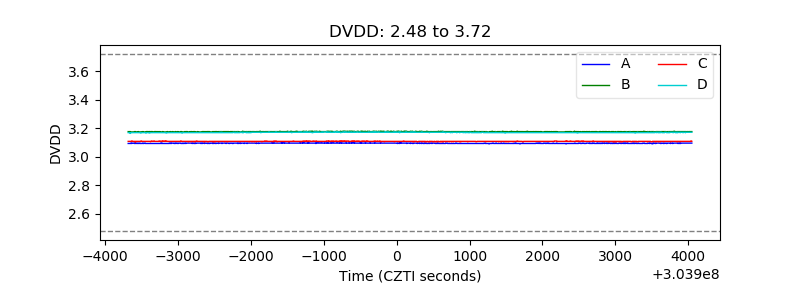 |
| Temperature 1 | 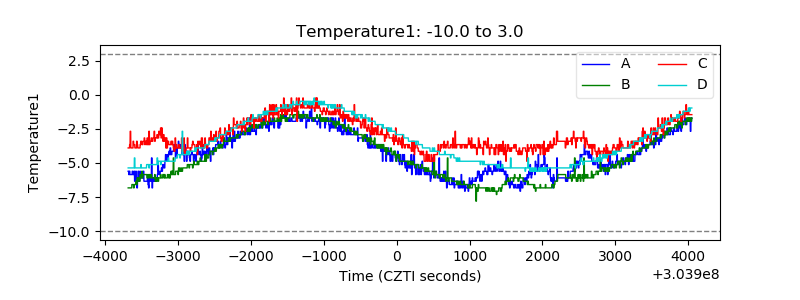 |
| Veto HV Monitor | 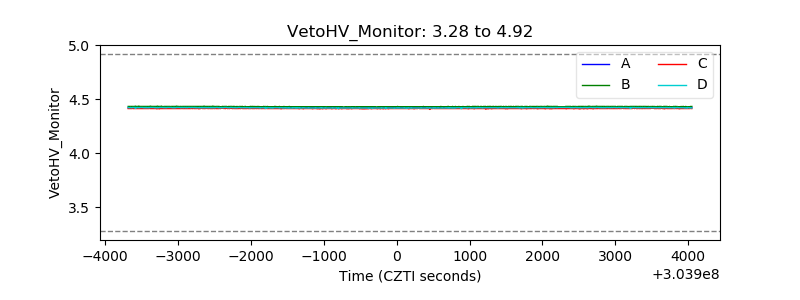 |
| Veto LLD |  |
| Alpha Counter | 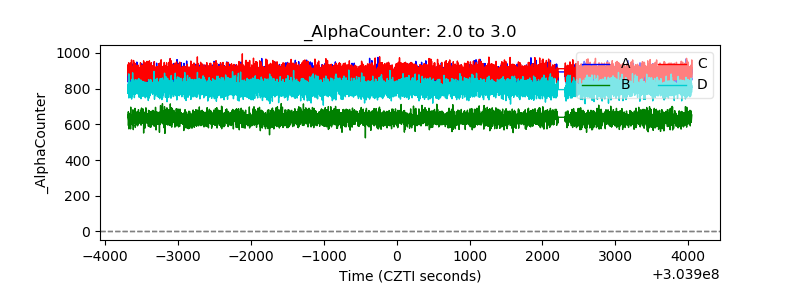 |
| _CPM_Rate | 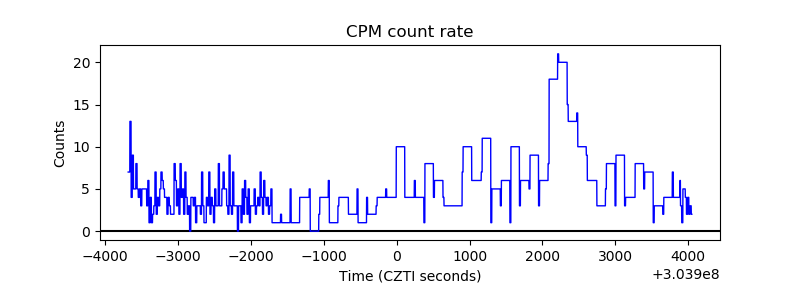 |
| CZT Counter | 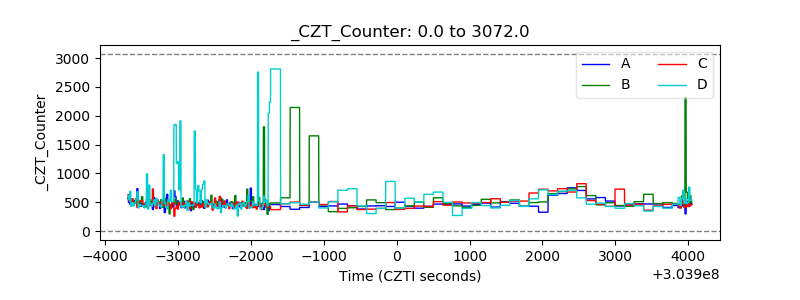 |
| +2.5 Volts monitor |  |
| +5 Volts monitor | 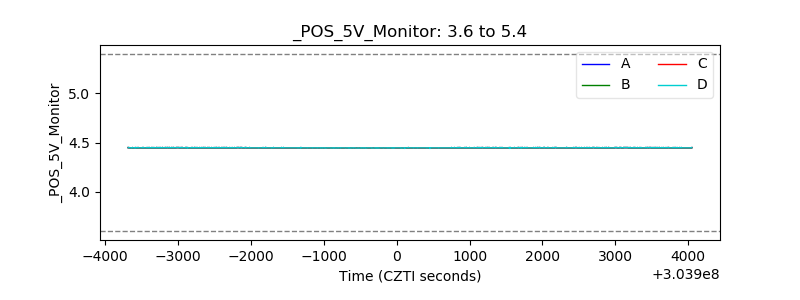 |
| _ROLL_ROT |  |
| _Roll_DEC | 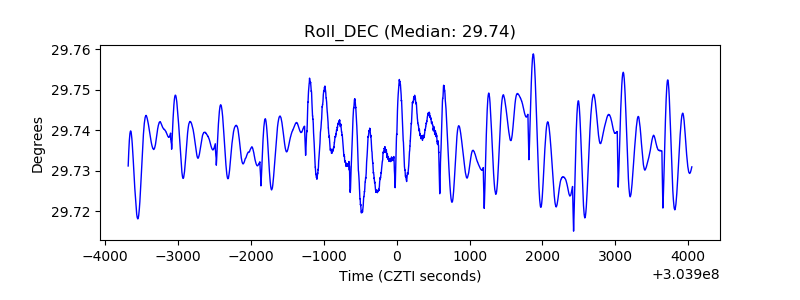 |
| _Roll_RA | 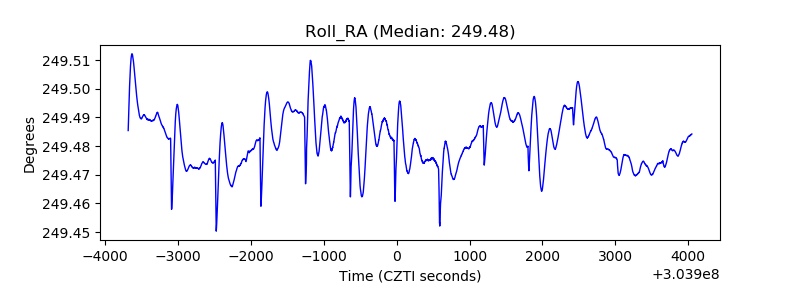 |
| Veto Counter | 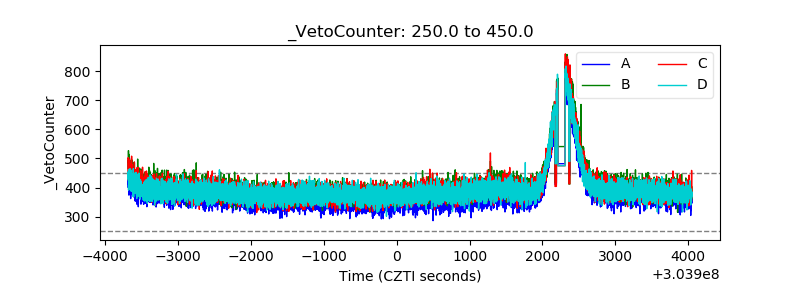 |