| Param | Original file | Final file |
|---|---|---|
| Filename | modeM0/AS1A05_088T02_9000003106_21037cztM0_level2.evt | modeM0/AS1A05_088T02_9000003106_21037cztM0_level2_quad_clean.evt |
| Size (bytes) | 573,474,240 | 100,088,640 |
| Size | 546.9 MB | 95.5 MB |
| Events in quadrant A | 3,818,765 | 640,159 |
| Events in quadrant B | 4,256,194 | 637,700 |
| Events in quadrant C | 3,851,184 | 608,830 |
| Events in quadrant D | 4,900,826 | 590,919 |
| Mode M9 | |||
|---|---|---|---|
| Quadrant | BADHDUFLAG | Total packets | Discarded packets |
| A | 0 | 5 | 0 |
| B | 0 | 5 | 0 |
| C | 0 | 5 | 0 |
| D | 0 | 5 | 0 |
| Mode SS | |||
|---|---|---|---|
| Quadrant | BADHDUFLAG | Total packets | Discarded packets |
| A | 0 | 164 | 0 |
| B | 0 | 164 | 0 |
| C | 0 | 164 | 0 |
| D | 0 | 164 | 0 |
| Mode M0 | |||
|---|---|---|---|
| Quadrant | BADHDUFLAG | Total packets | Discarded packets |
| A | 0 | 16602 | 2 |
| B | 0 | 17742 | 2 |
| C | 0 | 16602 | 2 |
| D | 0 | 19756 | 2 |
| Quadrant | Total seconds | Saturated seconds | Saturation percentage |
|---|---|---|---|
| A | 7966 | 353 | 4.431333% |
| B | 7967 | 407 | 5.108573% |
| C | 7967 | 378 | 4.744571% |
| D | 7967 | 412 | 5.171332% |
Noise dominated data is calculated using 1-second bins in cleaned event files. If a bin has >2000 counts, and if more than 50% of those come from <1% of pixels, then it is considered to be noise-dominated and hence unusable.
| Quadrant | # 1 sec bins | Bins with >0 counts | Bins with >2000 counts | High rate bins dominated by noise | Noise dominated (total time) | Noise dominated (detector-on time) | Marked lightcurve |
|---|---|---|---|---|---|---|---|
| A | 8436 | 7971 | 0 | 0 | 0.00% | 0.00% | 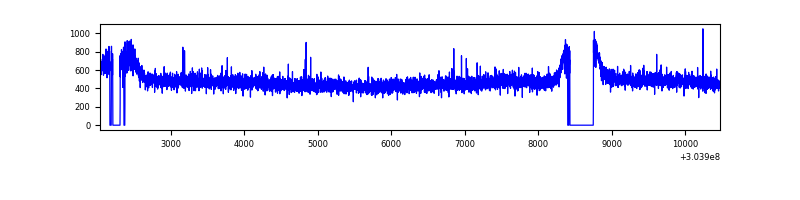 |
| B | 8437 | 7972 | 15 | 15 | 0.18% | 0.19% | 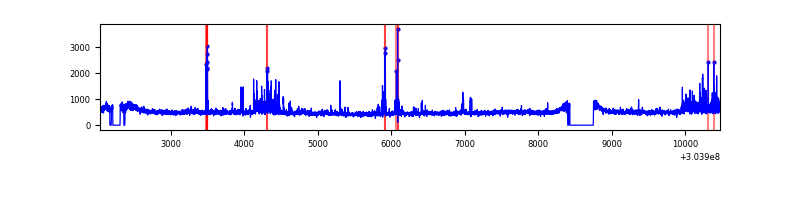 |
| C | 8437 | 7972 | 0 | 0 | 0.00% | 0.00% | 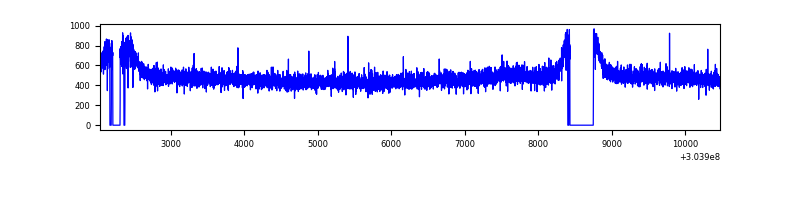 |
| D | 8437 | 7972 | 92 | 92 | 1.09% | 1.15% | 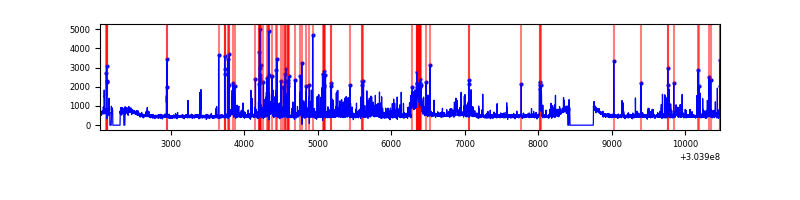 |
Top three noisy pixels from each quadrant. If the there are fewer than three noisy pixels in the level2.evt file, extra rows are filled as -1
| Pixel properties | Quadrant properties | ||||||
|---|---|---|---|---|---|---|---|
| Quadrant | DetID | PixID | Counts | Sigma | Mean | Median | Sigma |
| A | 13 | 254 | 11724 | 53.19 | 990 | 963 | 202.3 |
| A | 0 | 226 | 8528 | 37.39 | 990 | 963 | 202.3 |
| A | 3 | 137 | 8443 | 36.97 | 990 | 963 | 202.3 |
| B | 7 | 220 | 227267 | 1198.44 | 982 | 957 | 188.8 |
| B | 0 | 189 | 61007 | 318.0 | 982 | 957 | 188.8 |
| B | 3 | 64 | 31905 | 163.89 | 982 | 957 | 188.8 |
| C | 14 | 238 | 146331 | 650.85 | 948 | 951 | 223.4 |
| C | 13 | 61 | 6538 | 25.01 | 948 | 951 | 223.4 |
| C | 8 | 128 | 5210 | 19.07 | 948 | 951 | 223.4 |
| D | 1 | 52 | 711541 | 3055.98 | 961 | 934 | 232.5 |
| D | 7 | 238 | 211811 | 906.88 | 961 | 934 | 232.5 |
| D | 1 | 239 | 142059 | 606.91 | 961 | 934 | 232.5 |
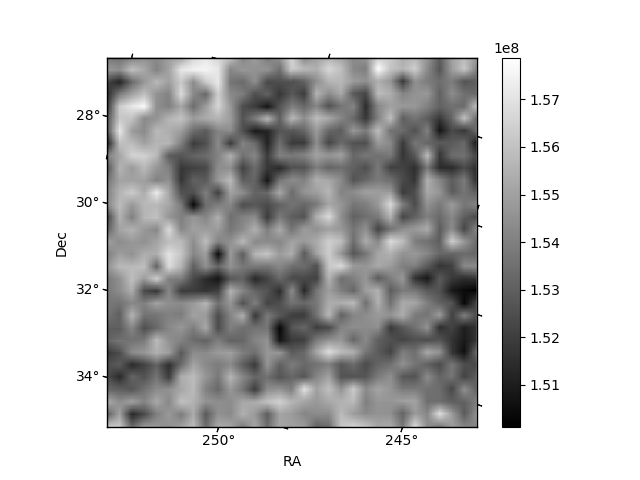
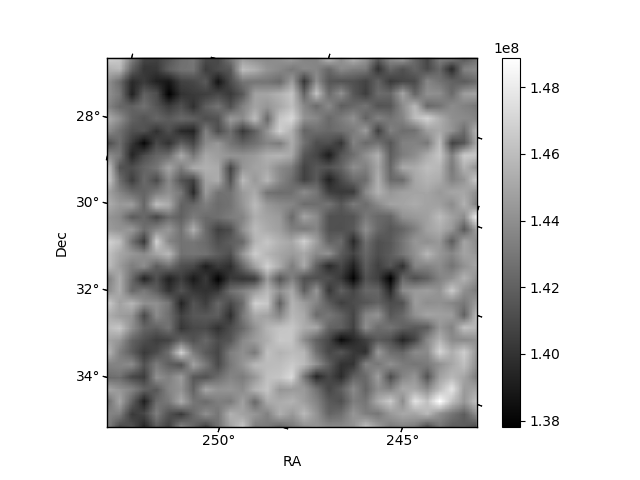
Histogram calculated using DETX and DETY for each event in the final _common_clean file
| Quadrant A | 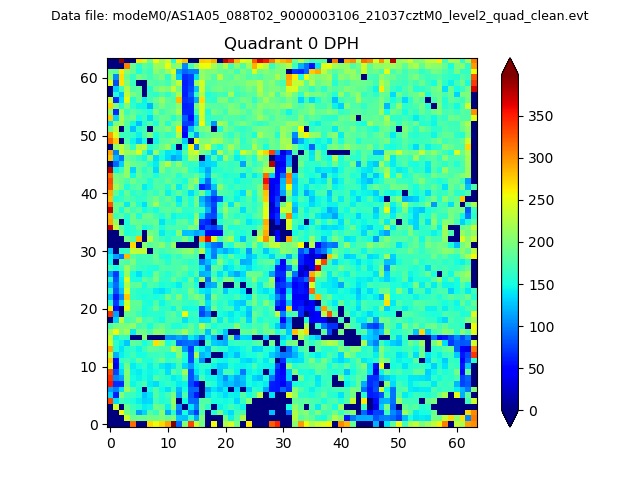 |
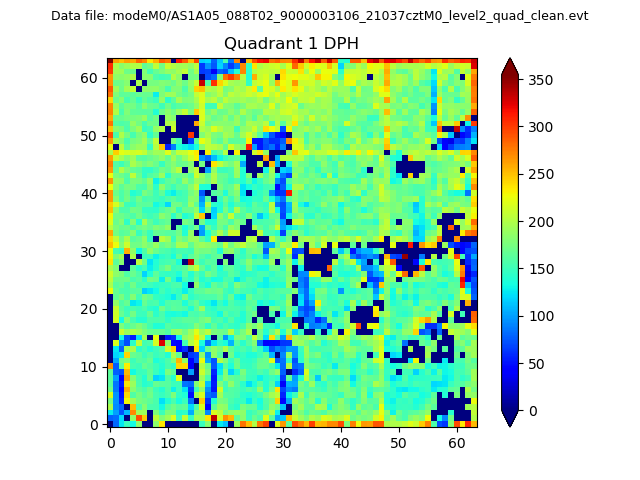 |
Quadrant B |
|---|---|---|---|
| Quadrant D |  |
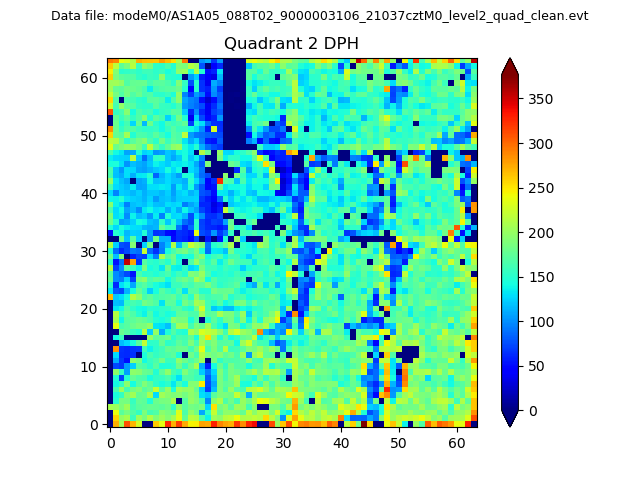 |
Quadrant C |
| Plot type | Count rate plots | Images |
|---|---|---|
| Comparison with Poisson distribution Blue bars denote a histogram of data divided into 1 sec bins. Red curve is a Poisson curve with rate = median count rate of data. |
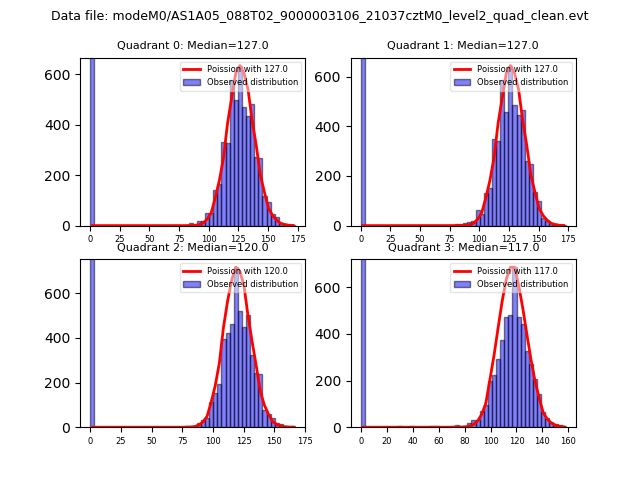 |
 |
| Quadrant-wise count rates Data is divided into 100 sec bins |
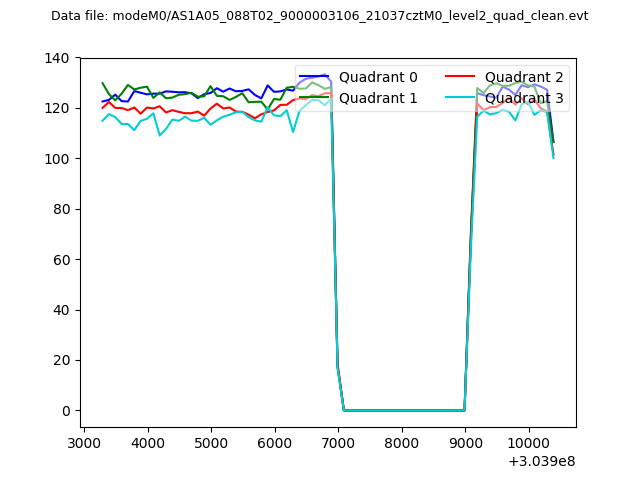 |
|
| Module-wise count rates for Quadrant A Data is divided into 100 sec bins |
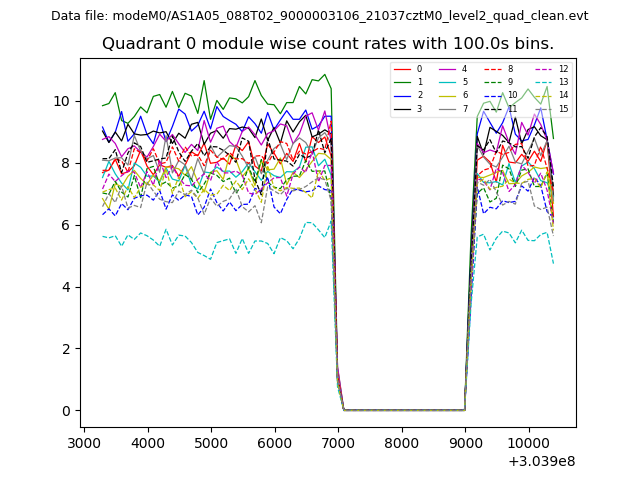 |
 |
| Module-wise count rates for Quadrant B Data is divided into 100 sec bins |
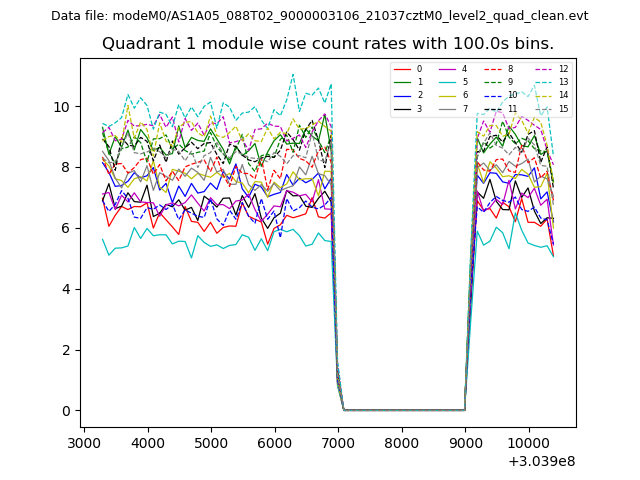 |
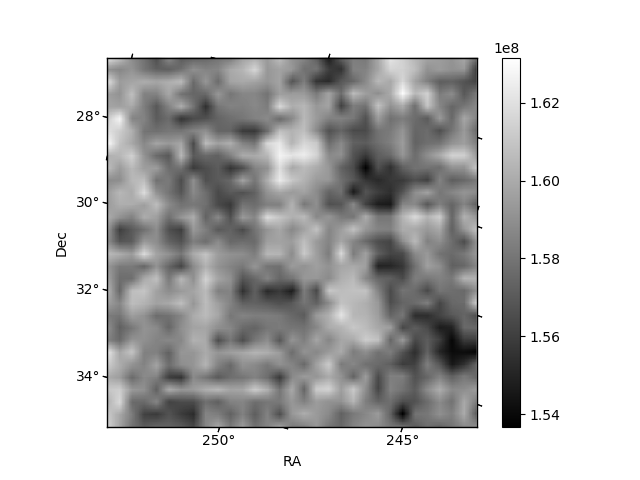 |
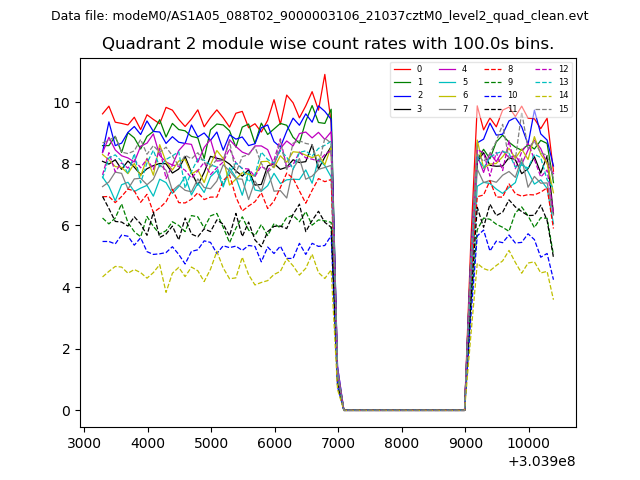
| Module-wise count rates for Quadrant C Data is divided into 100 sec bins |
 |
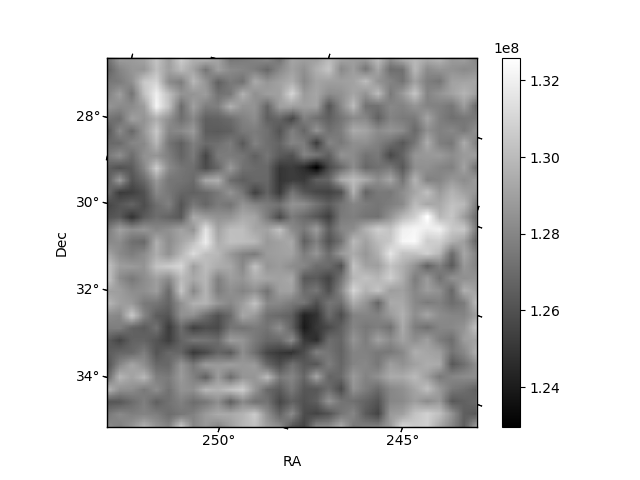 |
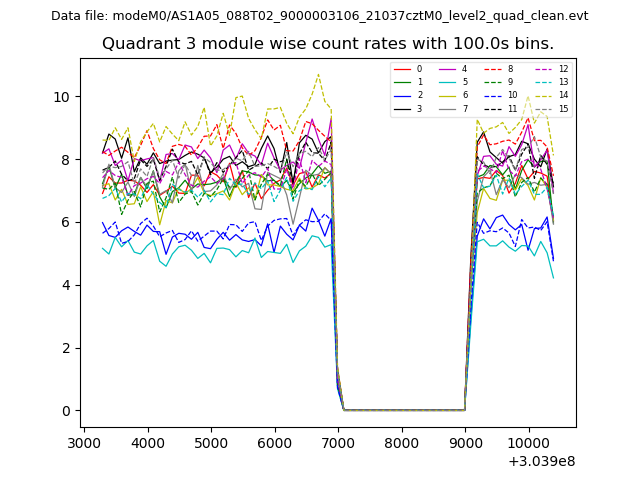
| Module-wise count rates for Quadrant D Data is divided into 100 sec bins |
 |
 |
| Parameter | Plot |
|---|---|
| CZT HV Monitor | 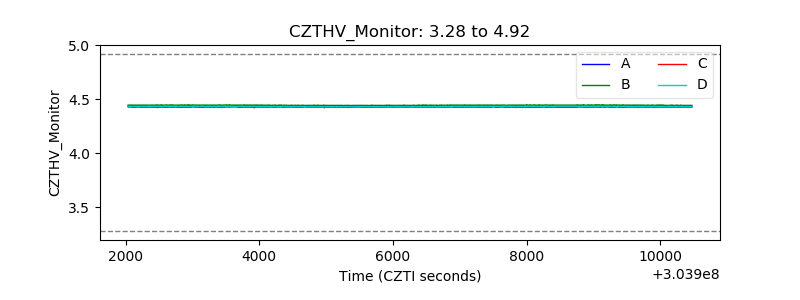 |
| D_VDD | 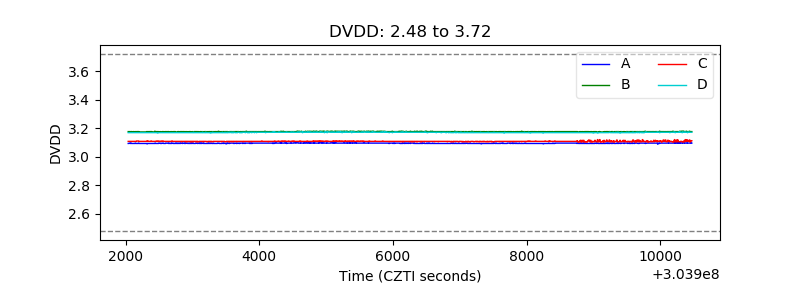 |
| Temperature 1 | 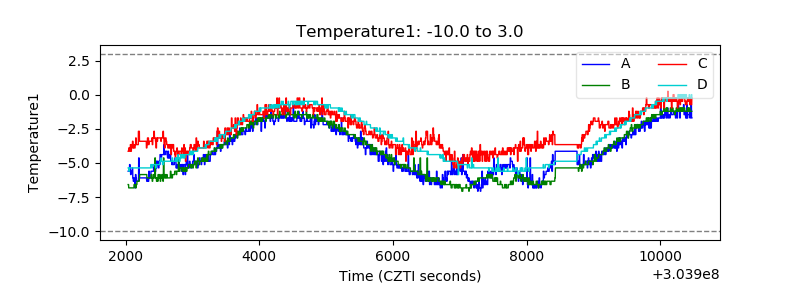 |
| Veto HV Monitor | 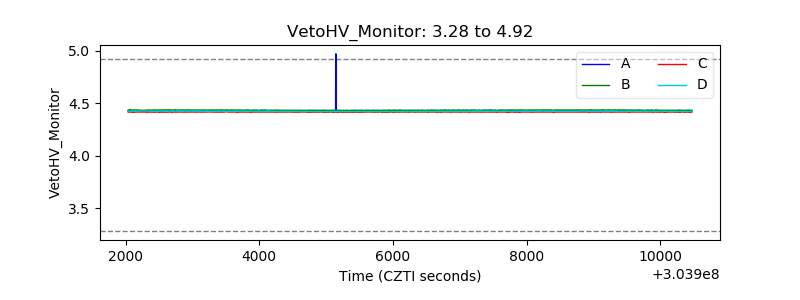 |
| Veto LLD | 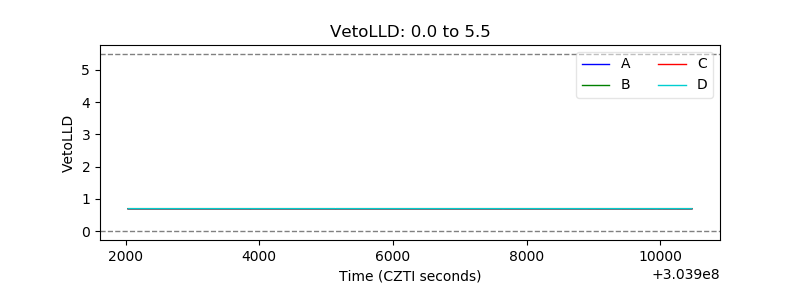 |
| Alpha Counter | 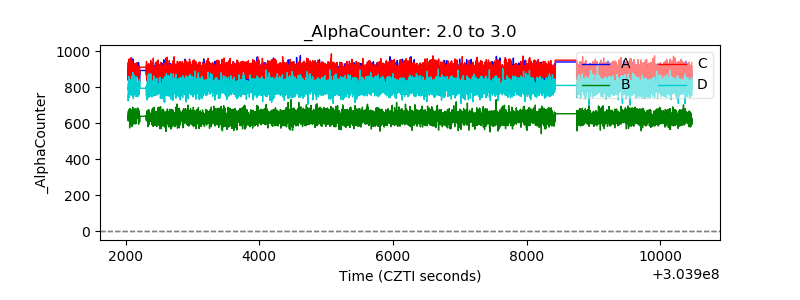 |
| _CPM_Rate | 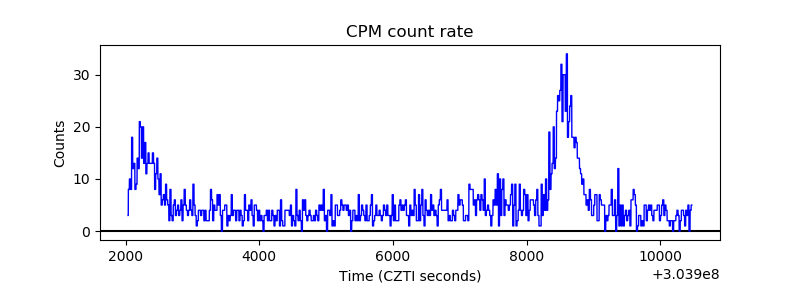 |
| CZT Counter |  |
| +2.5 Volts monitor |  |
| +5 Volts monitor | 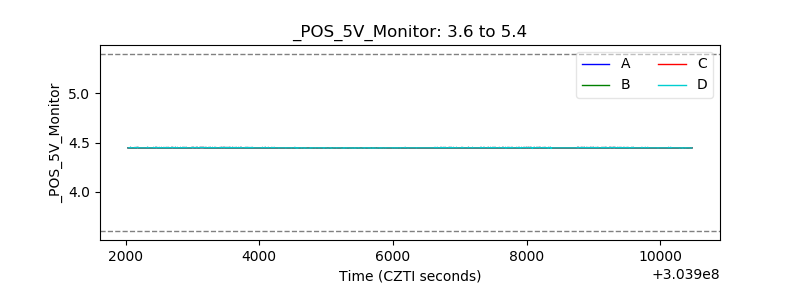 |
| _ROLL_ROT | 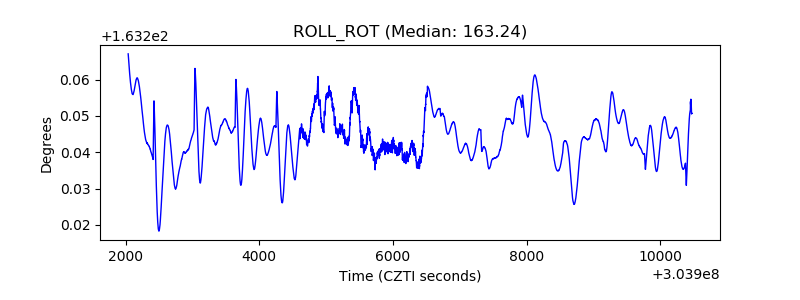 |
| _Roll_DEC | 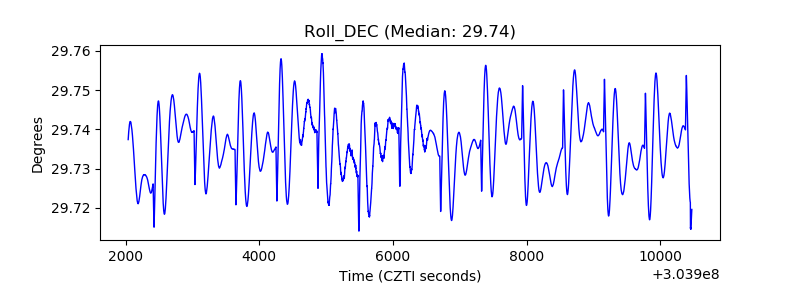 |
| _Roll_RA |  |
| Veto Counter | 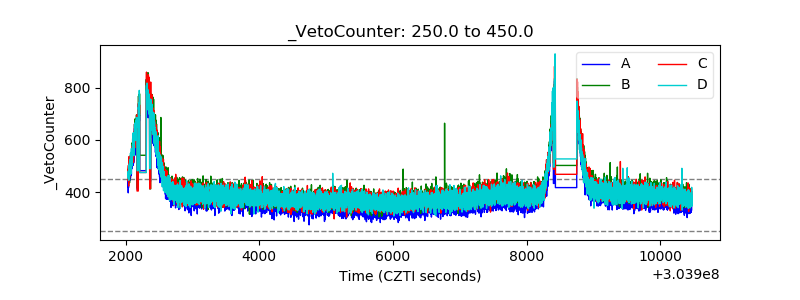 |