| Param | Original file | Final file |
|---|---|---|
| Filename | modeM0/AS1A05_088T02_9000003106_21040cztM0_level2.evt | modeM0/AS1A05_088T02_9000003106_21040cztM0_level2_quad_clean.evt |
| Size (bytes) | 1,440,256,320 | 230,978,880 |
| Size | 1.3 GB | 220.3 MB |
| Events in quadrant A | 8,219,271 | 1,520,925 |
| Events in quadrant B | 10,555,733 | 1,493,418 |
| Events in quadrant C | 8,285,767 | 1,447,112 |
| Events in quadrant D | 15,358,800 | 1,309,915 |
| Mode M9 | |||
|---|---|---|---|
| Quadrant | BADHDUFLAG | Total packets | Discarded packets |
| A | 0 | 22 | 0 |
| B | 0 | 22 | 0 |
| C | 0 | 22 | 0 |
| D | 0 | 22 | 0 |
| Mode SS | |||
|---|---|---|---|
| Quadrant | BADHDUFLAG | Total packets | Discarded packets |
| A | 0 | 360 | 0 |
| B | 0 | 360 | 0 |
| C | 0 | 360 | 0 |
| D | 0 | 360 | 0 |
| Mode M0 | |||
|---|---|---|---|
| Quadrant | BADHDUFLAG | Total packets | Discarded packets |
| A | 0 | 36329 | 3 |
| B | 0 | 43013 | 3 |
| C | 0 | 36245 | 3 |
| D | 0 | 57637 | 4 |
| Quadrant | Total seconds | Saturated seconds | Saturation percentage |
|---|---|---|---|
| A | 17754 | 157 | 0.884308% |
| B | 17755 | 609 | 3.430020% |
| C | 17755 | 224 | 1.261616% |
| D | 17754 | 2245 | 12.645038% |
Noise dominated data is calculated using 1-second bins in cleaned event files. If a bin has >2000 counts, and if more than 50% of those come from <1% of pixels, then it is considered to be noise-dominated and hence unusable.
| Quadrant | # 1 sec bins | Bins with >0 counts | Bins with >2000 counts | High rate bins dominated by noise | Noise dominated (total time) | Noise dominated (detector-on time) | Marked lightcurve |
|---|---|---|---|---|---|---|---|
| A | 19879 | 17757 | 0 | 0 | 0.00% | 0.00% | 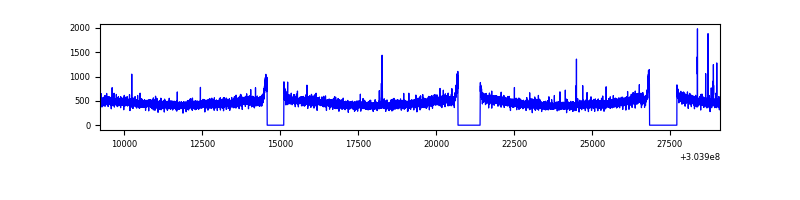 |
| B | 19880 | 17758 | 279 | 279 | 1.40% | 1.57% | 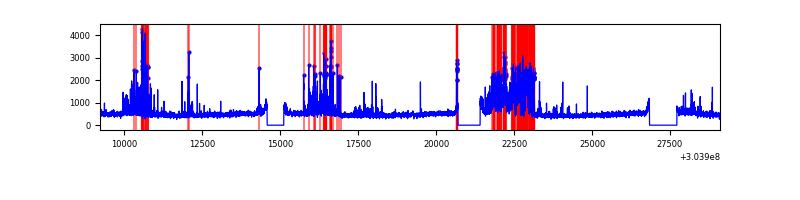 |
| C | 19880 | 17758 | 0 | 0 | 0.00% | 0.00% | 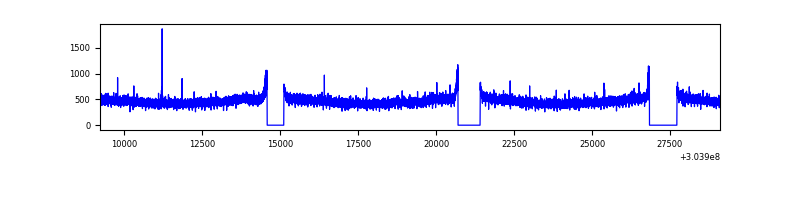 |
| D | 19879 | 17757 | 1955 | 1955 | 9.83% | 11.01% | 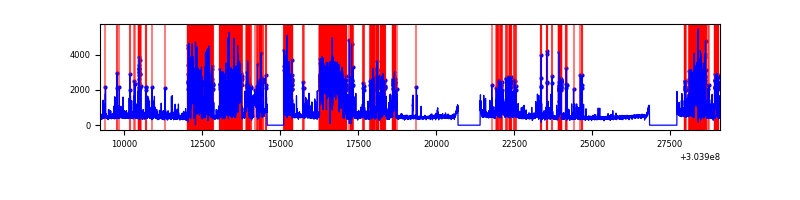 |
Top three noisy pixels from each quadrant. If the there are fewer than three noisy pixels in the level2.evt file, extra rows are filled as -1
| Pixel properties | Quadrant properties | ||||||
|---|---|---|---|---|---|---|---|
| Quadrant | DetID | PixID | Counts | Sigma | Mean | Median | Sigma |
| A | 6 | 16 | 32692 | 71.4 | 2125 | 2077 | 428.8 |
| A | 13 | 254 | 23683 | 50.39 | 2125 | 2077 | 428.8 |
| A | 0 | 226 | 18456 | 38.2 | 2125 | 2077 | 428.8 |
| B | 0 | 182 | 1284599 | 3239.49 | 2097 | 2044 | 395.9 |
| B | 7 | 220 | 595310 | 1498.48 | 2097 | 2044 | 395.9 |
| B | 0 | 189 | 148537 | 370.01 | 2097 | 2044 | 395.9 |
| C | 14 | 238 | 314032 | 653.05 | 2036 | 2047 | 477.7 |
| C | 13 | 61 | 14454 | 25.97 | 2036 | 2047 | 477.7 |
| C | 8 | 128 | 11679 | 20.16 | 2036 | 2047 | 477.7 |
| D | 1 | 52 | 7097596 | 14870.24 | 1968 | 1913 | 477.2 |
| D | 9 | 1 | 343754 | 716.39 | 1968 | 1913 | 477.2 |
| D | 13 | 172 | 209499 | 435.03 | 1968 | 1913 | 477.2 |
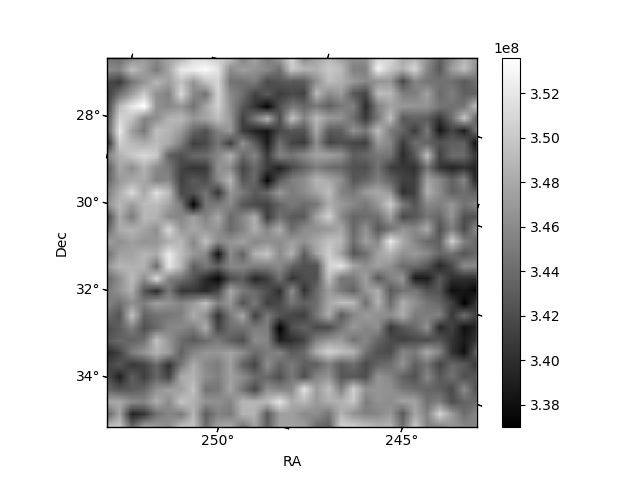
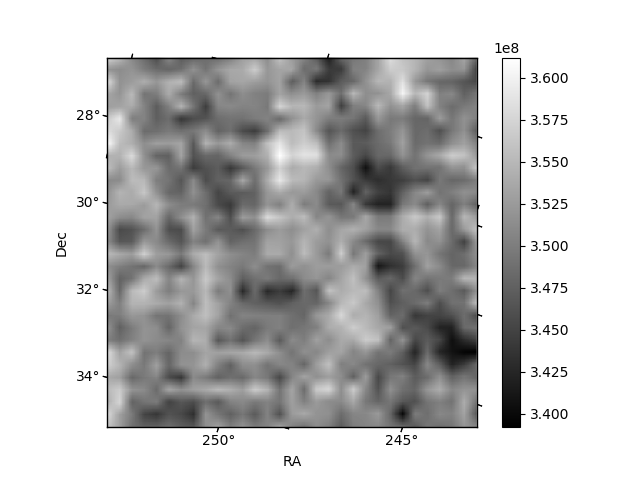
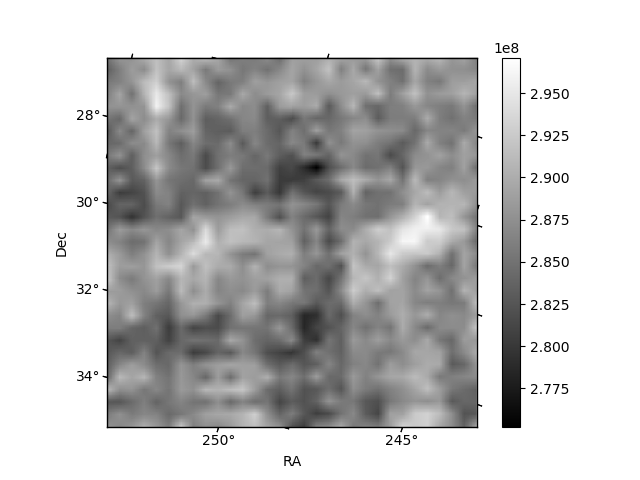
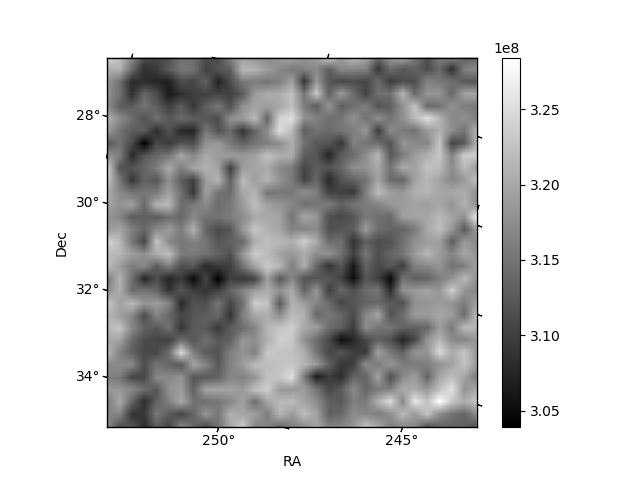
Histogram calculated using DETX and DETY for each event in the final _common_clean file
| Quadrant A | 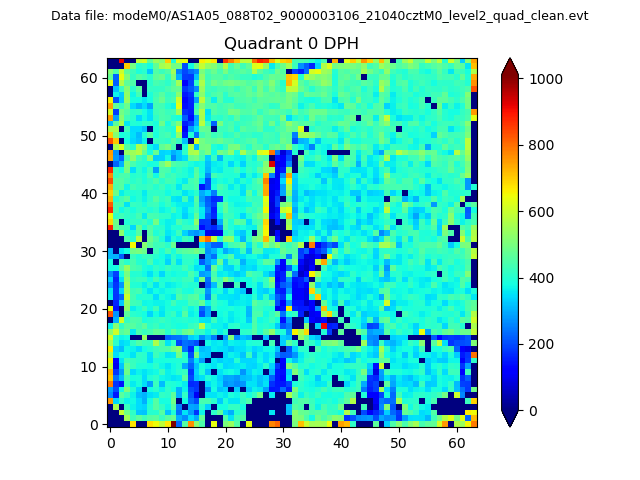 |
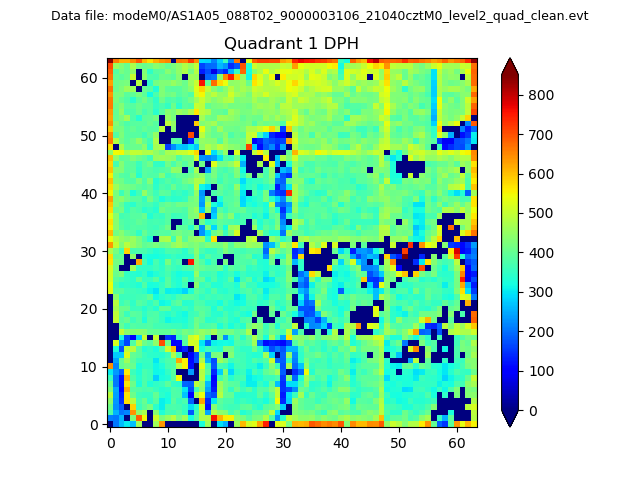 |
Quadrant B |
|---|---|---|---|
| Quadrant D | 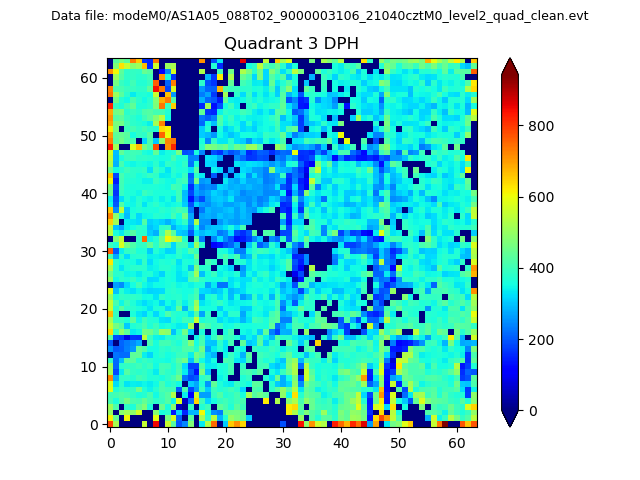 |
 |
Quadrant C |
| Plot type | Count rate plots | Images |
|---|---|---|
| Comparison with Poisson distribution Blue bars denote a histogram of data divided into 1 sec bins. Red curve is a Poisson curve with rate = median count rate of data. |
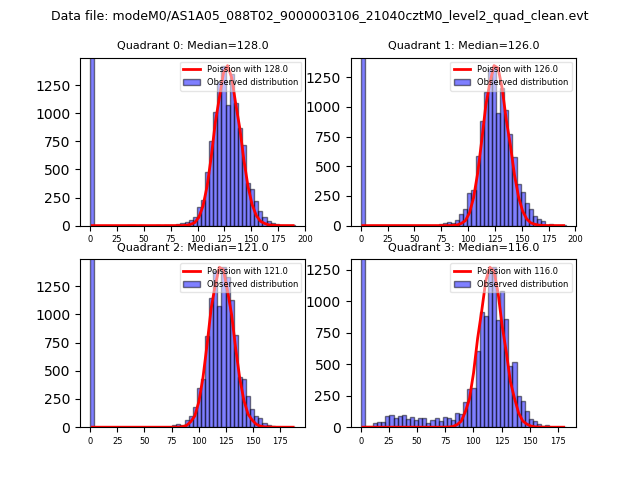 |
 |
| Quadrant-wise count rates Data is divided into 100 sec bins |
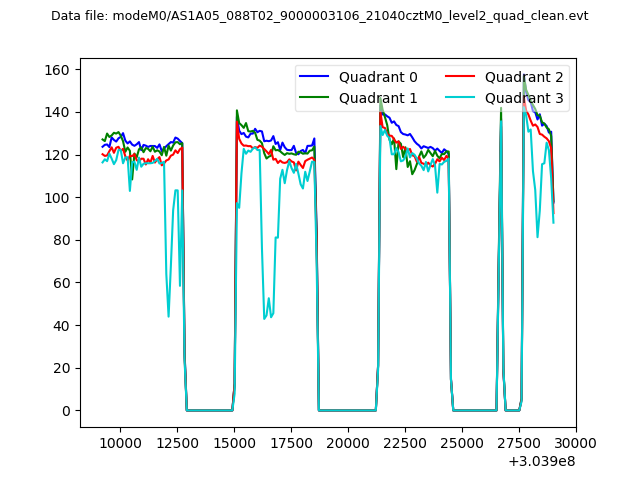 |
|
| Module-wise count rates for Quadrant A Data is divided into 100 sec bins |
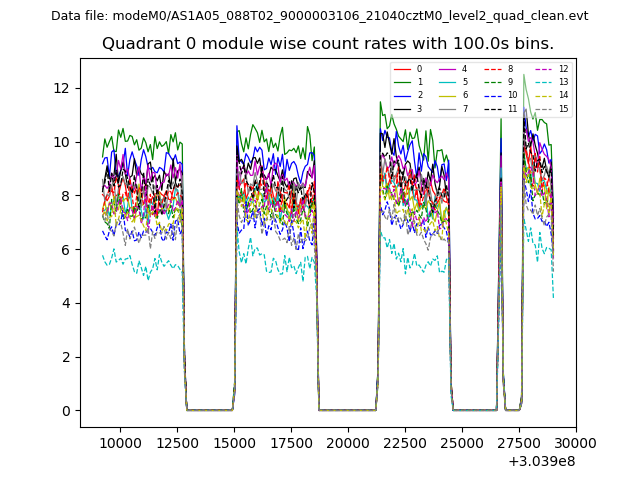 |
 |
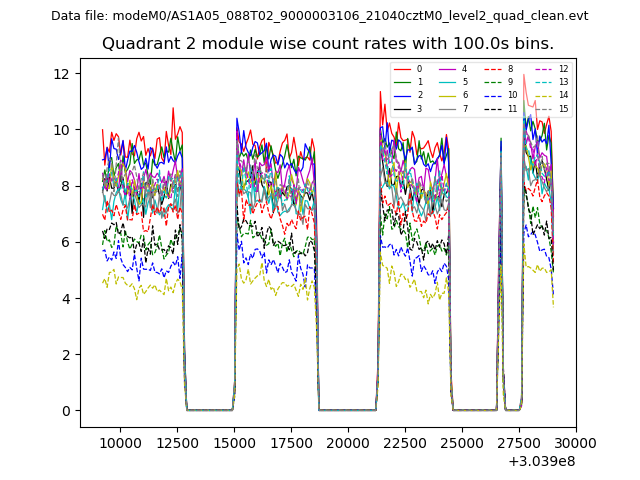
| Module-wise count rates for Quadrant B Data is divided into 100 sec bins |
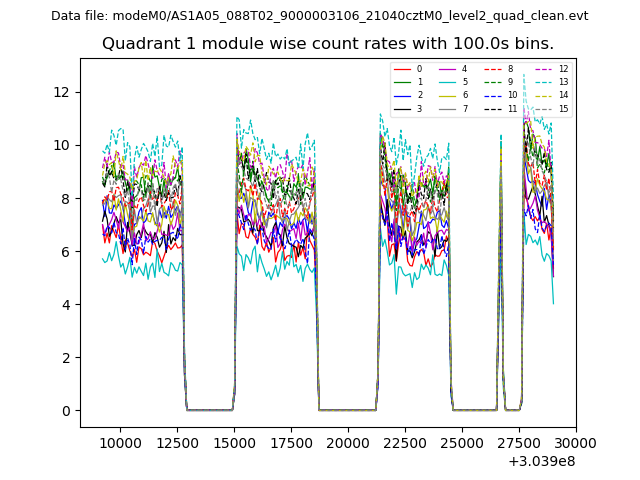 |
 |
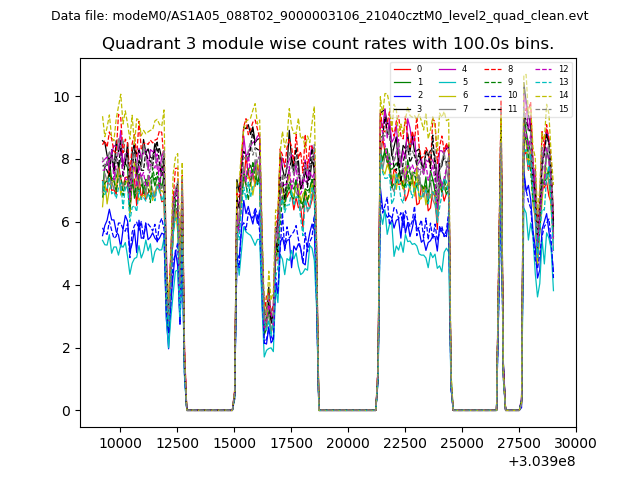
| Module-wise count rates for Quadrant C Data is divided into 100 sec bins |
 |
 |
| Module-wise count rates for Quadrant D Data is divided into 100 sec bins |
 |
 |
| Parameter | Plot |
|---|---|
| CZT HV Monitor | 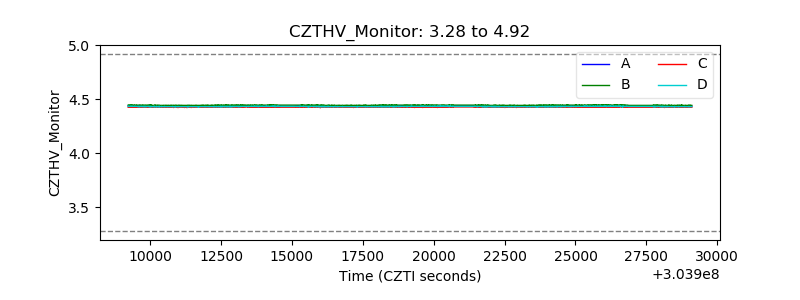 |
| D_VDD | 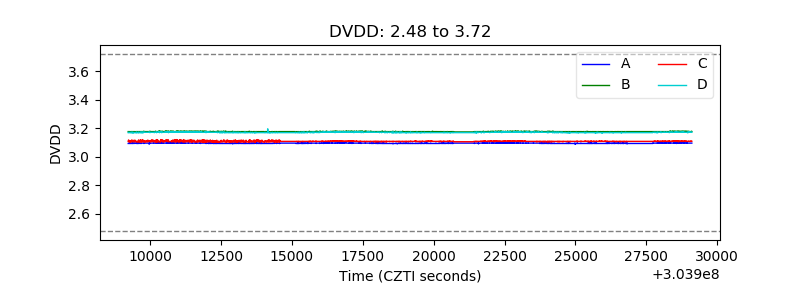 |
| Temperature 1 | 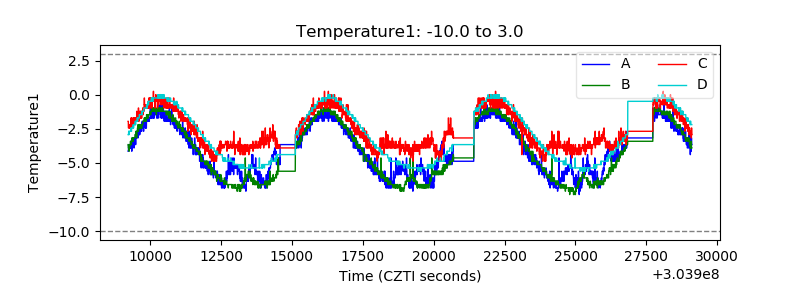 |
| Veto HV Monitor | 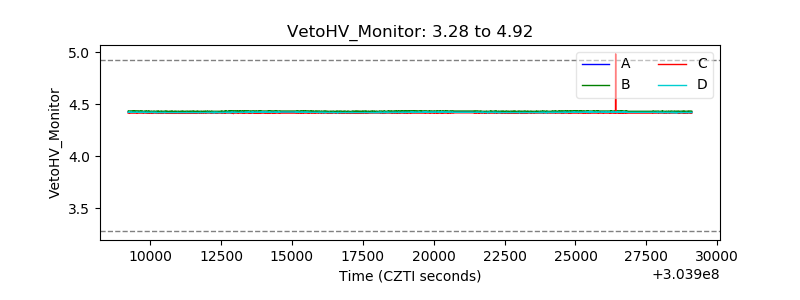 |
| Veto LLD | 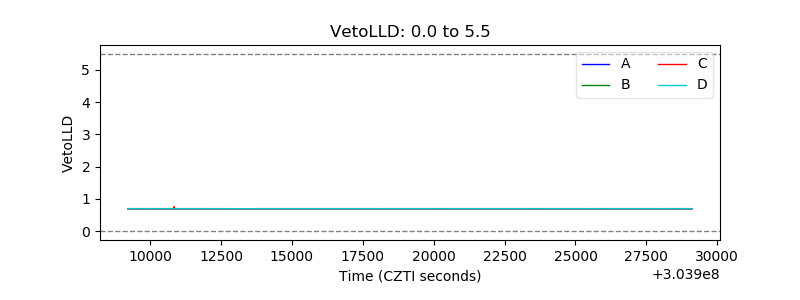 |
| Alpha Counter | 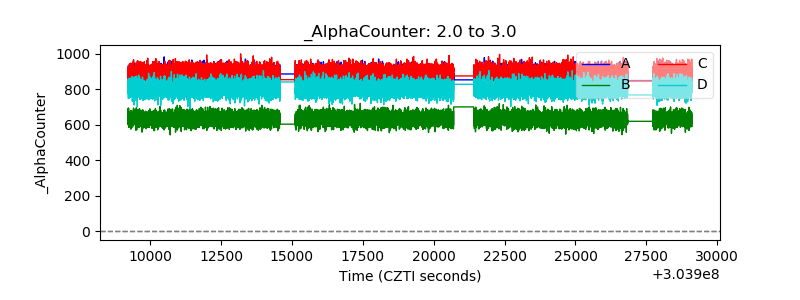 |
| _CPM_Rate | 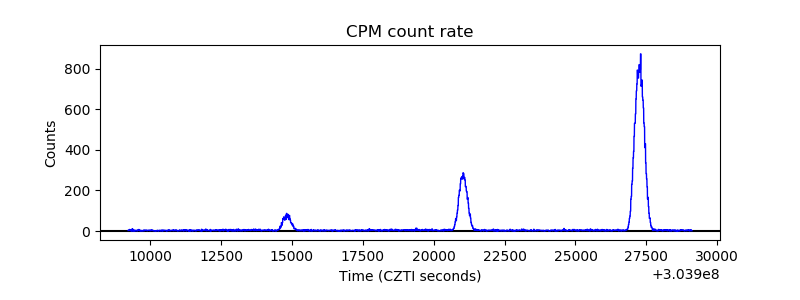 |
| CZT Counter |  |
| +2.5 Volts monitor |  |
| +5 Volts monitor | 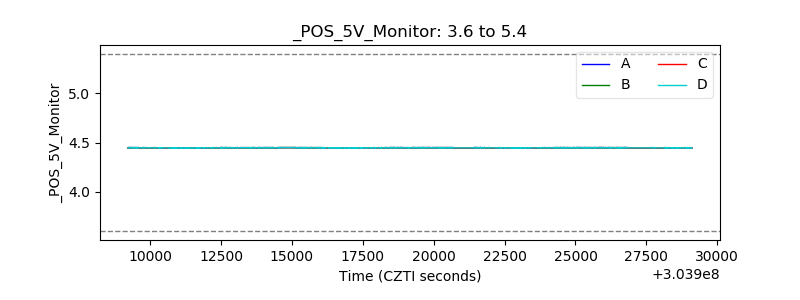 |
| _ROLL_ROT | 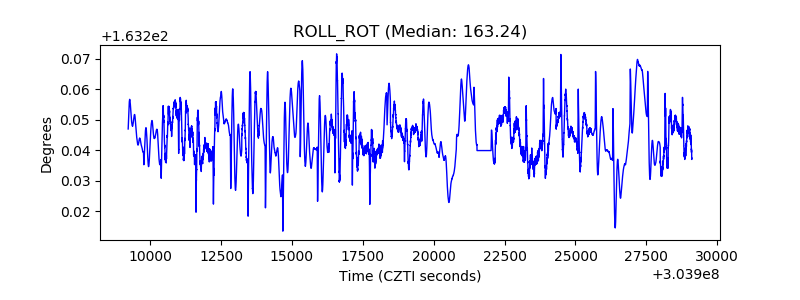 |
| _Roll_DEC | 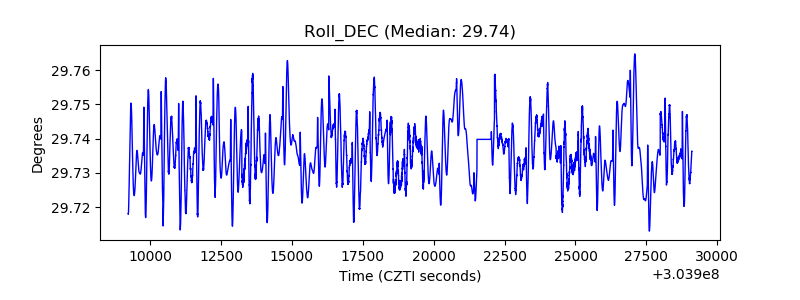 |
| _Roll_RA | 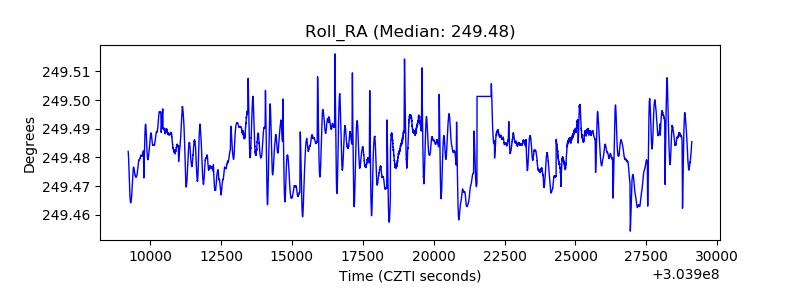 |
| Veto Counter | 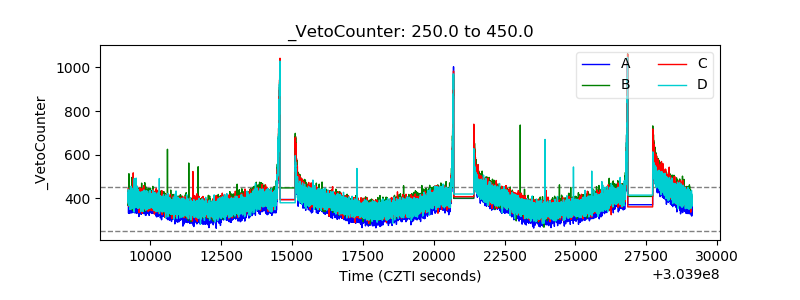 |