| Param | Original file | Final file |
|---|---|---|
| Filename | modeM0/AS1A05_088T02_9000003106_21043cztM0_level2.evt | modeM0/AS1A05_088T02_9000003106_21043cztM0_level2_quad_clean.evt |
| Size (bytes) | 473,227,200 | 90,887,040 |
| Size | 451.3 MB | 86.7 MB |
| Events in quadrant A | 3,199,284 | 594,094 |
| Events in quadrant B | 3,258,676 | 597,263 |
| Events in quadrant C | 3,102,311 | 569,423 |
| Events in quadrant D | 4,331,386 | 539,651 |
| Mode M9 | |||
|---|---|---|---|
| Quadrant | BADHDUFLAG | Total packets | Discarded packets |
| A | 0 | 14 | 0 |
| B | 0 | 15 | 0 |
| C | 0 | 15 | 0 |
| D | 0 | 15 | 0 |
| Mode SS | |||
|---|---|---|---|
| Quadrant | BADHDUFLAG | Total packets | Discarded packets |
| A | 0 | 130 | 0 |
| B | 0 | 130 | 0 |
| C | 0 | 130 | 0 |
| D | 0 | 130 | 0 |
| Mode M0 | |||
|---|---|---|---|
| Quadrant | BADHDUFLAG | Total packets | Discarded packets |
| A | 0 | 13821 | 2 |
| B | 0 | 13994 | 2 |
| C | 0 | 13372 | 2 |
| D | 0 | 17384 | 2 |
| Quadrant | Total seconds | Saturated seconds | Saturation percentage |
|---|---|---|---|
| A | 6482 | 59 | 0.910213% |
| B | 6482 | 84 | 1.295896% |
| C | 6482 | 67 | 1.033632% |
| D | 6482 | 391 | 6.032089% |
Noise dominated data is calculated using 1-second bins in cleaned event files. If a bin has >2000 counts, and if more than 50% of those come from <1% of pixels, then it is considered to be noise-dominated and hence unusable.
| Quadrant | # 1 sec bins | Bins with >0 counts | Bins with >2000 counts | High rate bins dominated by noise | Noise dominated (total time) | Noise dominated (detector-on time) | Marked lightcurve |
|---|---|---|---|---|---|---|---|
| A | 7492 | 6483 | 11 | 11 | 0.15% | 0.17% | 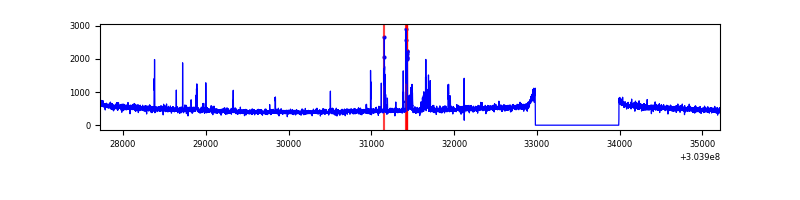 |
| B | 7492 | 6483 | 17 | 17 | 0.23% | 0.26% | 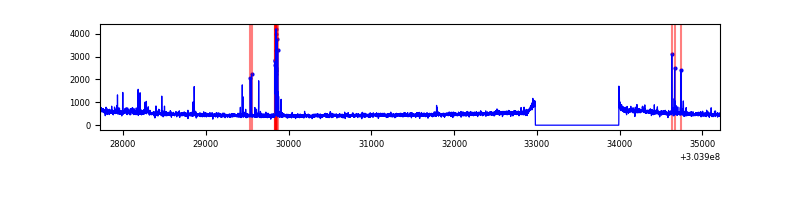 |
| C | 7492 | 6483 | 0 | 0 | 0.00% | 0.00% | 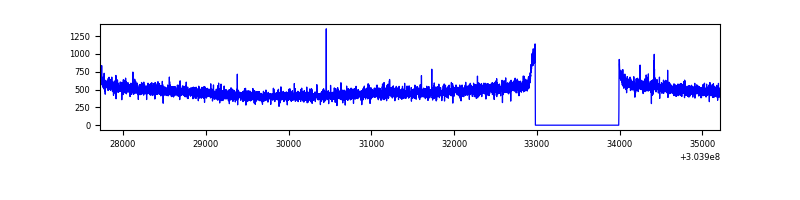 |
| D | 7492 | 6483 | 308 | 308 | 4.11% | 4.75% | 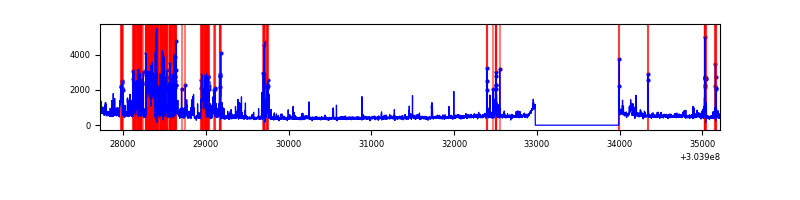 |
Top three noisy pixels from each quadrant. If the there are fewer than three noisy pixels in the level2.evt file, extra rows are filled as -1
| Pixel properties | Quadrant properties | ||||||
|---|---|---|---|---|---|---|---|
| Quadrant | DetID | PixID | Counts | Sigma | Mean | Median | Sigma |
| A | 6 | 16 | 147046 | 924.73 | 790 | 773 | 158.2 |
| A | 13 | 254 | 8902 | 51.39 | 790 | 773 | 158.2 |
| A | 0 | 226 | 6717 | 37.58 | 790 | 773 | 158.2 |
| B | 7 | 220 | 54635 | 361.44 | 787 | 768 | 149.0 |
| B | 0 | 190 | 32719 | 214.39 | 787 | 768 | 149.0 |
| B | 0 | 228 | 23742 | 154.15 | 787 | 768 | 149.0 |
| C | 14 | 238 | 117016 | 648.78 | 760 | 764 | 179.2 |
| C | 10 | 91 | 15753 | 83.65 | 760 | 764 | 179.2 |
| C | 9 | 54 | 5674 | 27.4 | 760 | 764 | 179.2 |
| D | 1 | 52 | 1164771 | 6353.33 | 755 | 733 | 183.2 |
| D | 9 | 1 | 194477 | 1057.46 | 755 | 733 | 183.2 |
| D | 1 | 239 | 47978 | 257.86 | 755 | 733 | 183.2 |
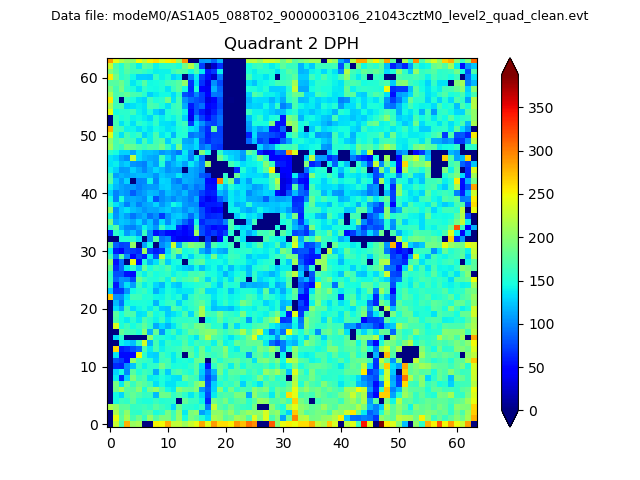
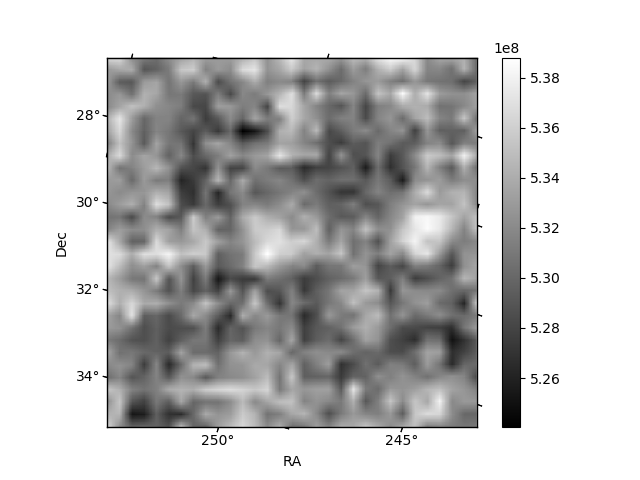
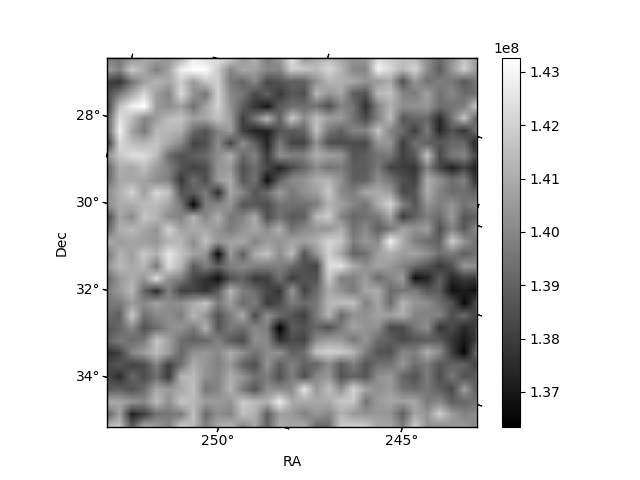
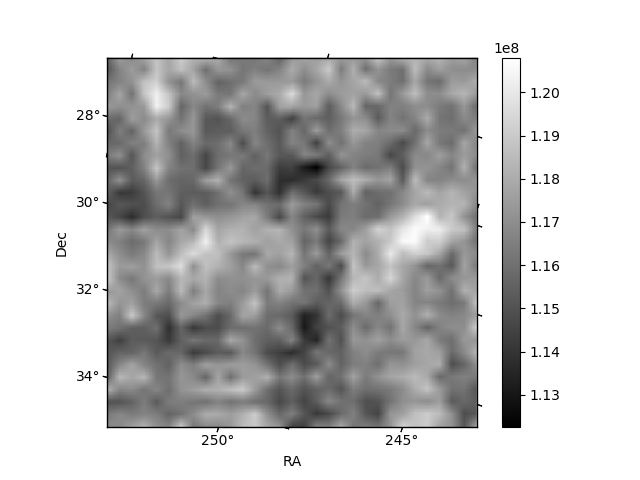
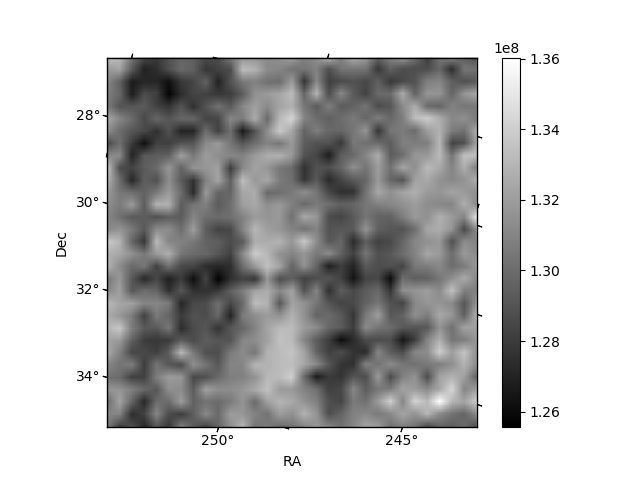
Histogram calculated using DETX and DETY for each event in the final _common_clean file
| Quadrant A | 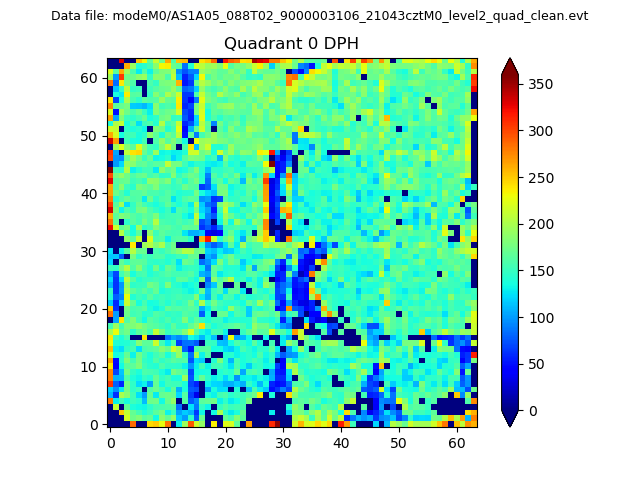 |
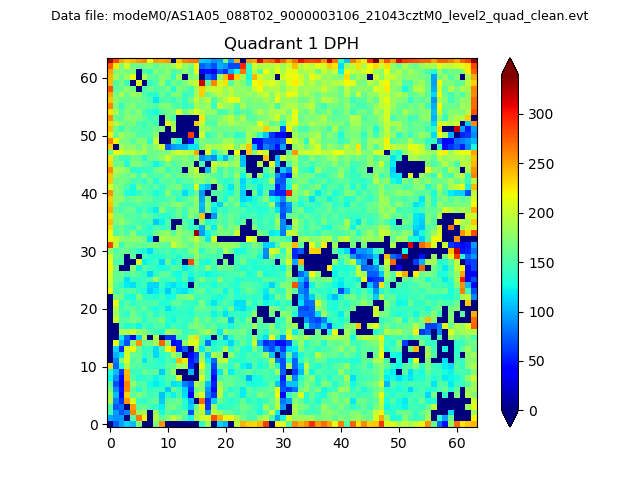 |
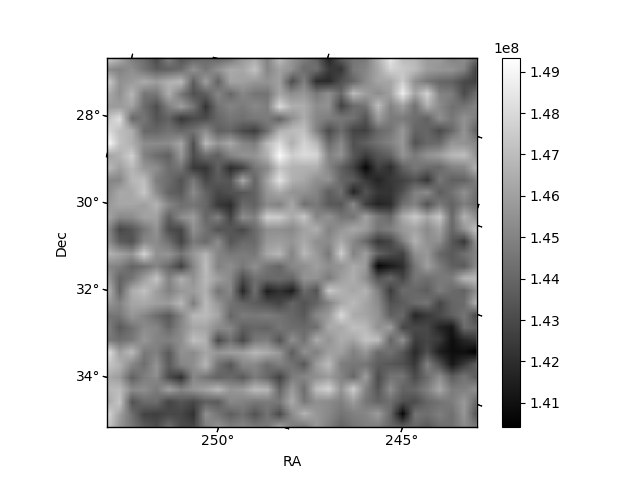
Quadrant B |
|---|---|---|---|
| Quadrant D | 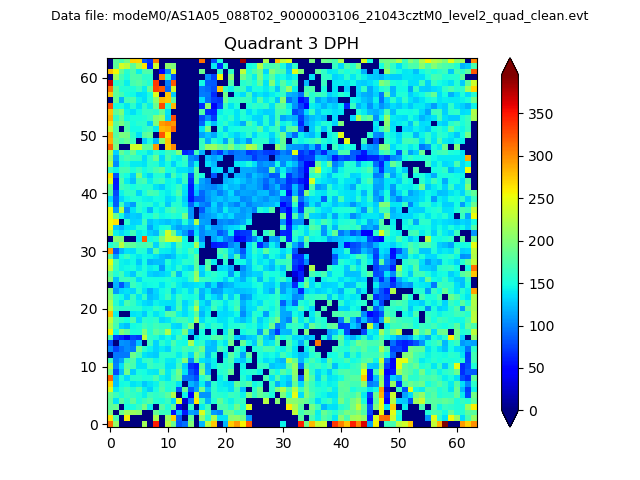 |
 |
Quadrant C |
| Plot type | Count rate plots | Images |
|---|---|---|
| Comparison with Poisson distribution Blue bars denote a histogram of data divided into 1 sec bins. Red curve is a Poisson curve with rate = median count rate of data. |
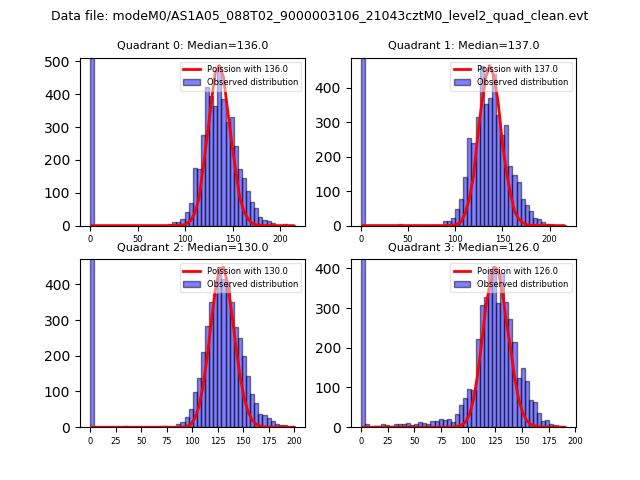 |
 |
| Quadrant-wise count rates Data is divided into 100 sec bins |
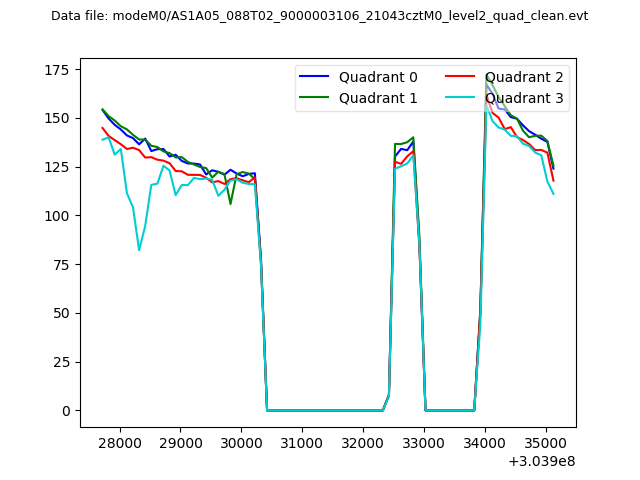 |
|
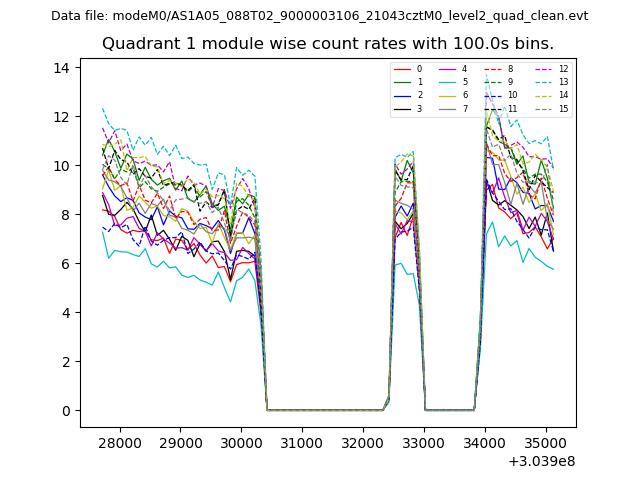
| Module-wise count rates for Quadrant A Data is divided into 100 sec bins |
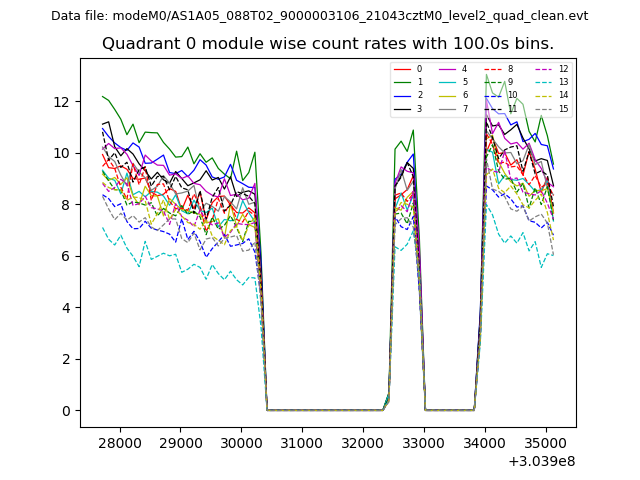 |
 |
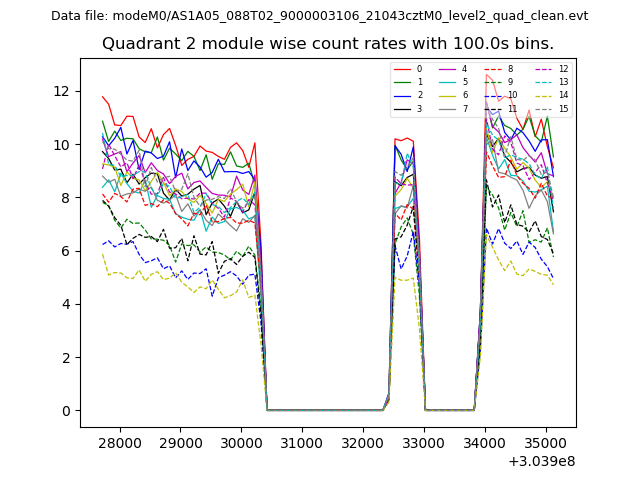
| Module-wise count rates for Quadrant B Data is divided into 100 sec bins |
 |
 |
| Module-wise count rates for Quadrant C Data is divided into 100 sec bins |
 |
 |
| Module-wise count rates for Quadrant D Data is divided into 100 sec bins |
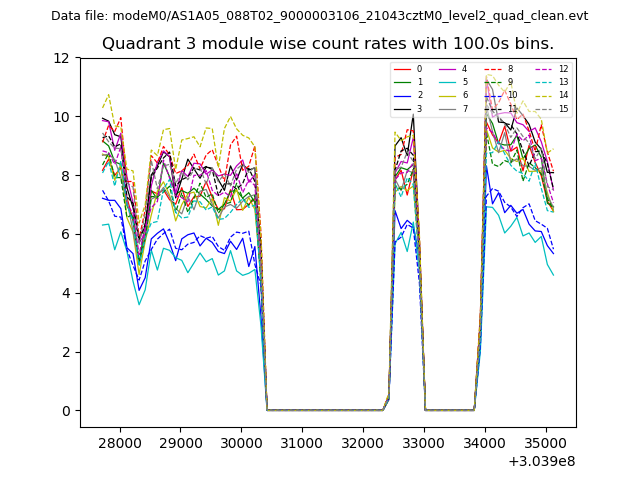 |
 |
| Parameter | Plot |
|---|---|
| CZT HV Monitor | 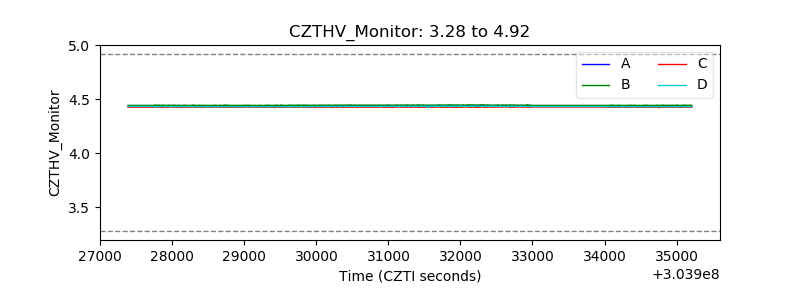 |
| D_VDD | 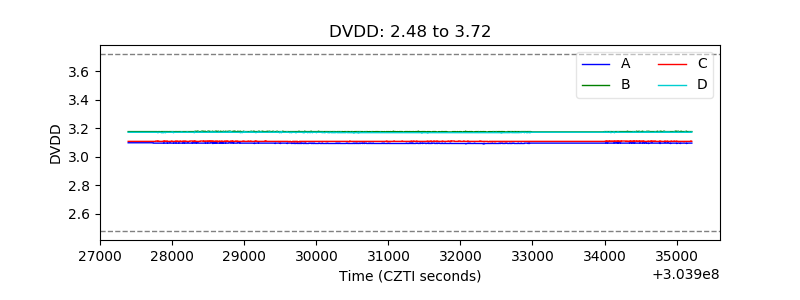 |
| Temperature 1 | 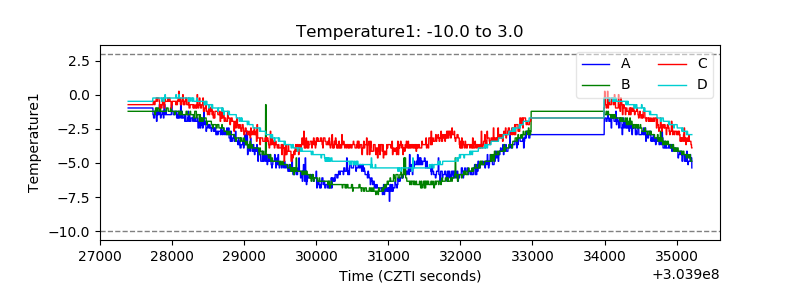 |
| Veto HV Monitor | 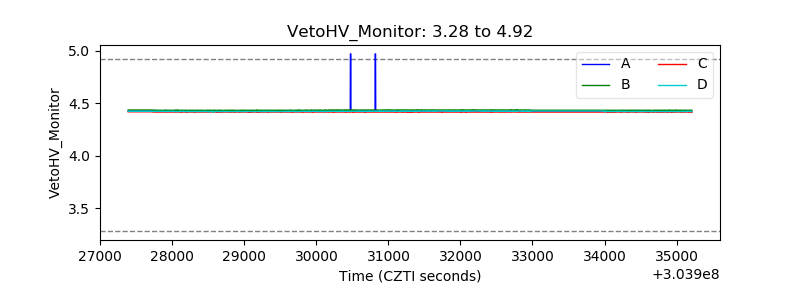 |
| Veto LLD | 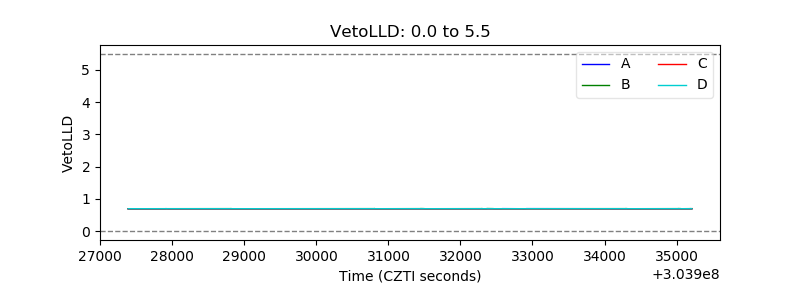 |
| Alpha Counter | 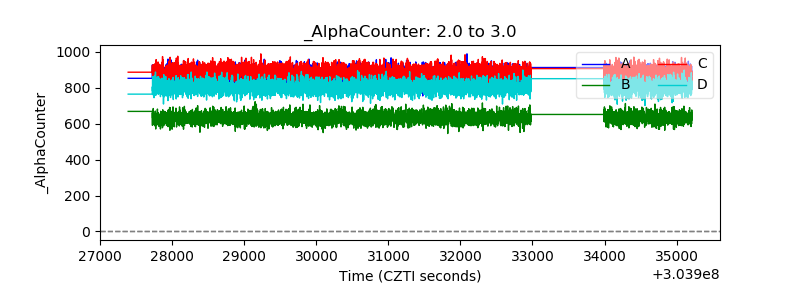 |
| _CPM_Rate | 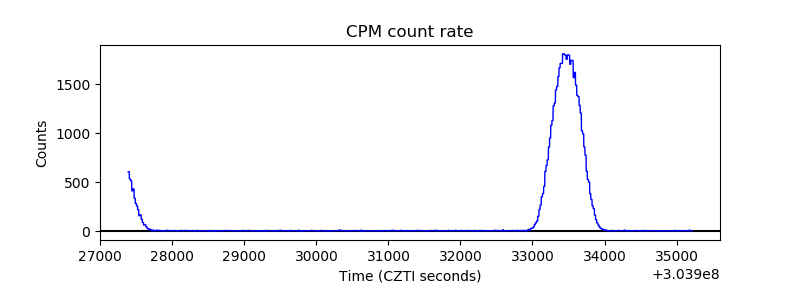 |
| CZT Counter | 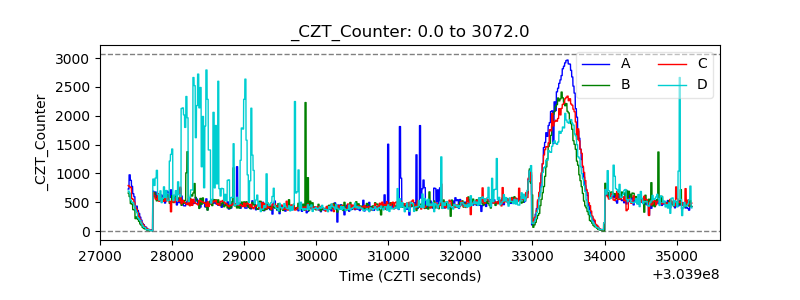 |
| +2.5 Volts monitor | 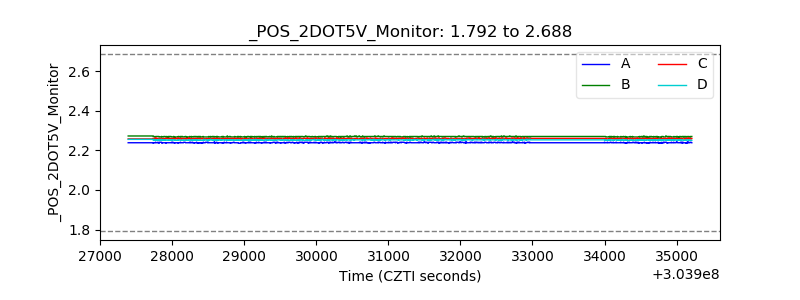 |
| +5 Volts monitor |  |
| _ROLL_ROT | 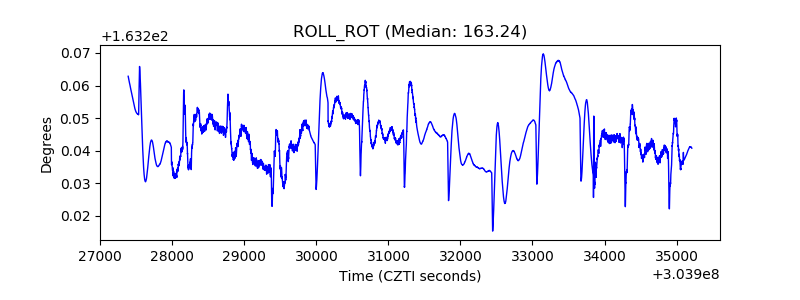 |
| _Roll_DEC | 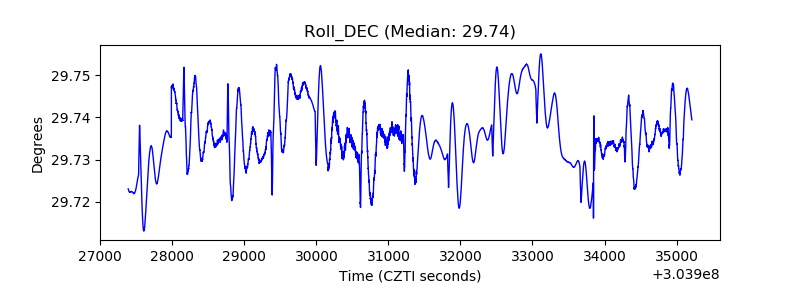 |
| _Roll_RA | 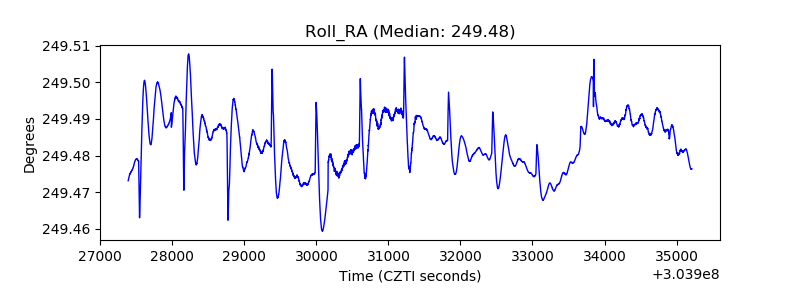 |
| Veto Counter | 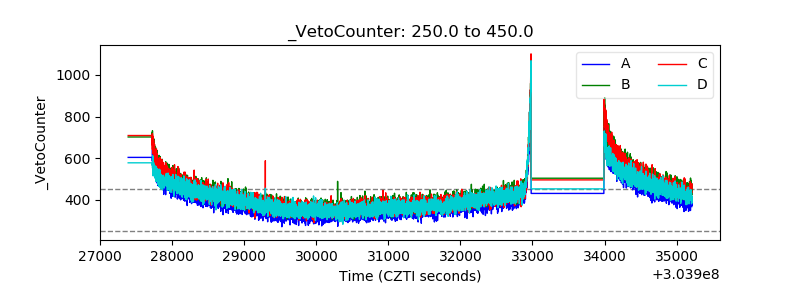 |