| Param | Original file | Final file |
|---|---|---|
| Filename | modeM0/AS1A05_104T04_9000003108cztM0_level2.fits | modeM0/AS1A05_104T04_9000003108cztM0_level2_quad_clean.evt |
| Size (bytes) | 333,696,960 | 200,249,280 |
| Size | 318.2 MB | 191.0 MB |
| Events in quadrant A | 2,076,460 | 989,384 |
| Events in quadrant B | 2,007,564 | 1,003,550 |
| Events in quadrant C | 2,028,088 | 957,520 |
| Events in quadrant D | 1,764,788 | 881,722 |
| Mode M0 | |||
|---|---|---|---|
| Quadrant | BADHDUFLAG | Total packets | Discarded packets |
| A | 0 | 67572 | 0 |
| B | 0 | 69692 | 0 |
| C | 0 | 68059 | 0 |
| D | 0 | 70813 | 0 |
| Mode M9 | |||
|---|---|---|---|
| Quadrant | BADHDUFLAG | Total packets | Discarded packets |
| A | 0 | 74 | 0 |
| B | 0 | 74 | 0 |
| C | 0 | 74 | 0 |
| D | 0 | 74 | 0 |
| Mode SS | |||
|---|---|---|---|
| Quadrant | BADHDUFLAG | Total packets | Discarded packets |
| A | 0 | 660 | 0 |
| B | 0 | 660 | 0 |
| C | 0 | 660 | 0 |
| D | 0 | 660 | 0 |
| Quadrant | Total seconds | Saturated seconds | Saturation percentage |
|---|---|---|---|
| A | 32456 | 174 | 0.536110% |
| B | 32456 | 278 | 0.856544% |
| C | 32456 | 408 | 1.257087% |
| D | 32456 | 329 | 1.013680% |
Noise dominated data is calculated using 1-second bins in cleaned event files. If a bin has >2000 counts, and if more than 50% of those come from <1% of pixels, then it is considered to be noise-dominated and hence unusable.
| Quadrant | # 1 sec bins | Bins with >0 counts | Bins with >2000 counts | High rate bins dominated by noise | Noise dominated (total time) | Noise dominated (detector-on time) | Marked lightcurve |
|---|---|---|---|---|---|---|---|
| A | 39801 | 32456 | 0 | 0 | 0.00% | 0.00% | 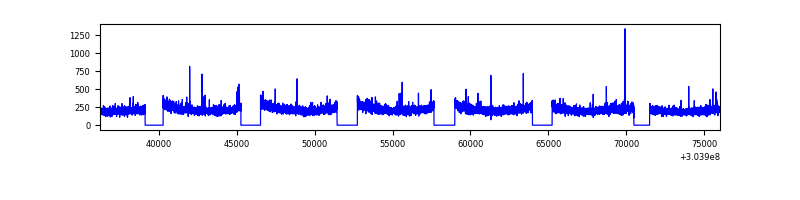 |
| B | 39801 | 32456 | 0 | 0 | 0.00% | 0.00% |  |
| C | 39801 | 32456 | 0 | 0 | 0.00% | 0.00% |  |
| D | 39801 | 32456 | 0 | 0 | 0.00% | 0.00% |  |
Top three noisy pixels from each quadrant. If the there are fewer than three noisy pixels in the level2.evt file, extra rows are filled as -1
| Pixel properties | Quadrant properties | ||||||
|---|---|---|---|---|---|---|---|
| Quadrant | DetID | PixID | Counts | Sigma | Mean | Median | Sigma |
| A | 0 | 29 | 1960 | 10.84 | 540 | 510 | 133.8 |
| A | 7 | 110 | 1637 | 8.42 | 540 | 510 | 133.8 |
| A | 0 | 30 | 1560 | 7.85 | 540 | 510 | 133.8 |
| B | 2 | 9 | 1581 | 10.04 | 530 | 506 | 107.1 |
| B | 5 | 128 | 1372 | 8.09 | 530 | 506 | 107.1 |
| B | 2 | 8 | 1345 | 7.84 | 530 | 506 | 107.1 |
| C | 1 | 81 | 1550 | 7.59 | 534 | 501 | 138.1 |
| C | 1 | 80 | 1536 | 7.49 | 534 | 501 | 138.1 |
| C | 3 | 234 | 1361 | 6.23 | 534 | 501 | 138.1 |
| D | 7 | 3 | 1275 | 6.02 | 504 | 459 | 135.4 |
| D | 6 | 67 | 1261 | 5.92 | 504 | 459 | 135.4 |
| D | 15 | 46 | 1259 | 5.91 | 504 | 459 | 135.4 |
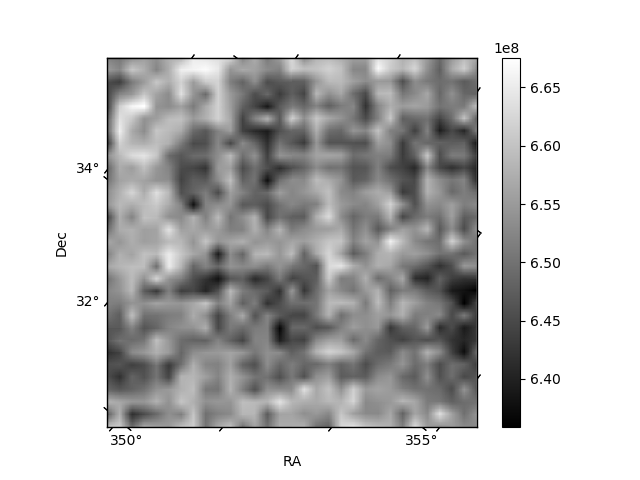
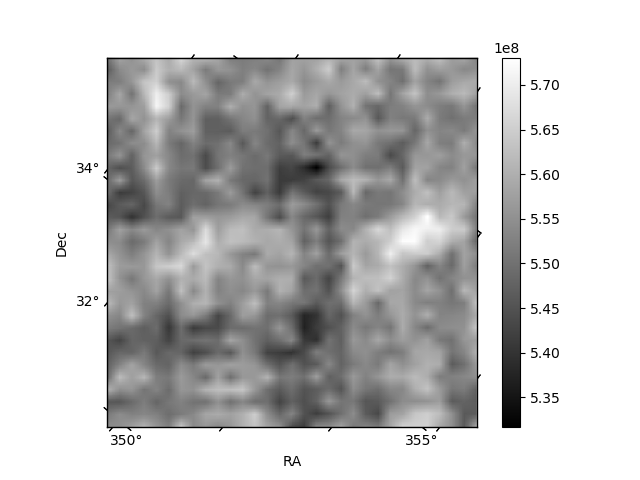
Histogram calculated using DETX and DETY for each event in the final _common_clean file
| Quadrant A |  |
 |
Quadrant B |
|---|---|---|---|
| Quadrant D |  |
 |
Quadrant C |
| Plot type | Count rate plots | Images |
|---|---|---|
| Comparison with Poisson distribution Blue bars denote a histogram of data divided into 1 sec bins. Red curve is a Poisson curve with rate = median count rate of data. |
 |
 |
| Quadrant-wise count rates Data is divided into 100 sec bins |
 |
|
| Module-wise count rates for Quadrant A Data is divided into 100 sec bins |
 |
 |
| Module-wise count rates for Quadrant B Data is divided into 100 sec bins |
 |
 |
| Module-wise count rates for Quadrant C Data is divided into 100 sec bins |
 |
 |
| Module-wise count rates for Quadrant D Data is divided into 100 sec bins |
 |
 |
| Parameter | Plot |
|---|---|
| CZT HV Monitor |  |
| D_VDD |  |
| Temperature 1 |  |
| Veto HV Monitor |  |
| Veto LLD | 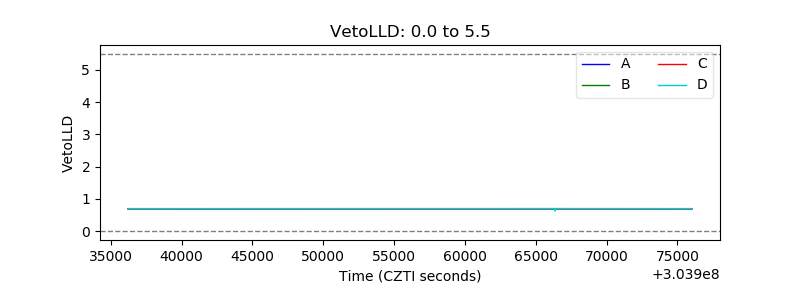 |
| Alpha Counter |  |
| _CPM_Rate |  |
| CZT Counter |  |
| +2.5 Volts monitor |  |
| +5 Volts monitor |  |
| _ROLL_ROT |  |
| _Roll_DEC |  |
| _Roll_RA |  |
| Veto Counter | 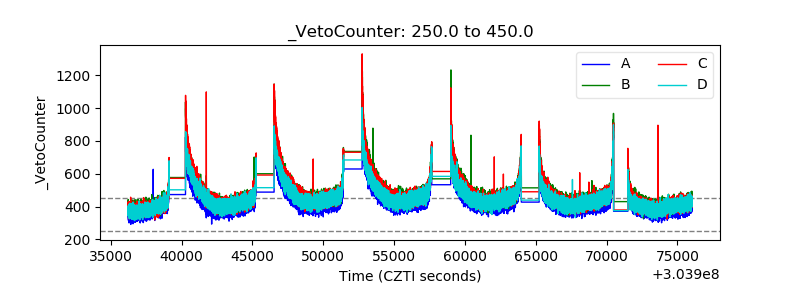 |