| Param | Original file | Final file |
|---|---|---|
| Filename | modeM0/AS1A05_104T04_9000003108_21043cztM0_level2.evt | modeM0/AS1A05_104T04_9000003108_21043cztM0_level2_quad_clean.evt |
| Size (bytes) | 277,228,800 | 62,674,560 |
| Size | 264.4 MB | 59.8 MB |
| Events in quadrant A | 1,984,415 | 408,079 |
| Events in quadrant B | 2,052,475 | 416,754 |
| Events in quadrant C | 2,007,699 | 397,751 |
| Events in quadrant D | 2,070,978 | 385,920 |
| Mode M0 | |||
|---|---|---|---|
| Quadrant | BADHDUFLAG | Total packets | Discarded packets |
| A | 0 | 8650 | 1 |
| B | 0 | 8806 | 1 |
| C | 0 | 8785 | 1 |
| D | 0 | 9015 | 1 |
| Mode M9 | |||
|---|---|---|---|
| Quadrant | BADHDUFLAG | Total packets | Discarded packets |
| A | 0 | 11 | 0 |
| B | 0 | 11 | 0 |
| C | 0 | 11 | 0 |
| D | 0 | 11 | 0 |
| Mode SS | |||
|---|---|---|---|
| Quadrant | BADHDUFLAG | Total packets | Discarded packets |
| A | 0 | 84 | 0 |
| B | 0 | 84 | 0 |
| C | 0 | 84 | 0 |
| D | 0 | 84 | 0 |
| Quadrant | Total seconds | Saturated seconds | Saturation percentage |
|---|---|---|---|
| A | 4104 | 20 | 0.487329% |
| B | 4104 | 37 | 0.901559% |
| C | 4104 | 58 | 1.413255% |
| D | 4104 | 45 | 1.096491% |
Noise dominated data is calculated using 1-second bins in cleaned event files. If a bin has >2000 counts, and if more than 50% of those come from <1% of pixels, then it is considered to be noise-dominated and hence unusable.
| Quadrant | # 1 sec bins | Bins with >0 counts | Bins with >2000 counts | High rate bins dominated by noise | Noise dominated (total time) | Noise dominated (detector-on time) | Marked lightcurve |
|---|---|---|---|---|---|---|---|
| A | 5264 | 4105 | 0 | 0 | 0.00% | 0.00% | 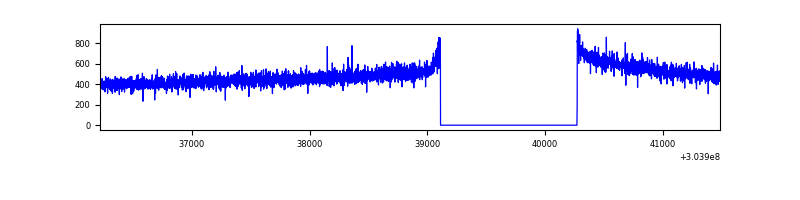 |
| B | 5264 | 4105 | 2 | 2 | 0.04% | 0.05% | 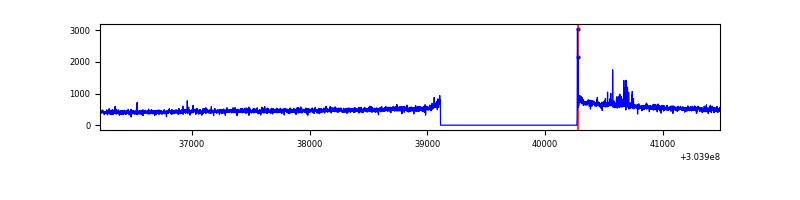 |
| C | 5264 | 4105 | 0 | 0 | 0.00% | 0.00% | 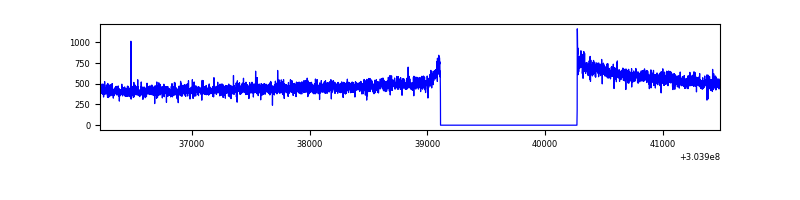 |
| D | 5264 | 4105 | 20 | 20 | 0.38% | 0.49% | 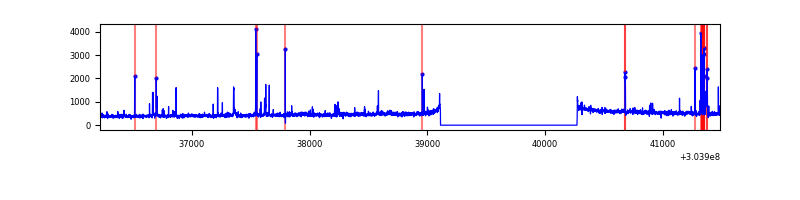 |
Top three noisy pixels from each quadrant. If the there are fewer than three noisy pixels in the level2.evt file, extra rows are filled as -1
| Pixel properties | Quadrant properties | ||||||
|---|---|---|---|---|---|---|---|
| Quadrant | DetID | PixID | Counts | Sigma | Mean | Median | Sigma |
| A | 13 | 254 | 5402 | 46.78 | 515 | 504 | 104.7 |
| A | 0 | 226 | 4348 | 36.71 | 515 | 504 | 104.7 |
| A | 3 | 137 | 4208 | 35.38 | 515 | 504 | 104.7 |
| B | 0 | 197 | 21777 | 215.82 | 514 | 501 | 98.6 |
| B | 12 | 111 | 11670 | 113.3 | 514 | 501 | 98.6 |
| B | 11 | 111 | 10484 | 101.27 | 514 | 501 | 98.6 |
| C | 14 | 238 | 78190 | 667.45 | 494 | 496 | 116.4 |
| C | 13 | 61 | 3487 | 25.7 | 494 | 496 | 116.4 |
| C | 12 | 2 | 1541 | 8.98 | 494 | 496 | 116.4 |
| D | 1 | 52 | 109689 | 903.08 | 498 | 484 | 120.9 |
| D | 2 | 14 | 47993 | 392.88 | 498 | 484 | 120.9 |
| D | 13 | 172 | 18029 | 145.09 | 498 | 484 | 120.9 |
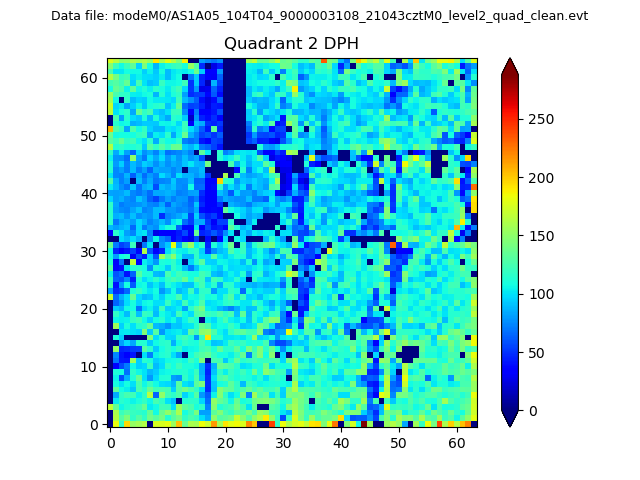
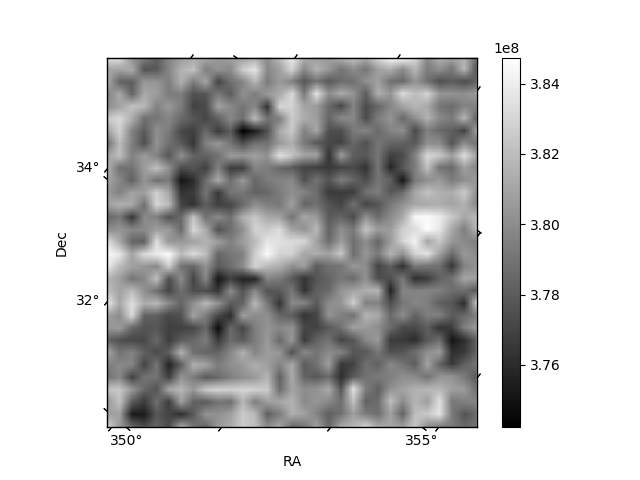
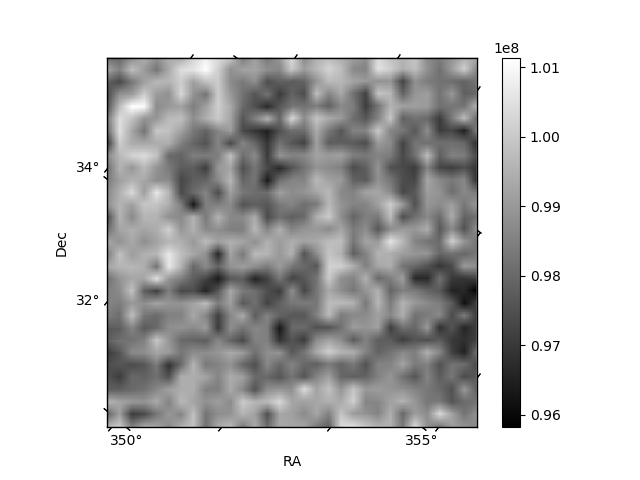
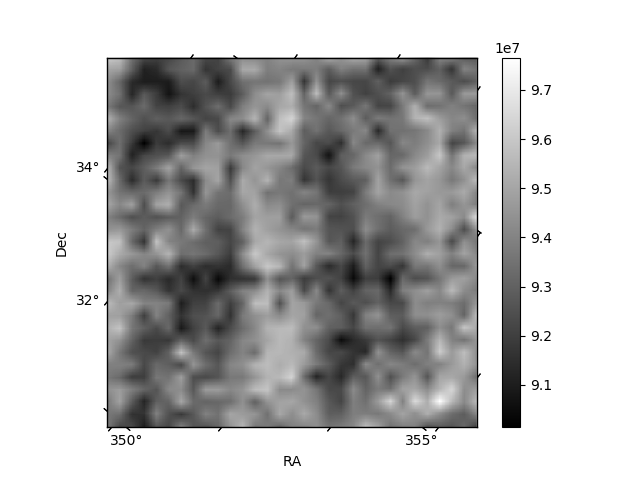
Histogram calculated using DETX and DETY for each event in the final _common_clean file
| Quadrant A | 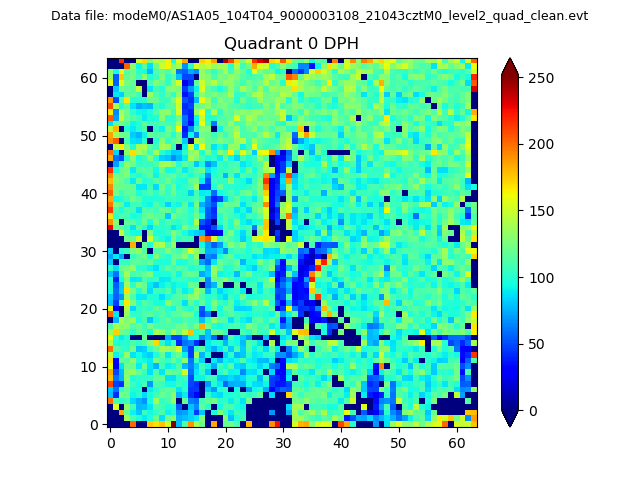 |
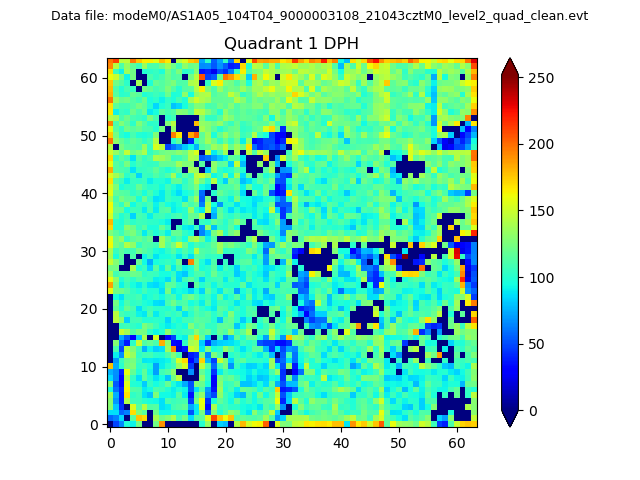 |
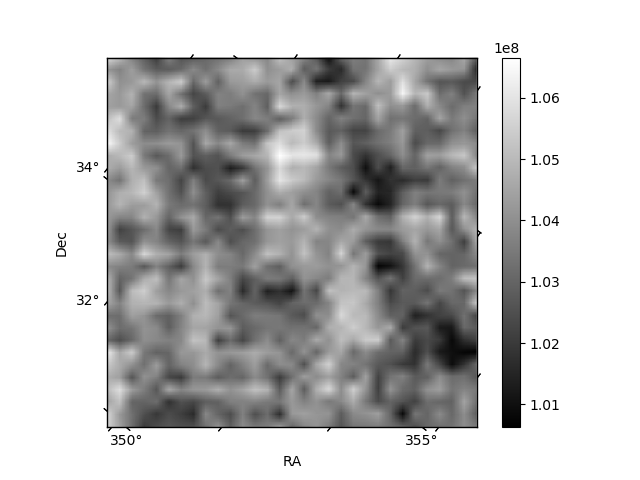
Quadrant B |
|---|---|---|---|
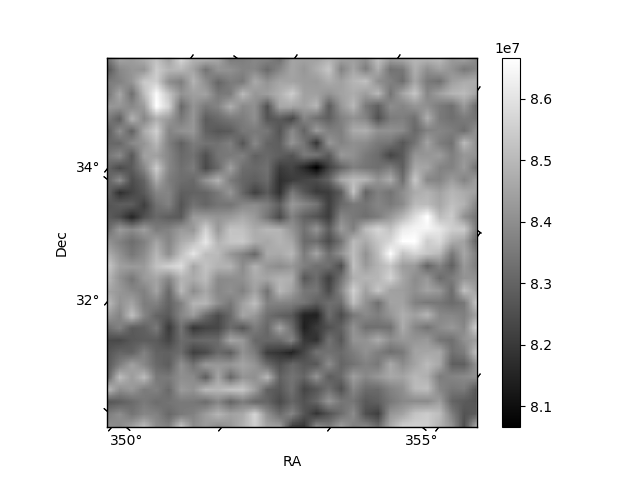
| Quadrant D | 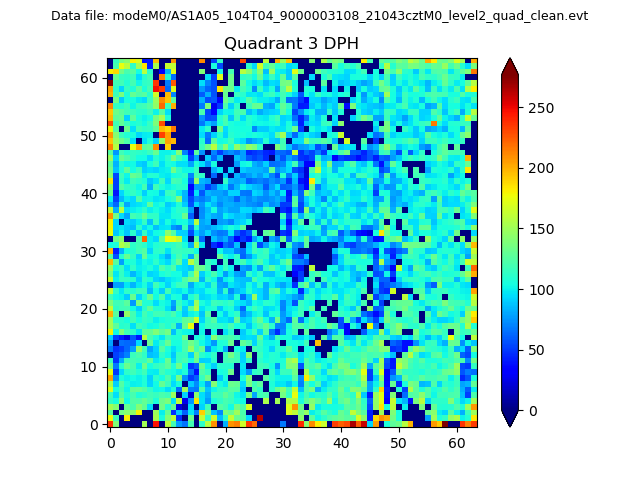 |
 |
Quadrant C |
| Plot type | Count rate plots | Images |
|---|---|---|
| Comparison with Poisson distribution Blue bars denote a histogram of data divided into 1 sec bins. Red curve is a Poisson curve with rate = median count rate of data. |
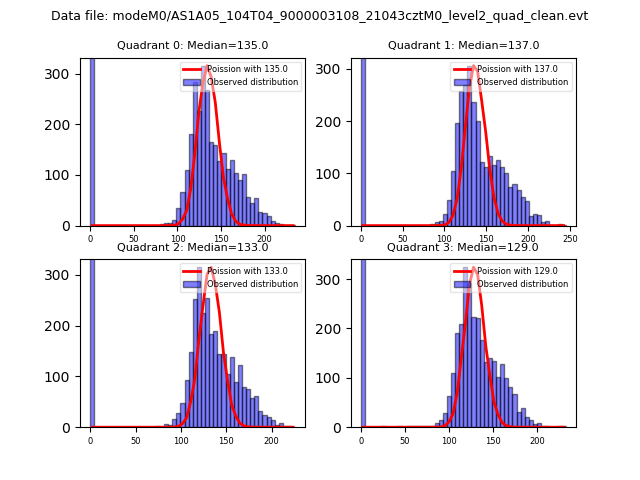 |
 |
| Quadrant-wise count rates Data is divided into 100 sec bins |
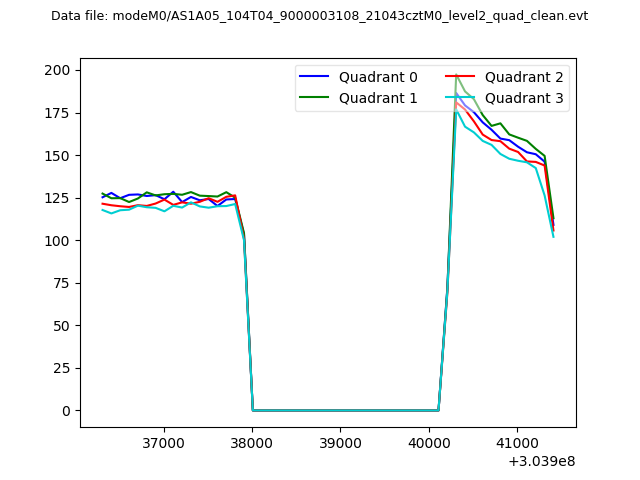 |
|
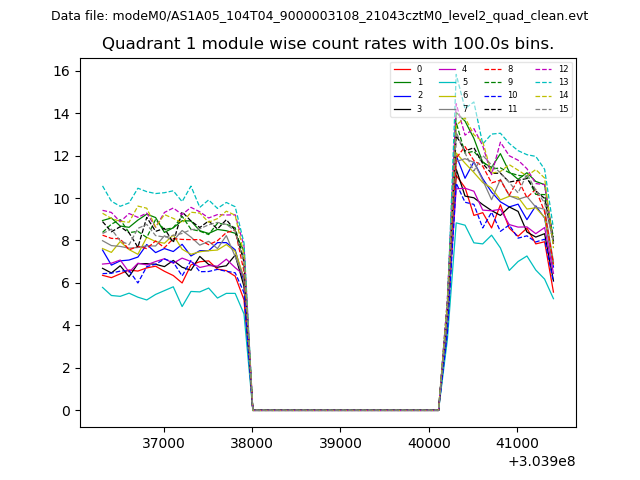
| Module-wise count rates for Quadrant A Data is divided into 100 sec bins |
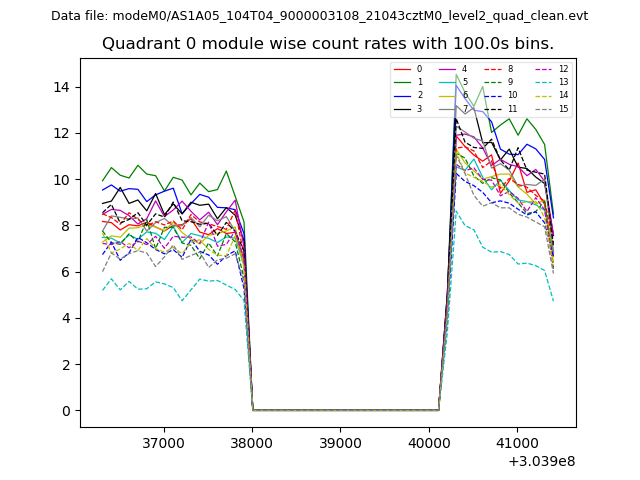 |
 |
| Module-wise count rates for Quadrant B Data is divided into 100 sec bins |
 |
 |
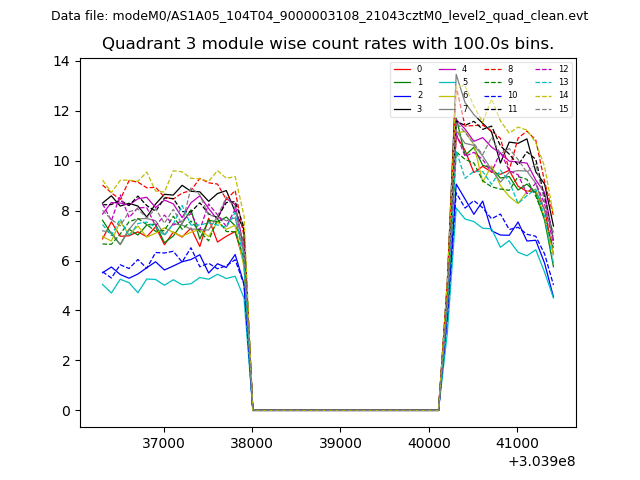
| Module-wise count rates for Quadrant C Data is divided into 100 sec bins |
 |
 |
| Module-wise count rates for Quadrant D Data is divided into 100 sec bins |
 |
 |
| Parameter | Plot |
|---|---|
| CZT HV Monitor | 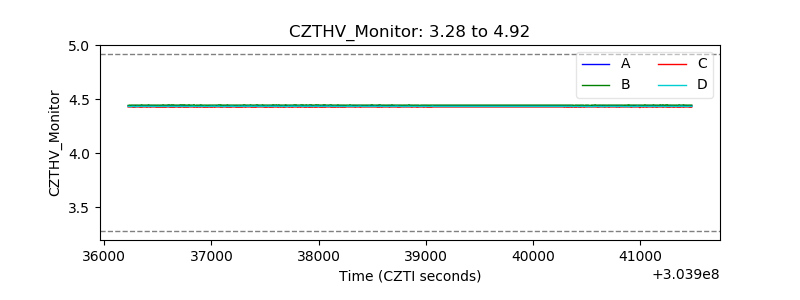 |
| D_VDD |  |
| Temperature 1 | 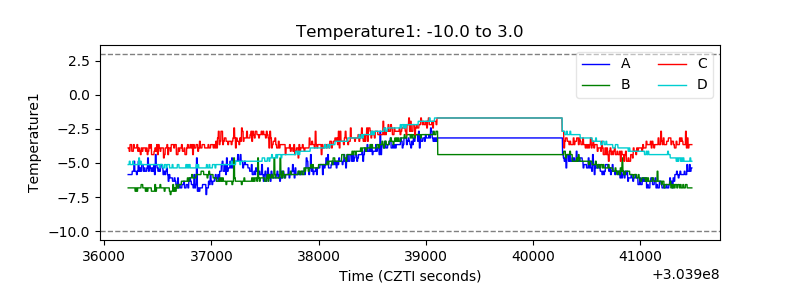 |
| Veto HV Monitor | 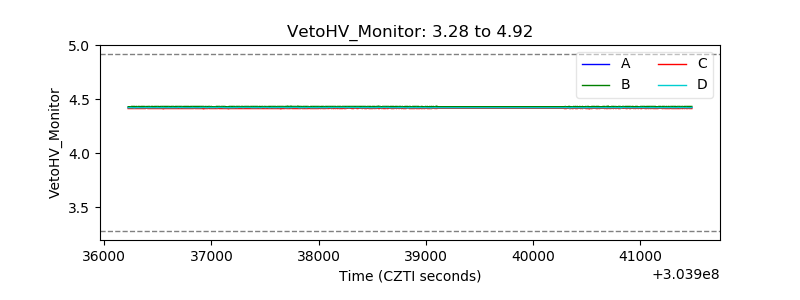 |
| Veto LLD |  |
| Alpha Counter | 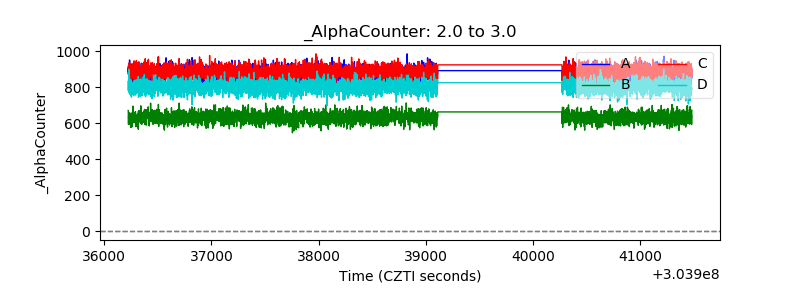 |
| _CPM_Rate | 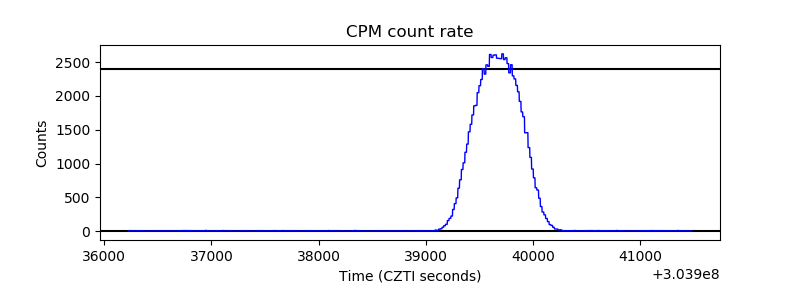 |
| CZT Counter | 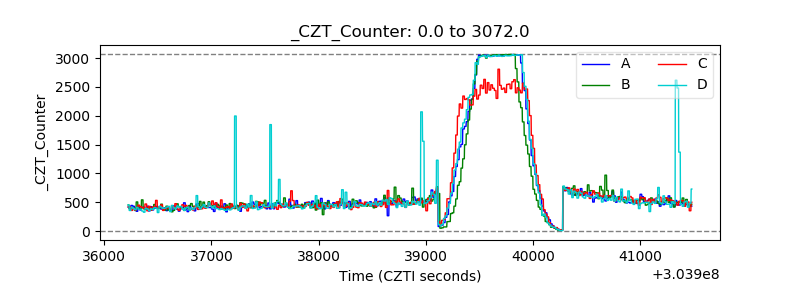 |
| +2.5 Volts monitor |  |
| +5 Volts monitor |  |
| _ROLL_ROT | 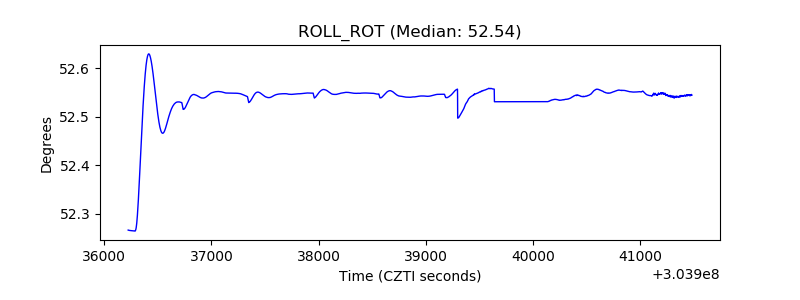 |
| _Roll_DEC | 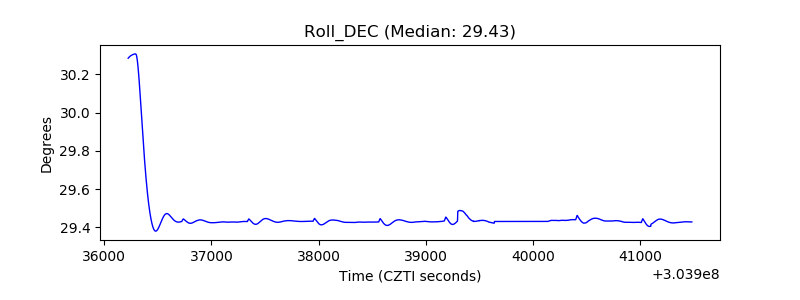 |
| _Roll_RA | 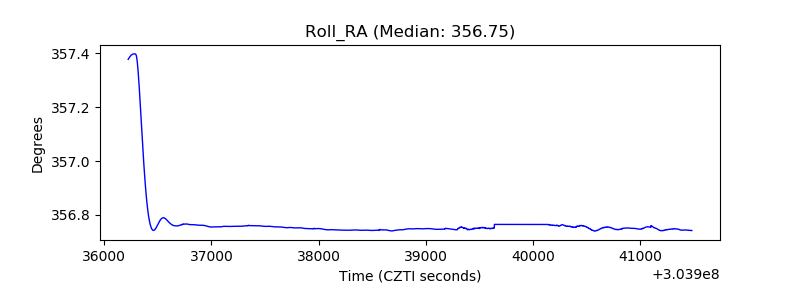 |
| Veto Counter |  |