| Param | Original file | Final file |
|---|---|---|
| Filename | modeM0/AS1A05_104T04_9000003108_21045cztM0_level2.evt | modeM0/AS1A05_104T04_9000003108_21045cztM0_level2_quad_clean.evt |
| Size (bytes) | 445,700,160 | 103,305,600 |
| Size | 425.1 MB | 98.5 MB |
| Events in quadrant A | 3,100,263 | 681,169 |
| Events in quadrant B | 3,632,811 | 705,923 |
| Events in quadrant C | 3,218,634 | 667,549 |
| Events in quadrant D | 3,127,610 | 643,737 |
| Mode M0 | |||
|---|---|---|---|
| Quadrant | BADHDUFLAG | Total packets | Discarded packets |
| A | 0 | 13103 | 2 |
| B | 0 | 14735 | 2 |
| C | 0 | 13399 | 2 |
| D | 0 | 13393 | 8 |
| Mode M9 | |||
|---|---|---|---|
| Quadrant | BADHDUFLAG | Total packets | Discarded packets |
| A | 0 | 18 | 0 |
| B | 0 | 19 | 0 |
| C | 0 | 19 | 0 |
| D | 0 | 19 | 0 |
| Mode SS | |||
|---|---|---|---|
| Quadrant | BADHDUFLAG | Total packets | Discarded packets |
| A | 0 | 126 | 0 |
| B | 0 | 126 | 0 |
| C | 0 | 126 | 0 |
| D | 0 | 126 | 0 |
| Quadrant | Total seconds | Saturated seconds | Saturation percentage |
|---|---|---|---|
| A | 6162 | 20 | 0.324570% |
| B | 6162 | 46 | 0.746511% |
| C | 6162 | 73 | 1.184680% |
| D | 6161 | 40 | 0.649245% |
Noise dominated data is calculated using 1-second bins in cleaned event files. If a bin has >2000 counts, and if more than 50% of those come from <1% of pixels, then it is considered to be noise-dominated and hence unusable.
| Quadrant | # 1 sec bins | Bins with >0 counts | Bins with >2000 counts | High rate bins dominated by noise | Noise dominated (total time) | Noise dominated (detector-on time) | Marked lightcurve |
|---|---|---|---|---|---|---|---|
| A | 7472 | 6163 | 0 | 0 | 0.00% | 0.00% | 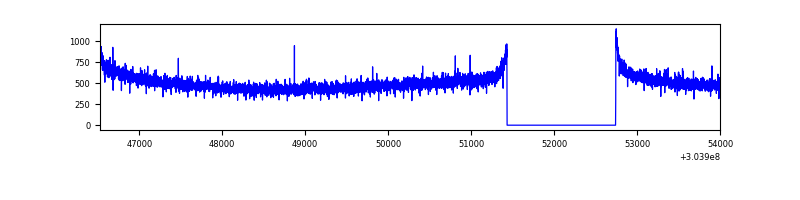 |
| B | 7472 | 6163 | 0 | 0 | 0.00% | 0.00% | 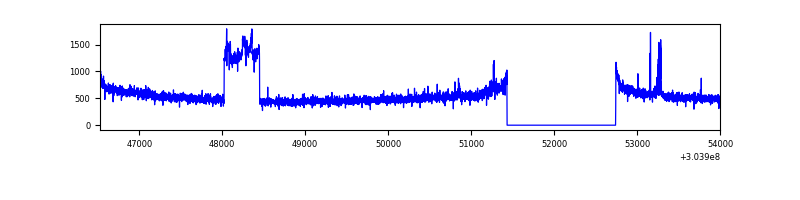 |
| C | 7472 | 6163 | 4 | 4 | 0.05% | 0.06% | 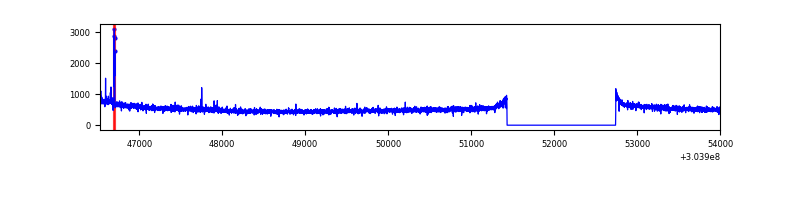 |
| D | 7471 | 6162 | 18 | 18 | 0.24% | 0.29% | 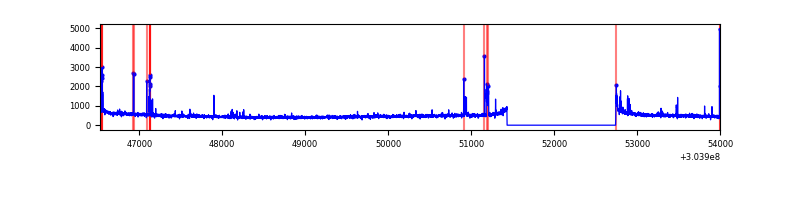 |
Top three noisy pixels from each quadrant. If the there are fewer than three noisy pixels in the level2.evt file, extra rows are filled as -1
| Pixel properties | Quadrant properties | ||||||
|---|---|---|---|---|---|---|---|
| Quadrant | DetID | PixID | Counts | Sigma | Mean | Median | Sigma |
| A | 13 | 254 | 7966 | 44.81 | 804 | 789 | 160.2 |
| A | 0 | 226 | 6819 | 37.65 | 804 | 789 | 160.2 |
| A | 3 | 137 | 6218 | 33.89 | 804 | 789 | 160.2 |
| B | 7 | 205 | 396838 | 2632.28 | 811 | 792 | 150.5 |
| B | 0 | 230 | 55334 | 362.51 | 811 | 792 | 150.5 |
| B | 12 | 111 | 17836 | 113.28 | 811 | 792 | 150.5 |
| C | 14 | 238 | 122801 | 668.15 | 784 | 789 | 182.6 |
| C | 3 | 9 | 33550 | 179.4 | 784 | 789 | 182.6 |
| C | 9 | 54 | 6133 | 29.26 | 784 | 789 | 182.6 |
| D | 1 | 52 | 65031 | 339.32 | 781 | 760 | 189.4 |
| D | 13 | 172 | 51182 | 266.2 | 781 | 760 | 189.4 |
| D | 9 | 1 | 44362 | 230.2 | 781 | 760 | 189.4 |
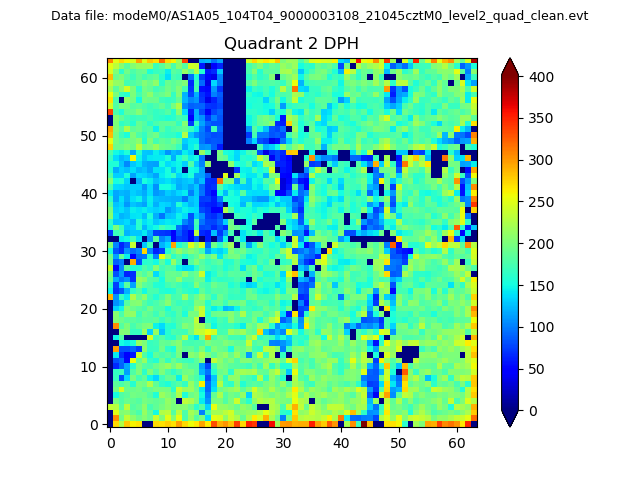
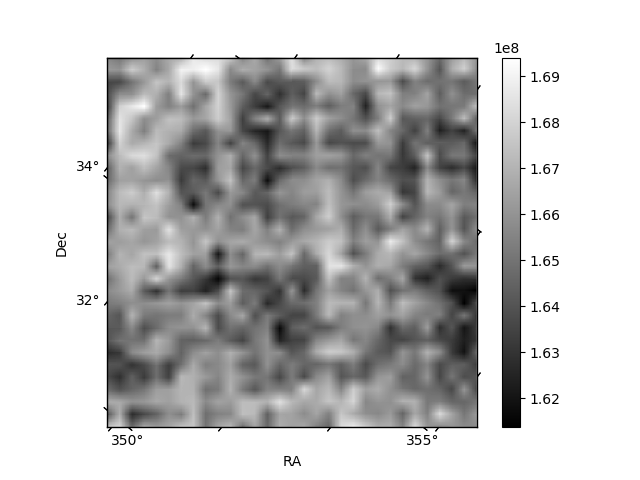
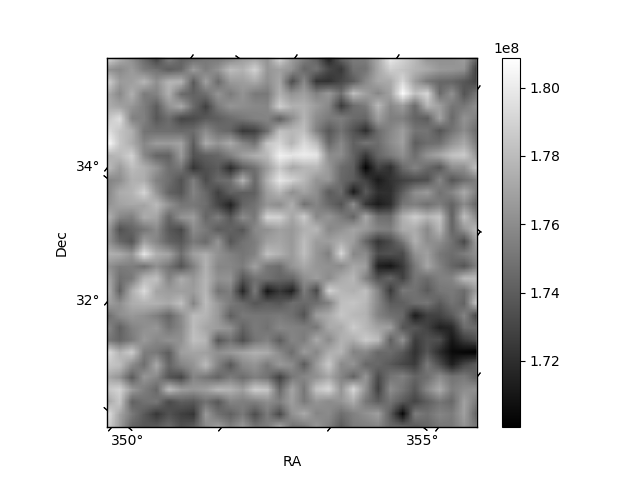
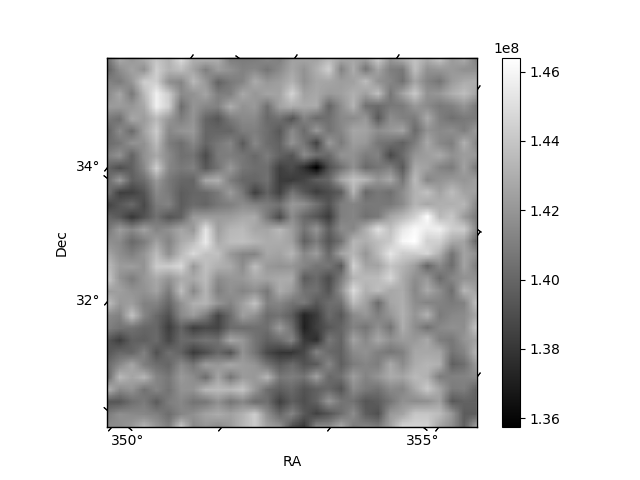
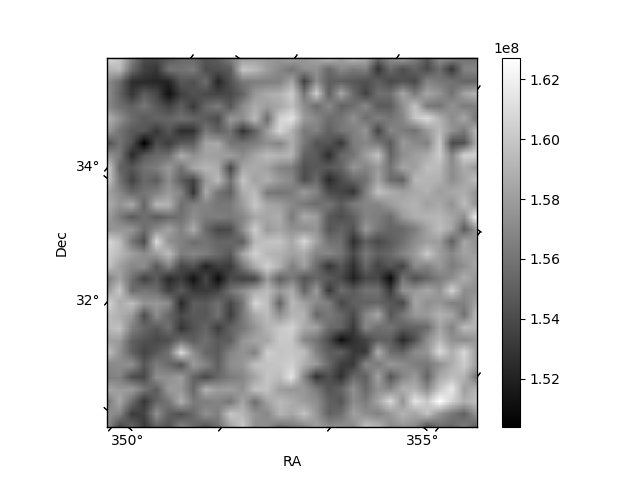
Histogram calculated using DETX and DETY for each event in the final _common_clean file
| Quadrant A | 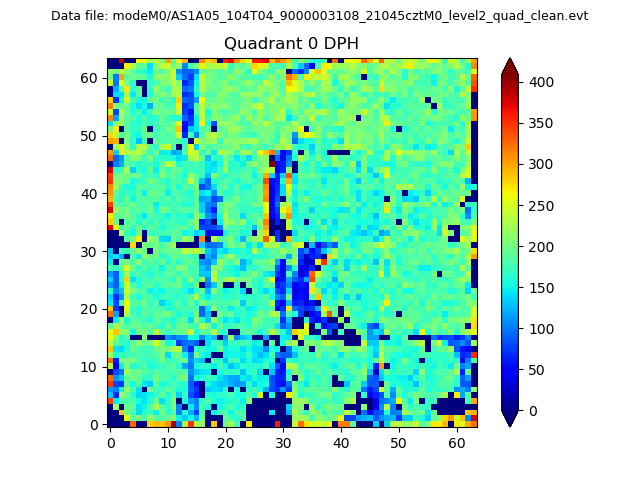 |
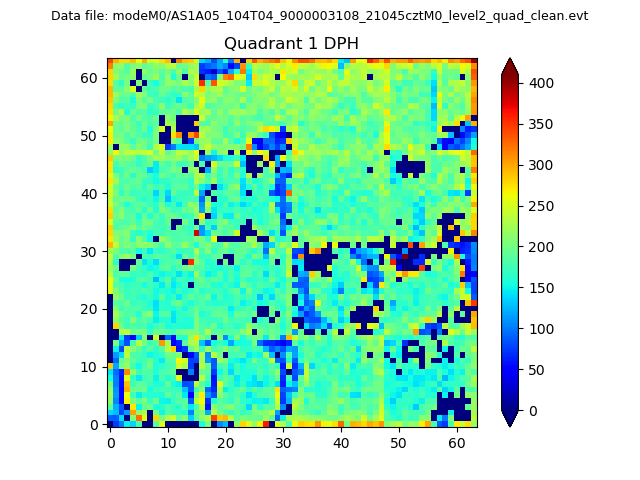 |
Quadrant B |
|---|---|---|---|
| Quadrant D | 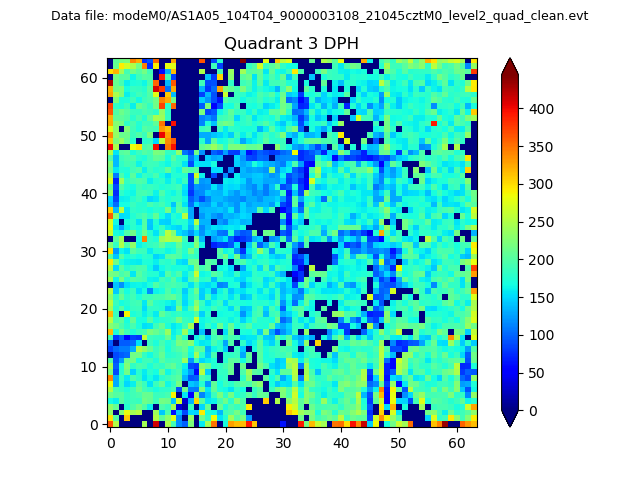 |
 |
Quadrant C |
| Plot type | Count rate plots | Images |
|---|---|---|
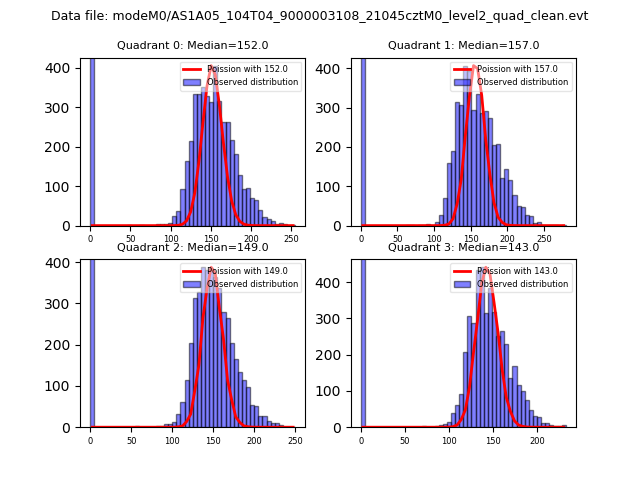
| Comparison with Poisson distribution Blue bars denote a histogram of data divided into 1 sec bins. Red curve is a Poisson curve with rate = median count rate of data. |
 |
 |
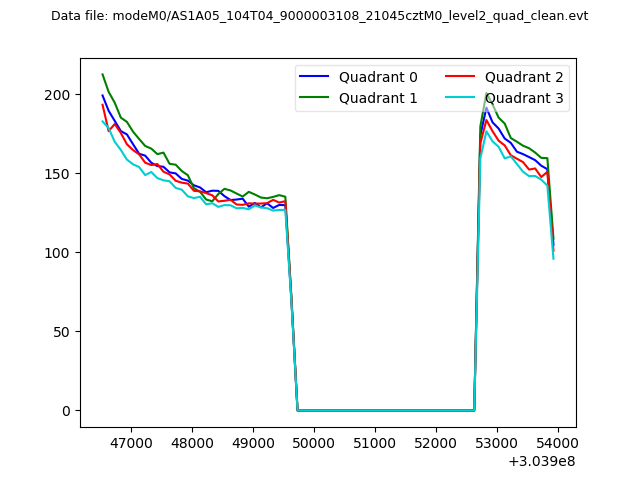
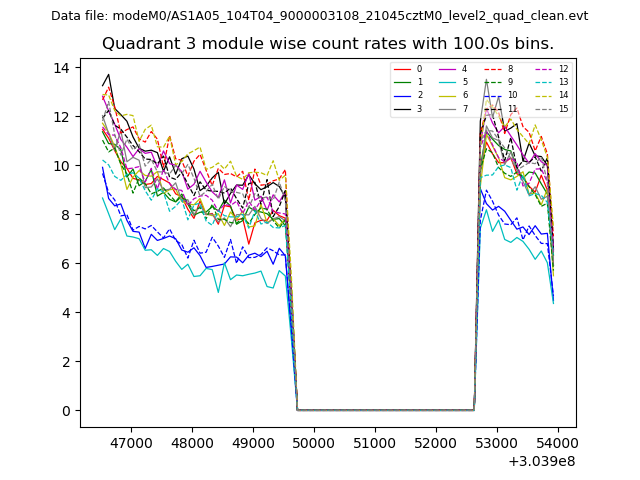
| Quadrant-wise count rates Data is divided into 100 sec bins |
 |
|
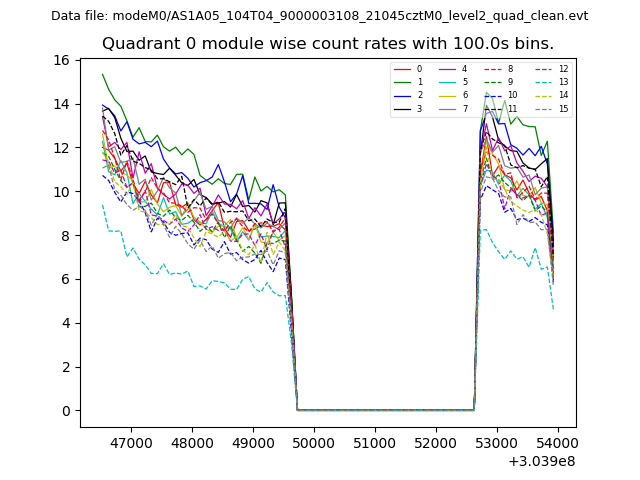
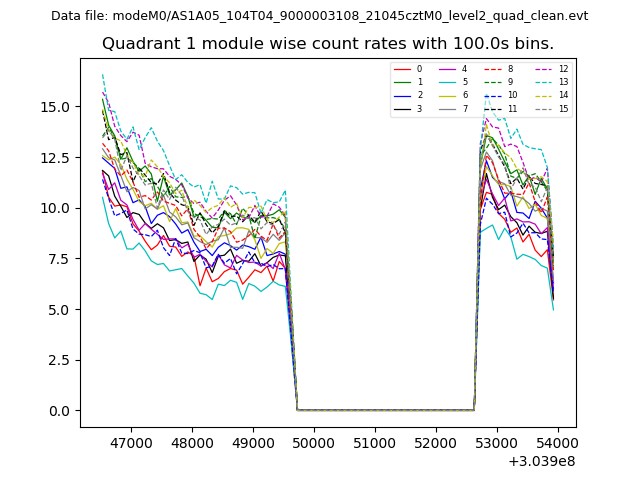
| Module-wise count rates for Quadrant A Data is divided into 100 sec bins |
 |
 |
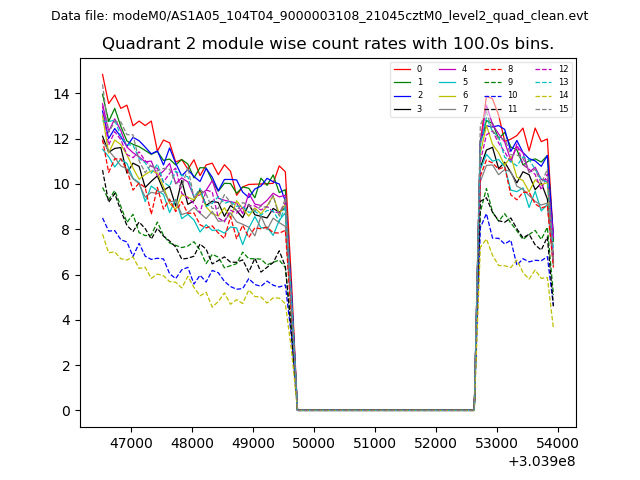
| Module-wise count rates for Quadrant B Data is divided into 100 sec bins |
 |
 |
| Module-wise count rates for Quadrant C Data is divided into 100 sec bins |
 |
 |
| Module-wise count rates for Quadrant D Data is divided into 100 sec bins |
 |
 |
| Parameter | Plot |
|---|---|
| CZT HV Monitor | 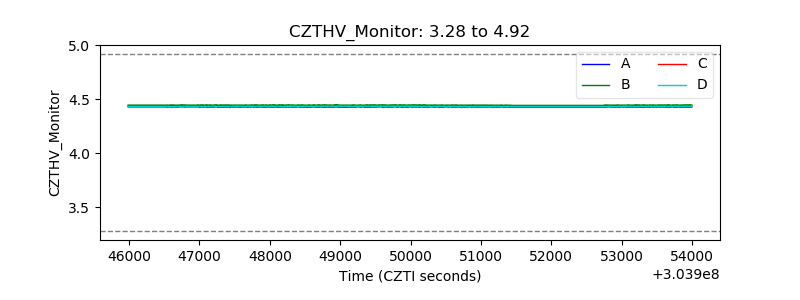 |
| D_VDD | 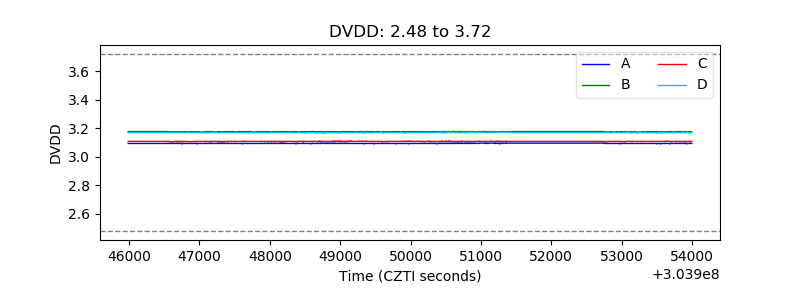 |
| Temperature 1 | 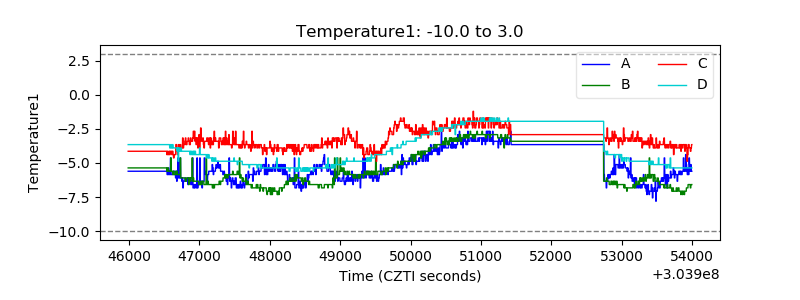 |
| Veto HV Monitor | 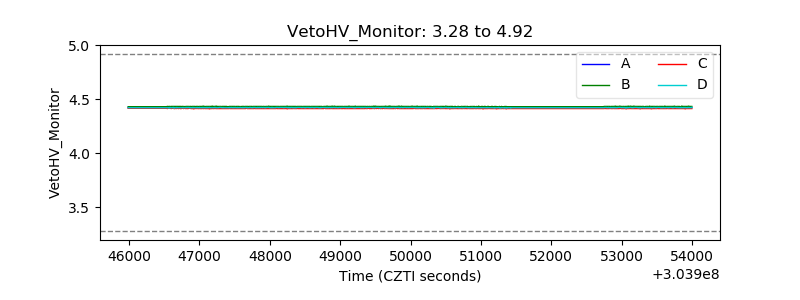 |
| Veto LLD |  |
| Alpha Counter | 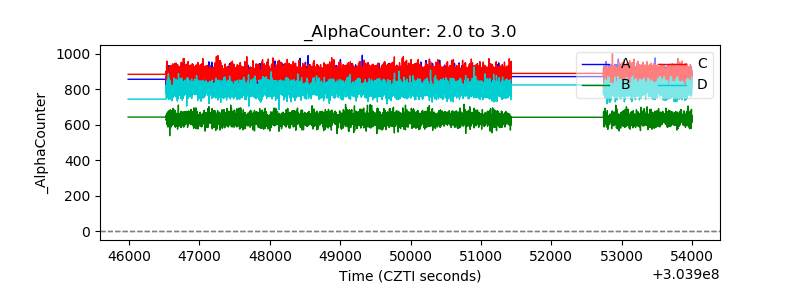 |
| _CPM_Rate | 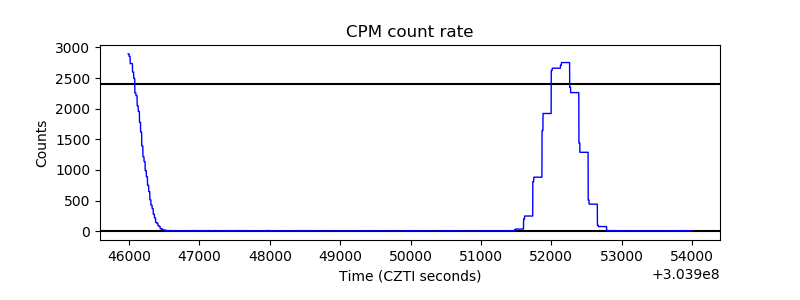 |
| CZT Counter | 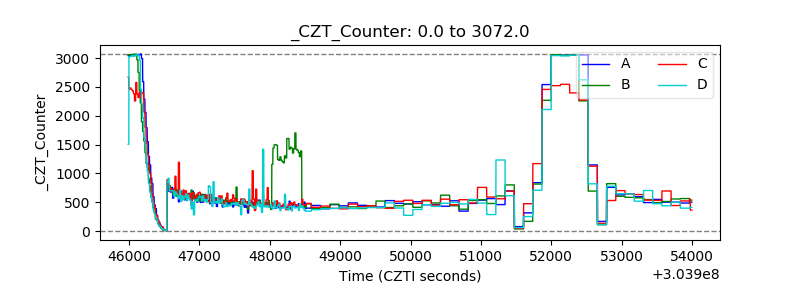 |
| +2.5 Volts monitor |  |
| +5 Volts monitor |  |
| _ROLL_ROT | 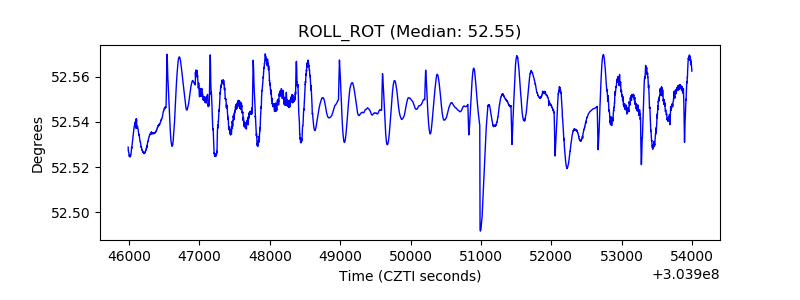 |
| _Roll_DEC | 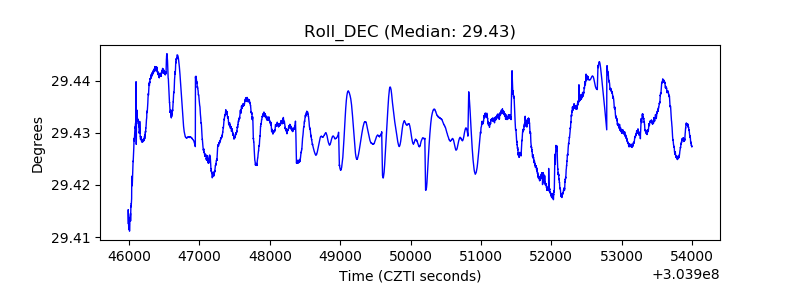 |
| _Roll_RA | 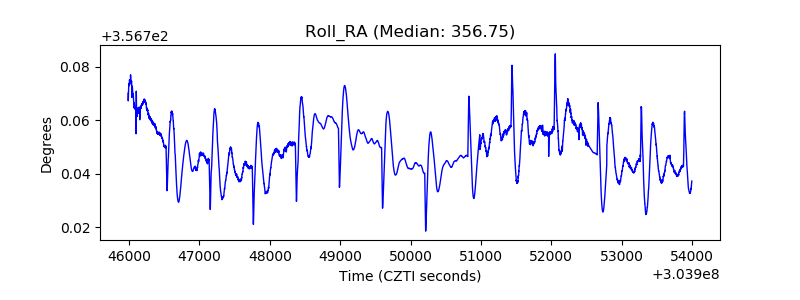 |
| Veto Counter |  |