| Param | Original file | Final file |
|---|---|---|
| Filename | modeM0/AS1A05_104T04_9000003108_21046cztM0_level2.evt | modeM0/AS1A05_104T04_9000003108_21046cztM0_level2_quad_clean.evt |
| Size (bytes) | 445,944,960 | 93,746,880 |
| Size | 425.3 MB | 89.4 MB |
| Events in quadrant A | 3,148,734 | 610,491 |
| Events in quadrant B | 3,287,265 | 631,898 |
| Events in quadrant C | 3,224,195 | 591,611 |
| Events in quadrant D | 3,424,648 | 572,787 |
| Mode M0 | |||
|---|---|---|---|
| Quadrant | BADHDUFLAG | Total packets | Discarded packets |
| A | 0 | 13199 | 2 |
| B | 0 | 13600 | 2 |
| C | 0 | 13398 | 2 |
| D | 0 | 14321 | 2 |
| Mode M9 | |||
|---|---|---|---|
| Quadrant | BADHDUFLAG | Total packets | Discarded packets |
| A | 0 | 27 | 0 |
| B | 0 | 27 | 0 |
| C | 0 | 27 | 0 |
| D | 0 | 27 | 0 |
| Mode SS | |||
|---|---|---|---|
| Quadrant | BADHDUFLAG | Total packets | Discarded packets |
| A | 0 | 126 | 0 |
| B | 0 | 126 | 0 |
| C | 0 | 126 | 0 |
| D | 0 | 126 | 0 |
| Quadrant | Total seconds | Saturated seconds | Saturation percentage |
|---|---|---|---|
| A | 6199 | 39 | 0.629134% |
| B | 6199 | 82 | 1.322794% |
| C | 6200 | 100 | 1.612903% |
| D | 6199 | 109 | 1.758348% |
Noise dominated data is calculated using 1-second bins in cleaned event files. If a bin has >2000 counts, and if more than 50% of those come from <1% of pixels, then it is considered to be noise-dominated and hence unusable.
| Quadrant | # 1 sec bins | Bins with >0 counts | Bins with >2000 counts | High rate bins dominated by noise | Noise dominated (total time) | Noise dominated (detector-on time) | Marked lightcurve |
|---|---|---|---|---|---|---|---|
| A | 8849 | 6201 | 0 | 0 | 0.00% | 0.00% | 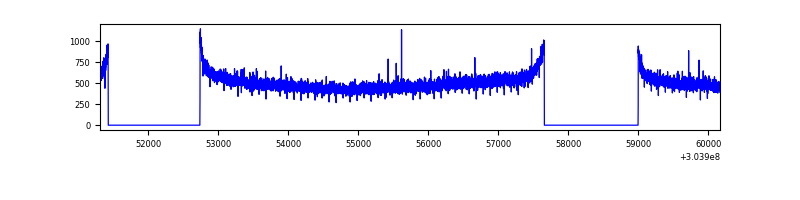 |
| B | 8849 | 6201 | 0 | 0 | 0.00% | 0.00% | 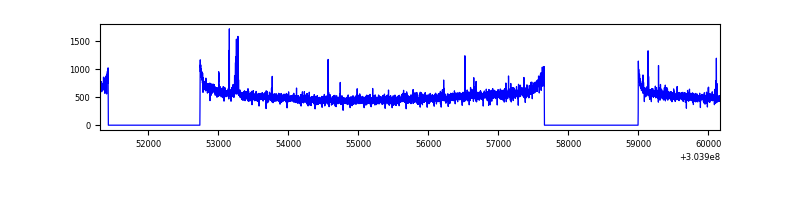 |
| C | 8850 | 6202 | 0 | 0 | 0.00% | 0.00% | 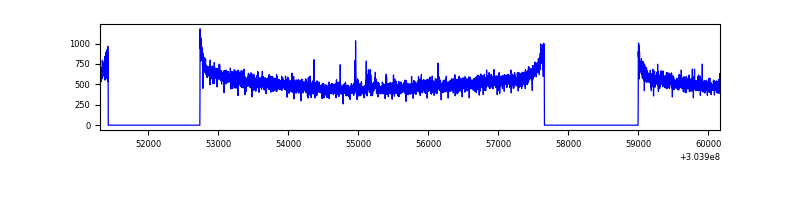 |
| D | 8849 | 6201 | 73 | 73 | 0.82% | 1.18% | 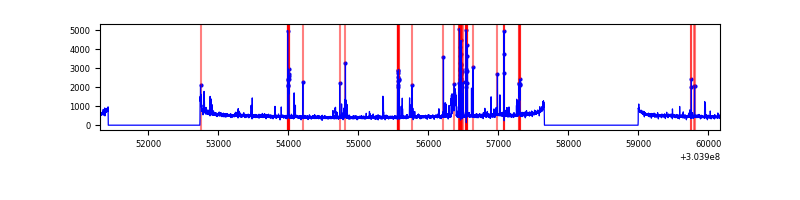 |
Top three noisy pixels from each quadrant. If the there are fewer than three noisy pixels in the level2.evt file, extra rows are filled as -1
| Pixel properties | Quadrant properties | ||||||
|---|---|---|---|---|---|---|---|
| Quadrant | DetID | PixID | Counts | Sigma | Mean | Median | Sigma |
| A | 13 | 254 | 7586 | 41.39 | 818 | 803 | 163.9 |
| A | 0 | 226 | 6871 | 37.02 | 818 | 803 | 163.9 |
| A | 3 | 137 | 6403 | 34.17 | 818 | 803 | 163.9 |
| B | 0 | 230 | 53079 | 342.18 | 822 | 804 | 152.8 |
| B | 12 | 111 | 18289 | 114.45 | 822 | 804 | 152.8 |
| B | 11 | 111 | 15836 | 98.4 | 822 | 804 | 152.8 |
| C | 14 | 238 | 124600 | 674.71 | 788 | 792 | 183.5 |
| C | 9 | 54 | 28527 | 151.15 | 788 | 792 | 183.5 |
| C | 13 | 61 | 5552 | 25.94 | 788 | 792 | 183.5 |
| D | 1 | 52 | 253539 | 1333.35 | 783 | 759 | 189.6 |
| D | 2 | 14 | 79112 | 413.29 | 783 | 759 | 189.6 |
| D | 13 | 172 | 72511 | 378.47 | 783 | 759 | 189.6 |
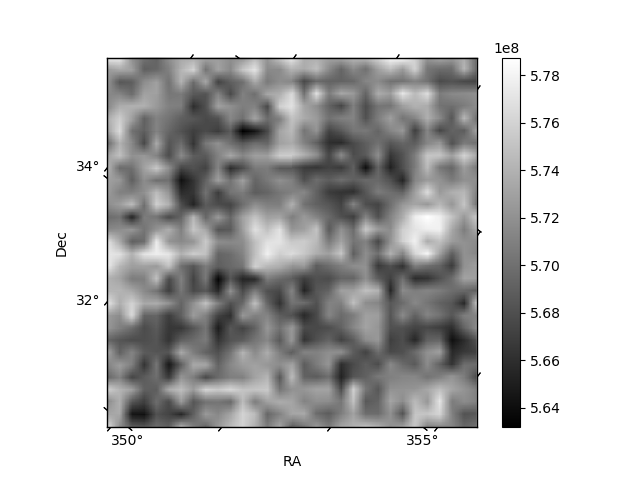
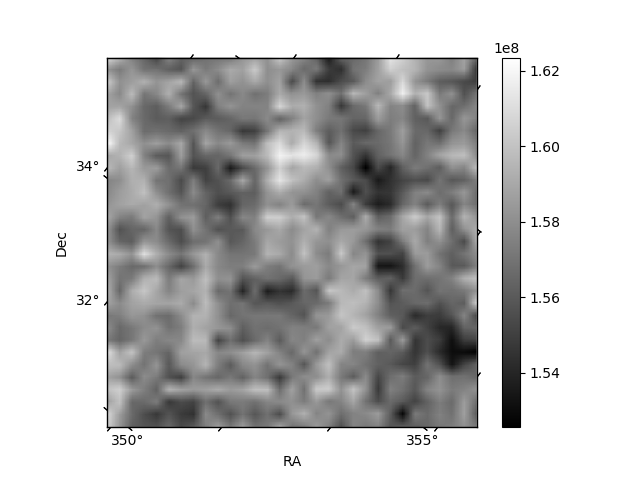
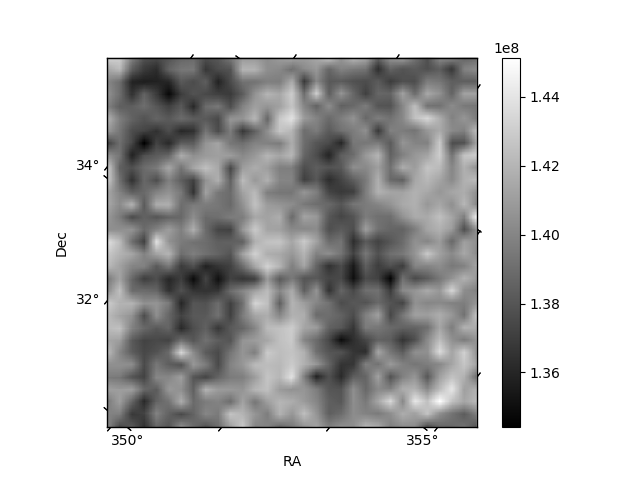
Histogram calculated using DETX and DETY for each event in the final _common_clean file
| Quadrant A | 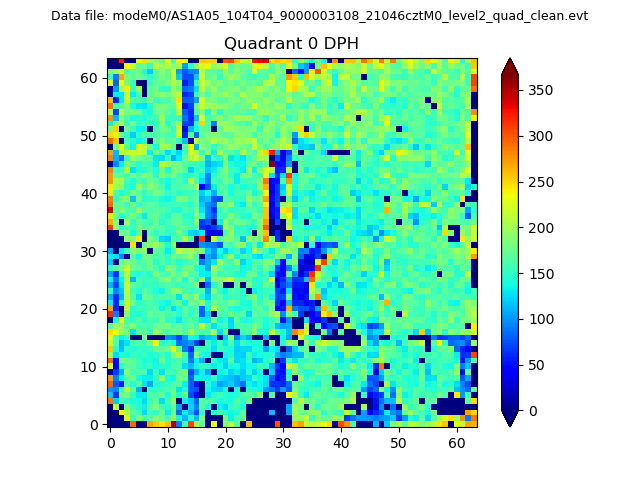 |
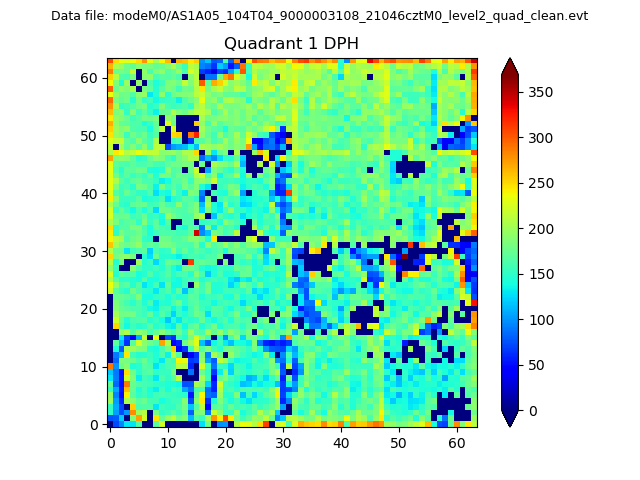 |
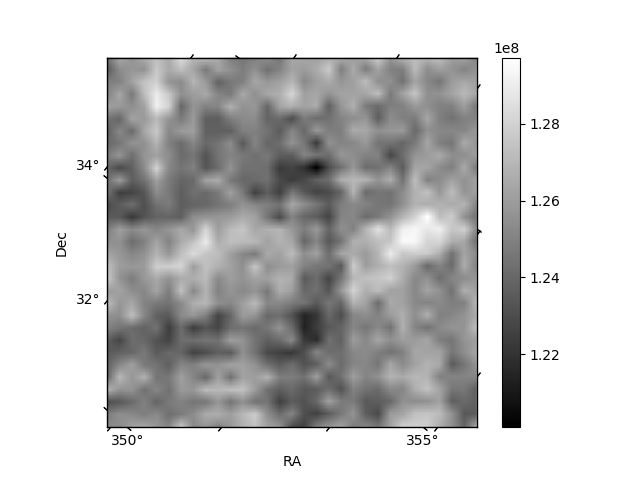
Quadrant B |
|---|---|---|---|
| Quadrant D | 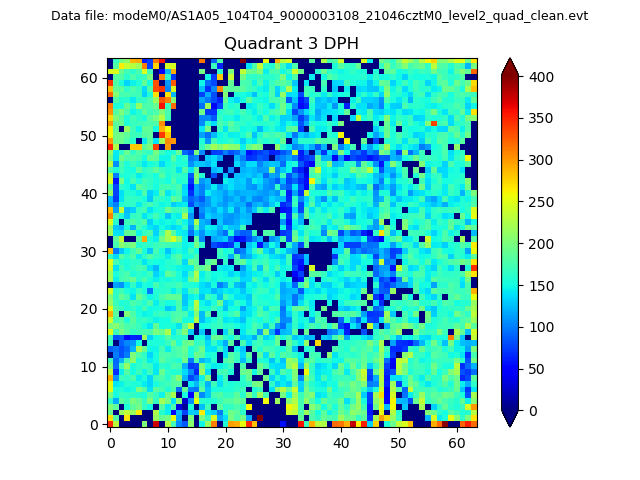 |
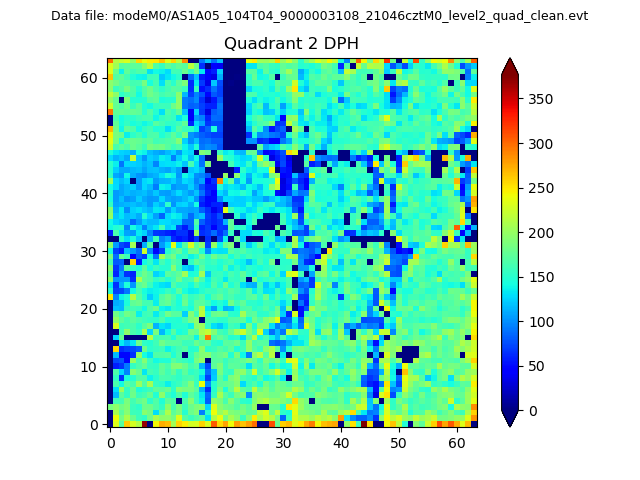 |
Quadrant C |
| Plot type | Count rate plots | Images |
|---|---|---|
| Comparison with Poisson distribution Blue bars denote a histogram of data divided into 1 sec bins. Red curve is a Poisson curve with rate = median count rate of data. |
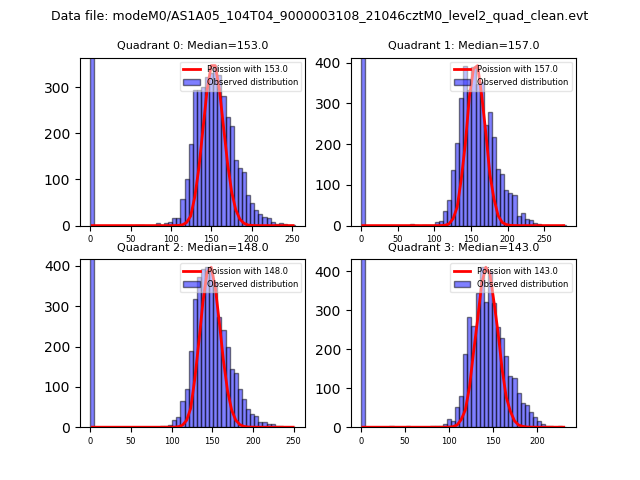 |
 |
| Quadrant-wise count rates Data is divided into 100 sec bins |
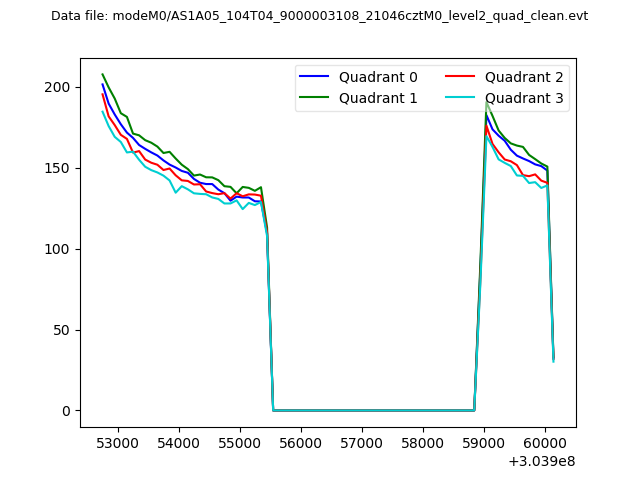 |
|
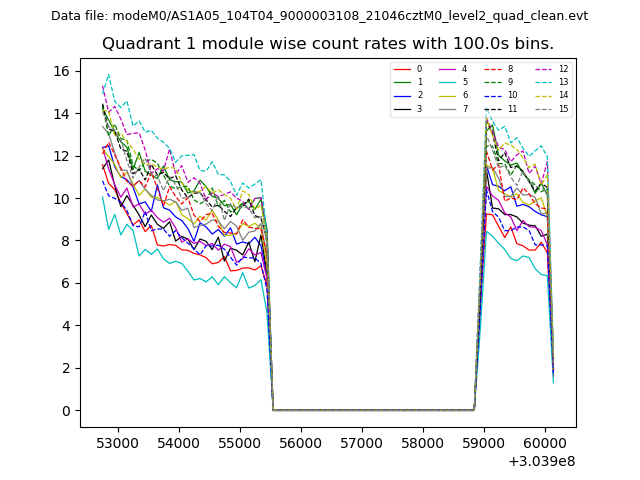
| Module-wise count rates for Quadrant A Data is divided into 100 sec bins |
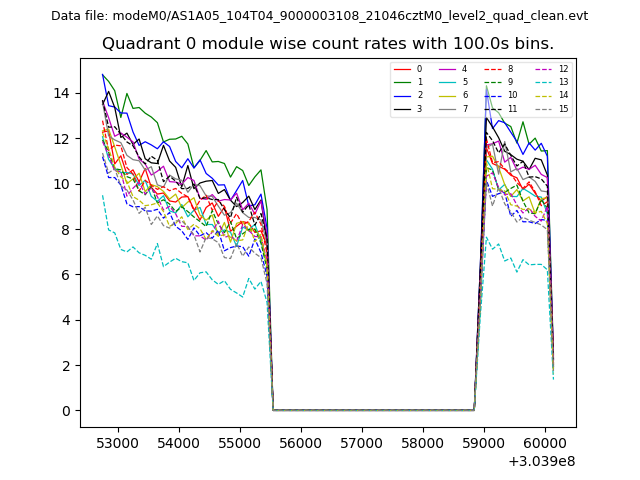 |
 |
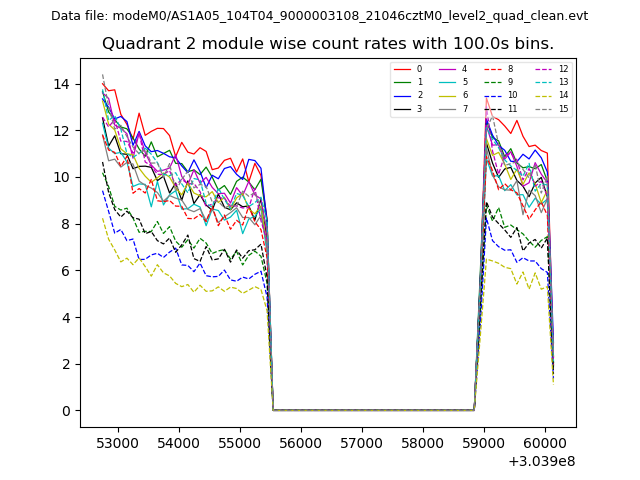
| Module-wise count rates for Quadrant B Data is divided into 100 sec bins |
 |
 |
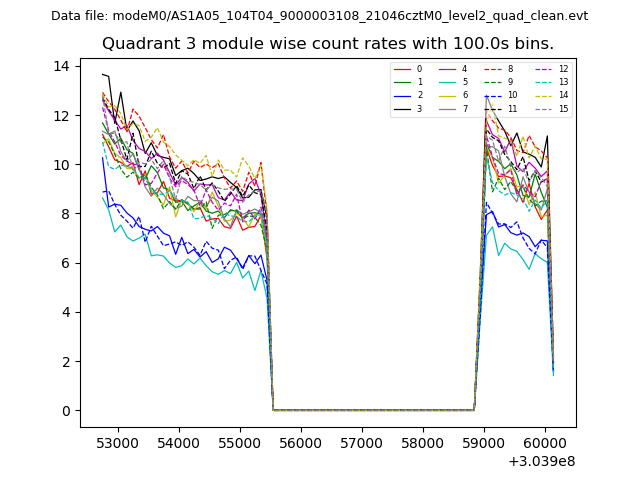
| Module-wise count rates for Quadrant C Data is divided into 100 sec bins |
 |
 |
| Module-wise count rates for Quadrant D Data is divided into 100 sec bins |
 |
 |
| Parameter | Plot |
|---|---|
| CZT HV Monitor | 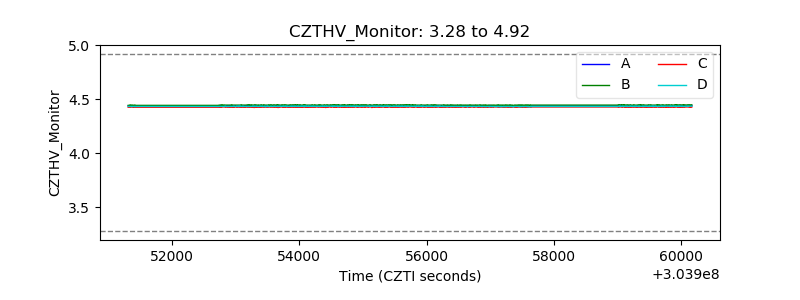 |
| D_VDD | 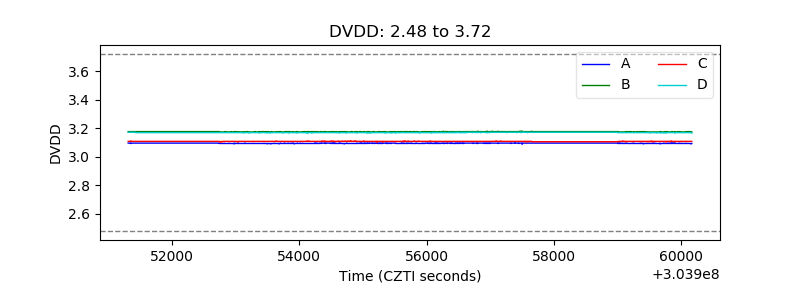 |
| Temperature 1 | 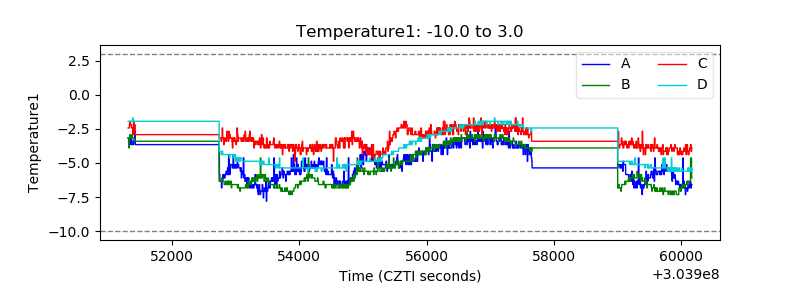 |
| Veto HV Monitor | 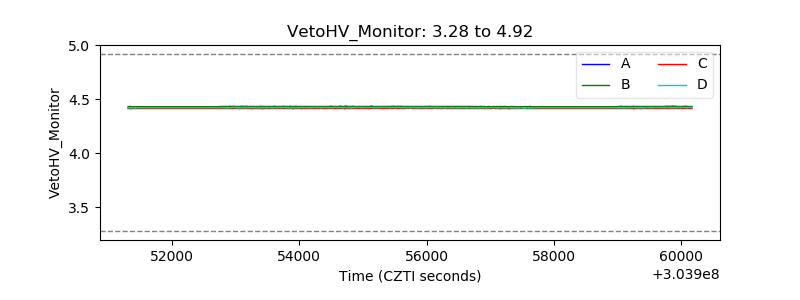 |
| Veto LLD | 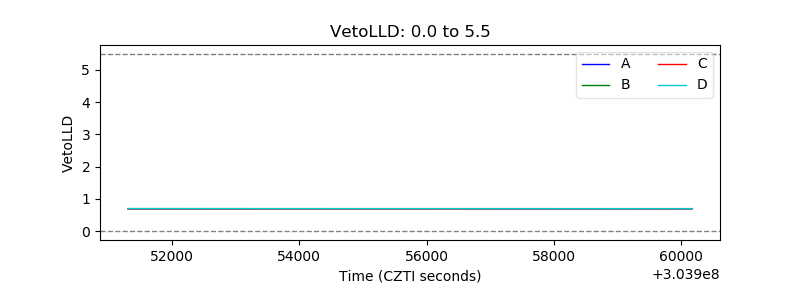 |
| Alpha Counter | 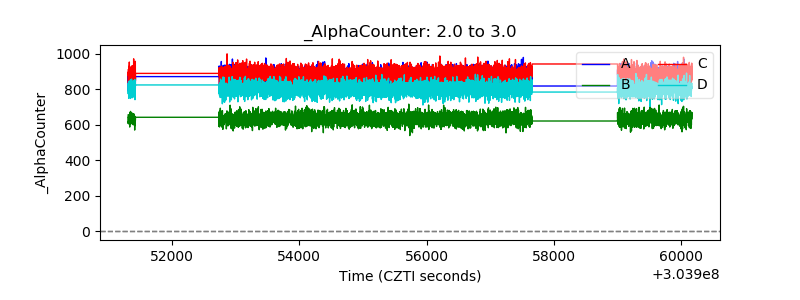 |
| _CPM_Rate | 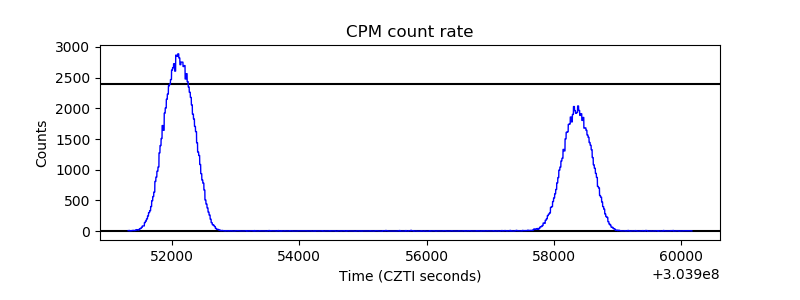 |
| CZT Counter |  |
| +2.5 Volts monitor |  |
| +5 Volts monitor |  |
| _ROLL_ROT | 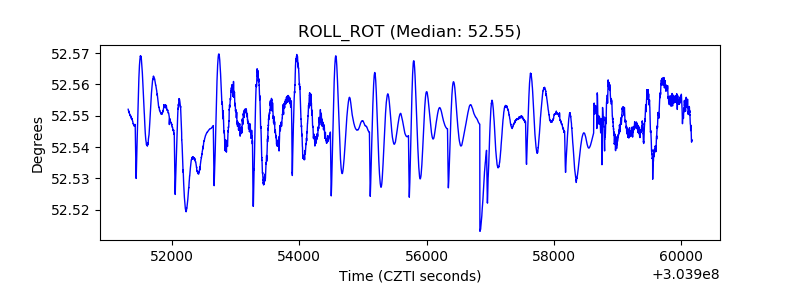 |
| _Roll_DEC | 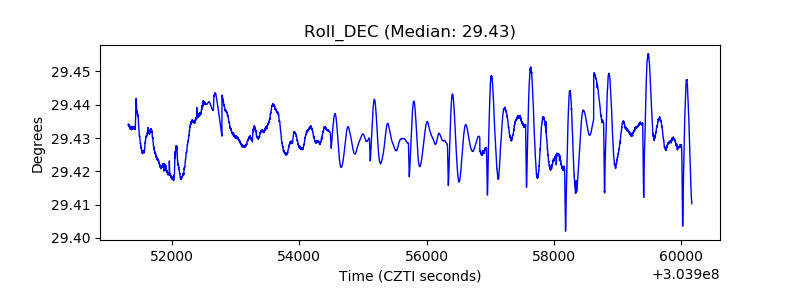 |
| _Roll_RA | 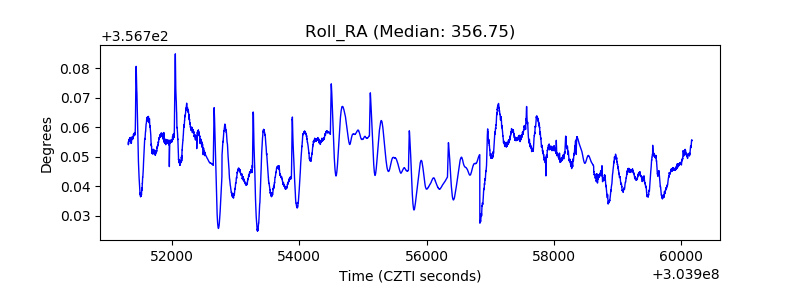 |
| Veto Counter | 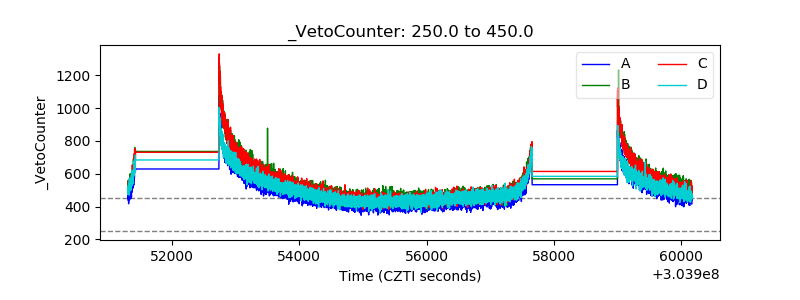 |