| Param | Original file | Final file |
|---|---|---|
| Filename | modeM0/AS1A05_104T04_9000003108_21047cztM0_level2.evt | modeM0/AS1A05_104T04_9000003108_21047cztM0_level2_quad_clean.evt |
| Size (bytes) | 437,768,640 | 94,201,920 |
| Size | 417.5 MB | 89.8 MB |
| Events in quadrant A | 3,121,988 | 616,654 |
| Events in quadrant B | 3,219,680 | 630,761 |
| Events in quadrant C | 3,137,522 | 589,600 |
| Events in quadrant D | 3,347,320 | 573,080 |
| Mode M0 | |||
|---|---|---|---|
| Quadrant | BADHDUFLAG | Total packets | Discarded packets |
| A | 0 | 13245 | 2 |
| B | 0 | 13447 | 2 |
| C | 0 | 13316 | 2 |
| D | 0 | 14205 | 2 |
| Mode M9 | |||
|---|---|---|---|
| Quadrant | BADHDUFLAG | Total packets | Discarded packets |
| A | 0 | 22 | 0 |
| B | 0 | 23 | 0 |
| C | 0 | 23 | 0 |
| D | 0 | 23 | 0 |
| Mode SS | |||
|---|---|---|---|
| Quadrant | BADHDUFLAG | Total packets | Discarded packets |
| A | 0 | 128 | 0 |
| B | 0 | 128 | 0 |
| C | 0 | 128 | 0 |
| D | 0 | 128 | 0 |
| Quadrant | Total seconds | Saturated seconds | Saturation percentage |
|---|---|---|---|
| A | 6348 | 23 | 0.362319% |
| B | 6348 | 49 | 0.771897% |
| C | 6348 | 84 | 1.323251% |
| D | 6348 | 92 | 1.449275% |
Noise dominated data is calculated using 1-second bins in cleaned event files. If a bin has >2000 counts, and if more than 50% of those come from <1% of pixels, then it is considered to be noise-dominated and hence unusable.
| Quadrant | # 1 sec bins | Bins with >0 counts | Bins with >2000 counts | High rate bins dominated by noise | Noise dominated (total time) | Noise dominated (detector-on time) | Marked lightcurve |
|---|---|---|---|---|---|---|---|
| A | 7613 | 6349 | 0 | 0 | 0.00% | 0.00% | 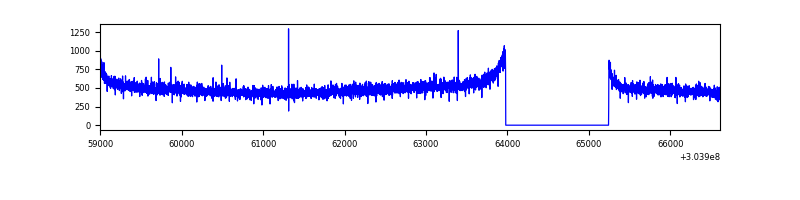 |
| B | 7613 | 6349 | 0 | 0 | 0.00% | 0.00% | 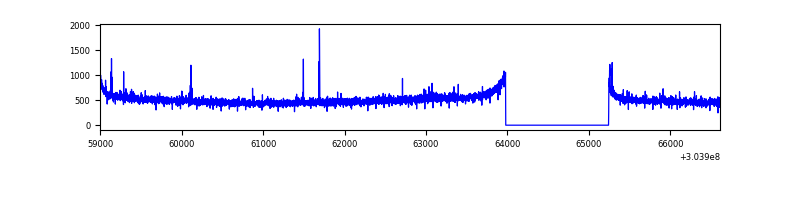 |
| C | 7613 | 6349 | 0 | 0 | 0.00% | 0.00% | 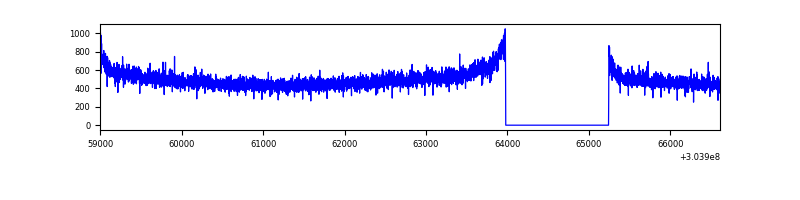 |
| D | 7613 | 6349 | 60 | 60 | 0.79% | 0.95% | 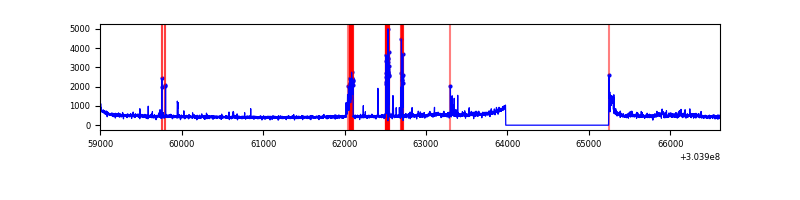 |
Top three noisy pixels from each quadrant. If the there are fewer than three noisy pixels in the level2.evt file, extra rows are filled as -1
| Pixel properties | Quadrant properties | ||||||
|---|---|---|---|---|---|---|---|
| Quadrant | DetID | PixID | Counts | Sigma | Mean | Median | Sigma |
| A | 0 | 226 | 6957 | 38.23 | 811 | 795 | 161.2 |
| A | 13 | 254 | 6884 | 37.77 | 811 | 795 | 161.2 |
| A | 3 | 137 | 6447 | 35.06 | 811 | 795 | 161.2 |
| B | 0 | 230 | 21677 | 135.91 | 812 | 793 | 153.7 |
| B | 12 | 111 | 18422 | 114.73 | 812 | 793 | 153.7 |
| B | 11 | 111 | 15970 | 98.77 | 812 | 793 | 153.7 |
| C | 14 | 238 | 125017 | 685.49 | 771 | 776 | 181.2 |
| C | 10 | 91 | 5720 | 27.28 | 771 | 776 | 181.2 |
| C | 13 | 61 | 5318 | 25.06 | 771 | 776 | 181.2 |
| D | 1 | 52 | 134568 | 711.36 | 775 | 753 | 188.1 |
| D | 2 | 14 | 113228 | 597.92 | 775 | 753 | 188.1 |
| D | 8 | 0 | 98617 | 520.24 | 775 | 753 | 188.1 |
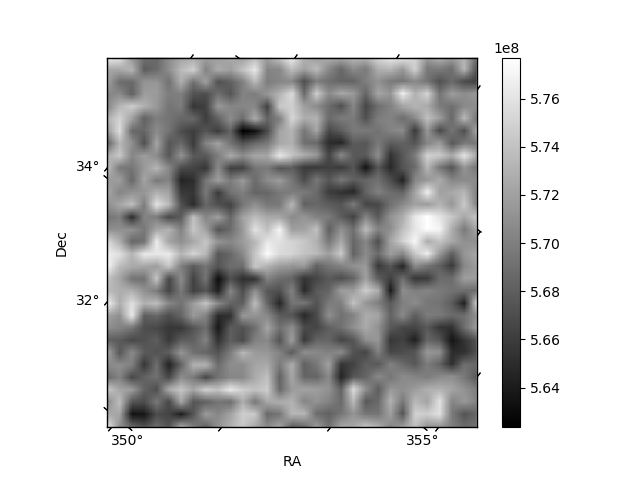
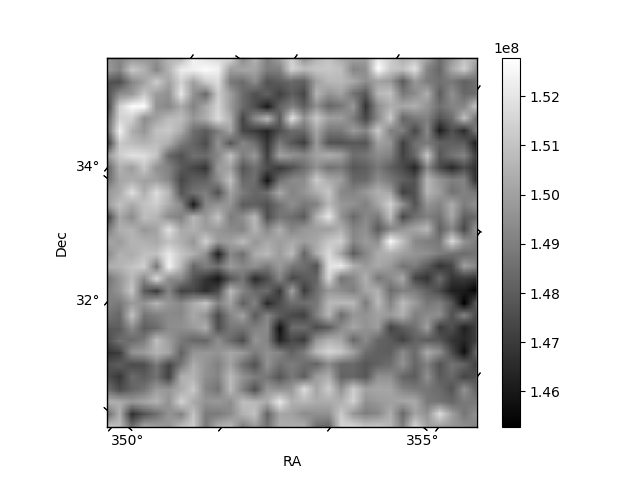
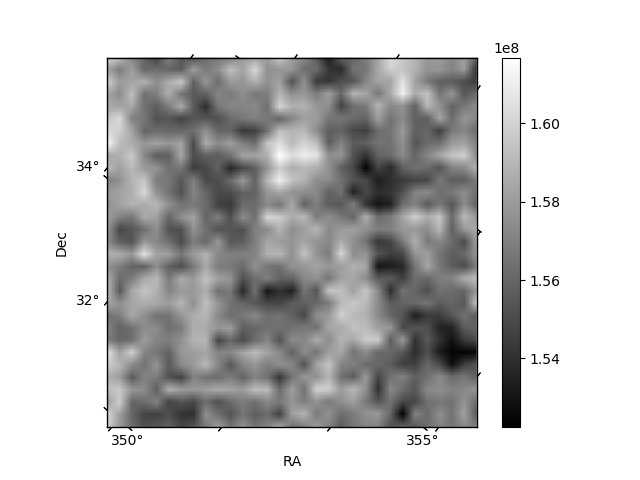
Histogram calculated using DETX and DETY for each event in the final _common_clean file
| Quadrant A | 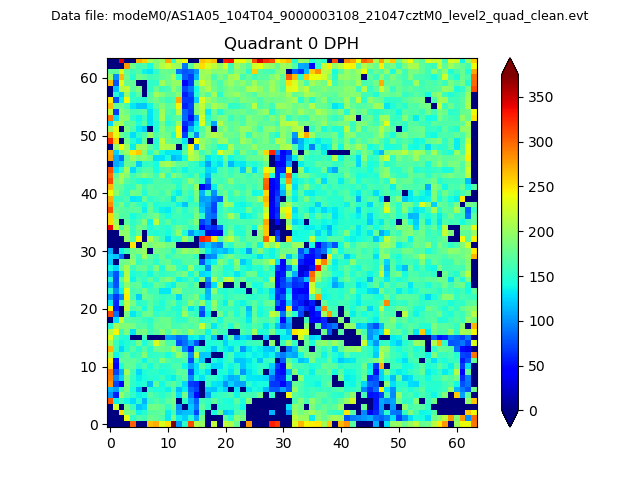 |
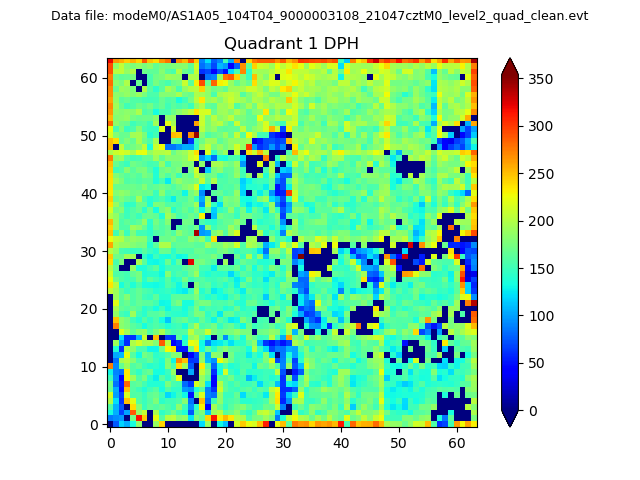 |
Quadrant B |
|---|---|---|---|
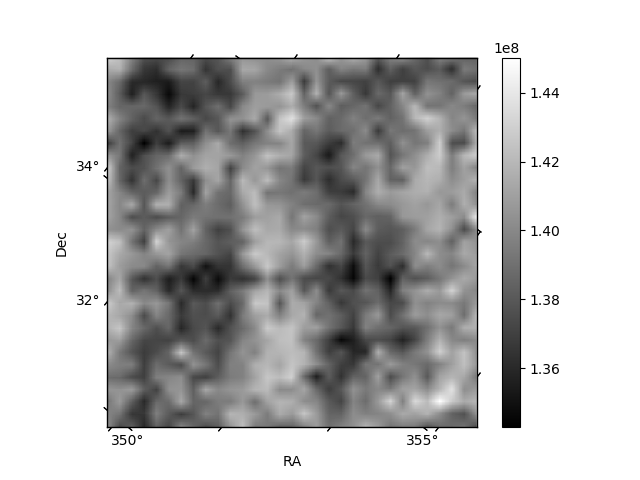
| Quadrant D |  |
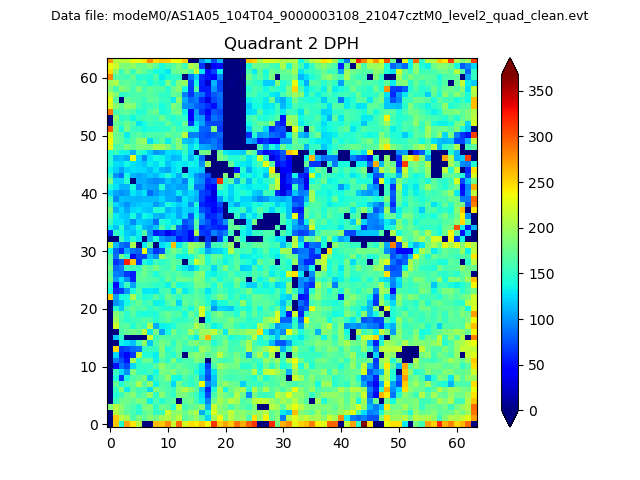 |
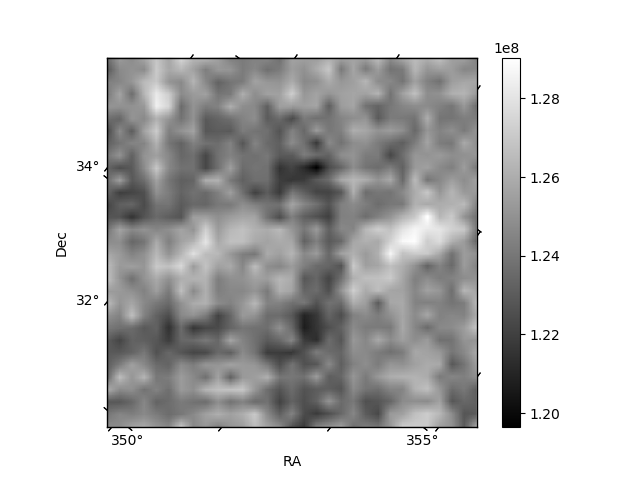
Quadrant C |
| Plot type | Count rate plots | Images |
|---|---|---|
| Comparison with Poisson distribution Blue bars denote a histogram of data divided into 1 sec bins. Red curve is a Poisson curve with rate = median count rate of data. |
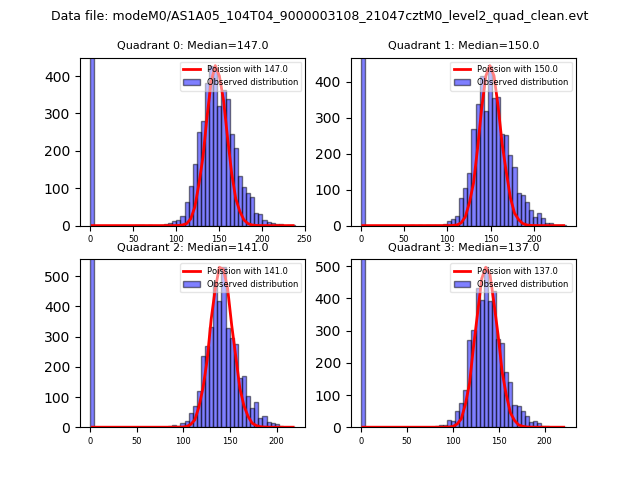 |
 |
| Quadrant-wise count rates Data is divided into 100 sec bins |
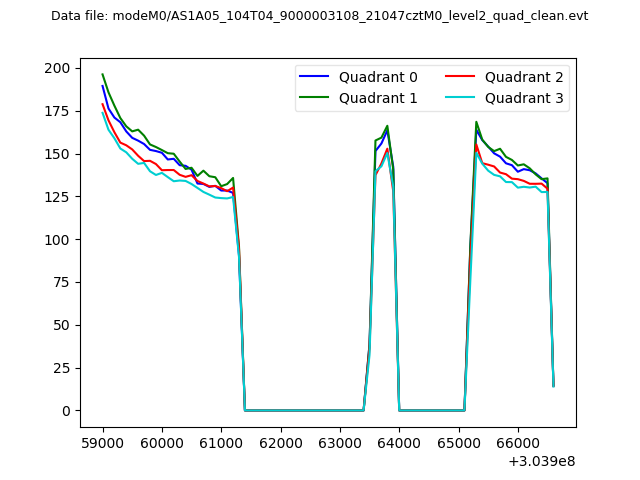 |
|
| Module-wise count rates for Quadrant A Data is divided into 100 sec bins |
 |
 |
| Module-wise count rates for Quadrant B Data is divided into 100 sec bins |
 |
 |
| Module-wise count rates for Quadrant C Data is divided into 100 sec bins |
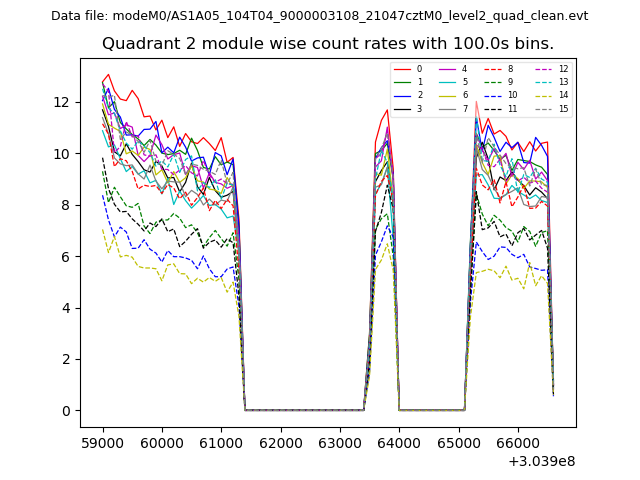 |
 |
| Module-wise count rates for Quadrant D Data is divided into 100 sec bins |
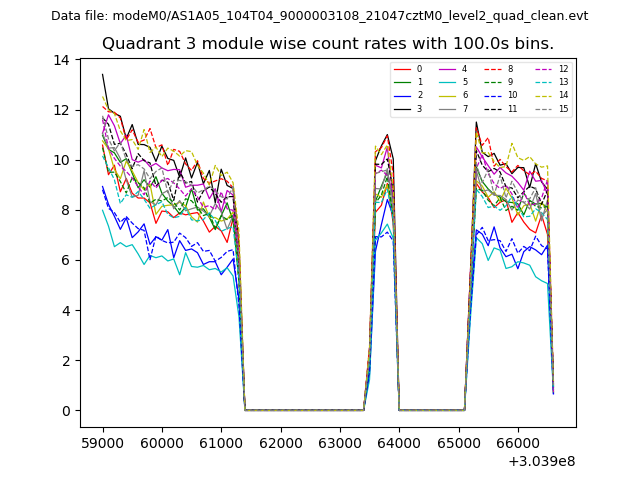 |
 |
| Parameter | Plot |
|---|---|
| CZT HV Monitor |  |
| D_VDD | 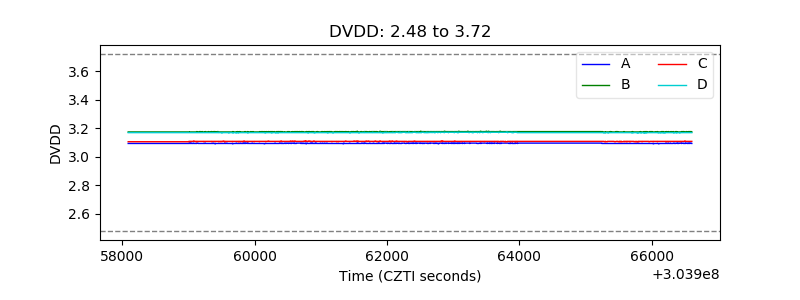 |
| Temperature 1 | 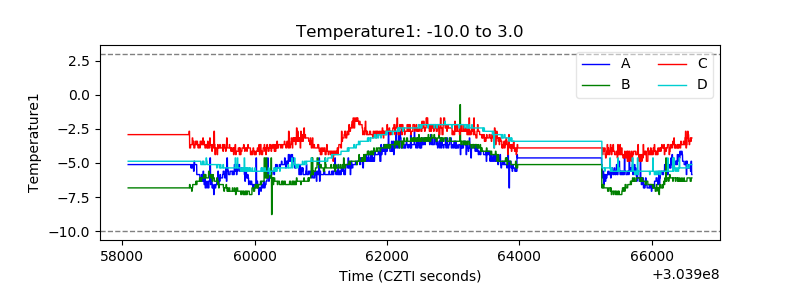 |
| Veto HV Monitor | 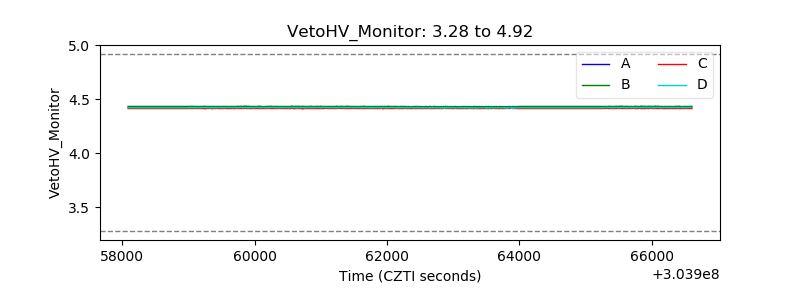 |
| Veto LLD | 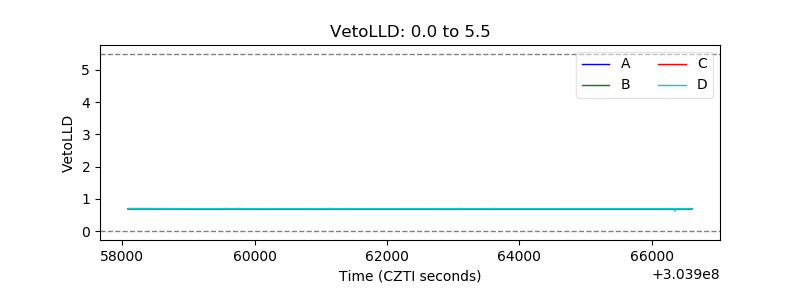 |
| Alpha Counter | 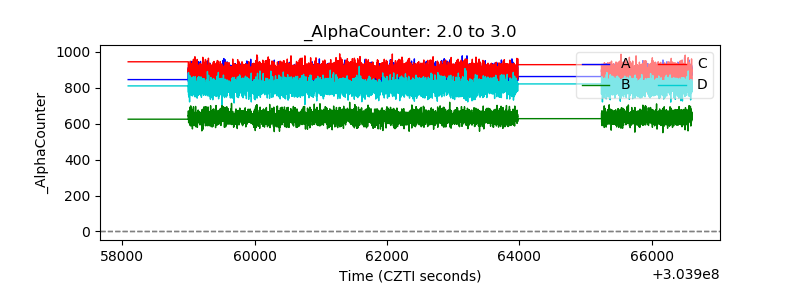 |
| _CPM_Rate | 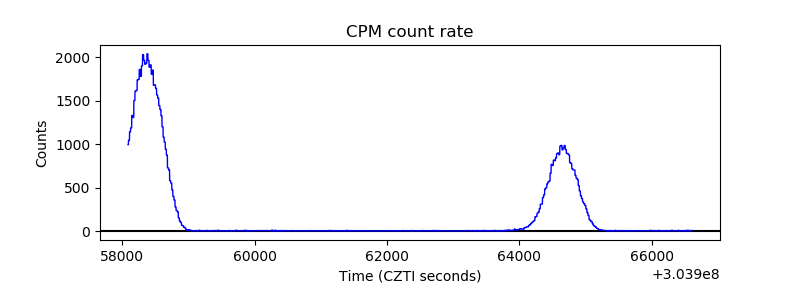 |
| CZT Counter | 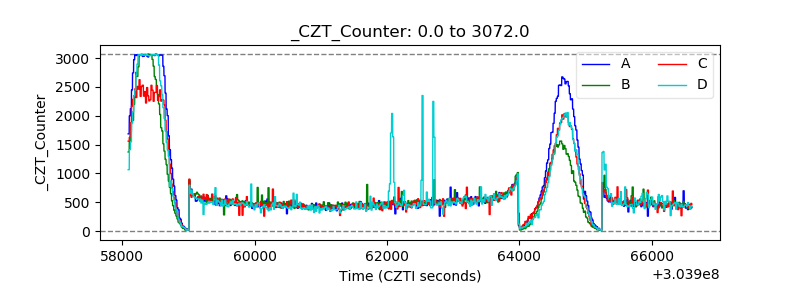 |
| +2.5 Volts monitor |  |
| +5 Volts monitor | 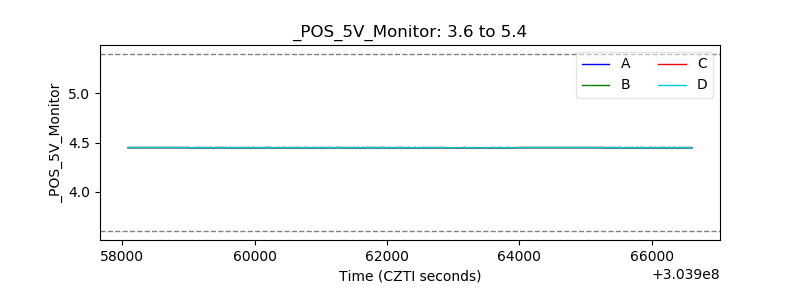 |
| _ROLL_ROT | 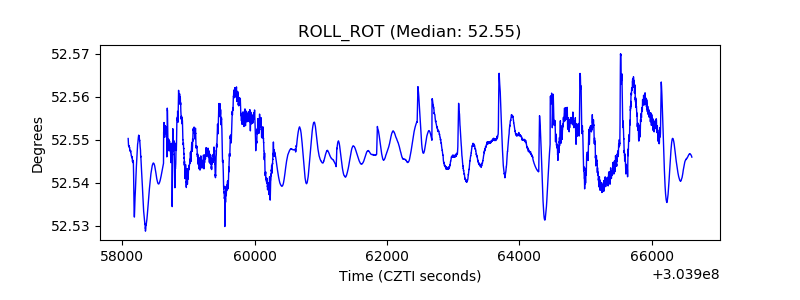 |
| _Roll_DEC | 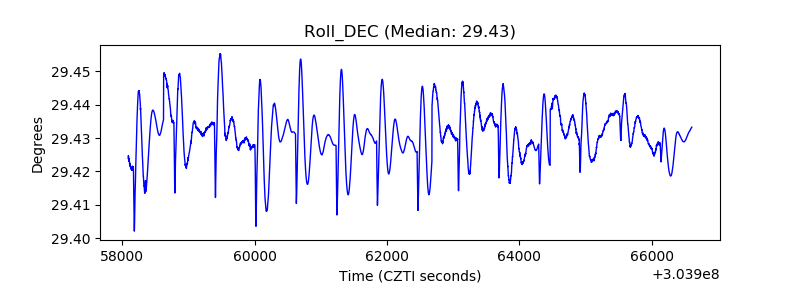 |
| _Roll_RA | 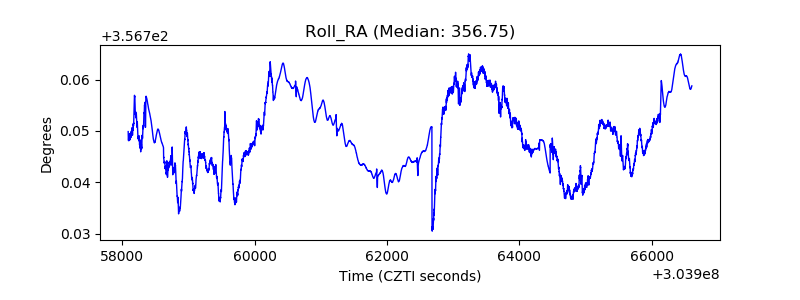 |
| Veto Counter | 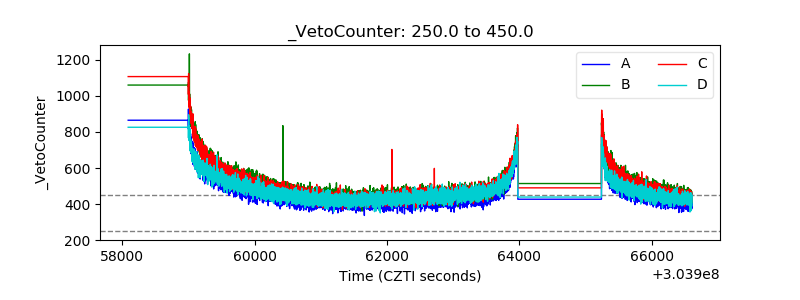 |