| Param | Original file | Final file |
|---|---|---|
| Filename | modeM0/AS1A05_104T04_9000003108_21049cztM0_level2.evt | modeM0/AS1A05_104T04_9000003108_21049cztM0_level2_quad_clean.evt |
| Size (bytes) | 247,829,760 | 39,473,280 |
| Size | 236.3 MB | 37.6 MB |
| Events in quadrant A | 1,813,484 | 231,866 |
| Events in quadrant B | 1,843,134 | 235,589 |
| Events in quadrant C | 1,795,894 | 223,810 |
| Events in quadrant D | 1,779,884 | 221,877 |
| Mode M0 | |||
|---|---|---|---|
| Quadrant | BADHDUFLAG | Total packets | Discarded packets |
| A | 0 | 8005 | 0 |
| B | 0 | 8019 | 0 |
| C | 0 | 8005 | 0 |
| D | 0 | 8131 | 0 |
| Mode SS | |||
|---|---|---|---|
| Quadrant | BADHDUFLAG | Total packets | Discarded packets |
| A | 0 | 80 | 0 |
| B | 0 | 80 | 0 |
| C | 0 | 80 | 0 |
| D | 0 | 80 | 0 |
| Quadrant | Total seconds | Saturated seconds | Saturation percentage |
|---|---|---|---|
| A | 3989 | 2 | 0.050138% |
| B | 3989 | 5 | 0.125345% |
| C | 3990 | 13 | 0.325815% |
| D | 3990 | 3 | 0.075188% |
Noise dominated data is calculated using 1-second bins in cleaned event files. If a bin has >2000 counts, and if more than 50% of those come from <1% of pixels, then it is considered to be noise-dominated and hence unusable.
| Quadrant | # 1 sec bins | Bins with >0 counts | Bins with >2000 counts | High rate bins dominated by noise | Noise dominated (total time) | Noise dominated (detector-on time) | Marked lightcurve |
|---|---|---|---|---|---|---|---|
| A | 3989 | 3989 | 0 | 0 | 0.00% | 0.00% | 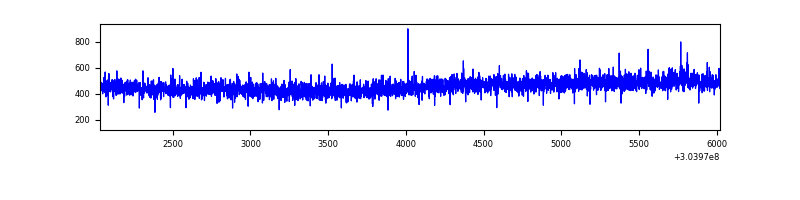 |
| B | 3989 | 3989 | 0 | 0 | 0.00% | 0.00% | 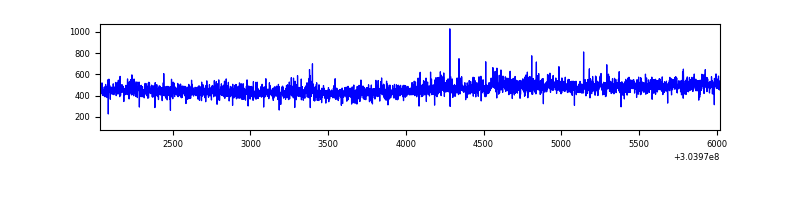 |
| C | 3990 | 3990 | 0 | 0 | 0.00% | 0.00% | 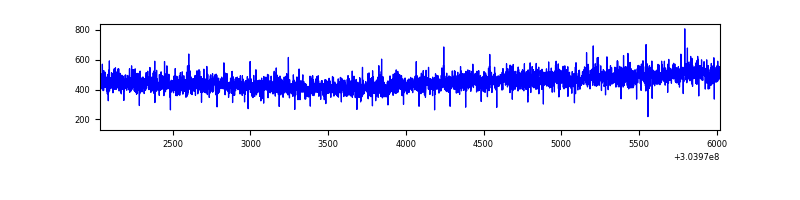 |
| D | 3990 | 3990 | 4 | 4 | 0.10% | 0.10% | 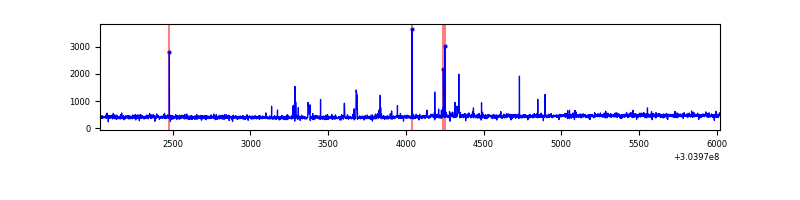 |
Top three noisy pixels from each quadrant. If the there are fewer than three noisy pixels in the level2.evt file, extra rows are filled as -1
| Pixel properties | Quadrant properties | ||||||
|---|---|---|---|---|---|---|---|
| Quadrant | DetID | PixID | Counts | Sigma | Mean | Median | Sigma |
| A | 13 | 254 | 4557 | 42.77 | 470 | 461 | 95.8 |
| A | 0 | 226 | 4054 | 37.52 | 470 | 461 | 95.8 |
| A | 13 | 252 | 4030 | 37.27 | 470 | 461 | 95.8 |
| B | 12 | 111 | 10949 | 116.18 | 465 | 453 | 90.3 |
| B | 11 | 111 | 9500 | 100.14 | 465 | 453 | 90.3 |
| B | 14 | 111 | 8427 | 88.27 | 465 | 453 | 90.3 |
| C | 14 | 238 | 69529 | 661.29 | 443 | 445 | 104.5 |
| C | 13 | 61 | 3070 | 25.13 | 443 | 445 | 104.5 |
| C | 3 | 202 | 1030 | 5.6 | 443 | 445 | 104.5 |
| D | 1 | 52 | 63854 | 569.88 | 451 | 438 | 111.3 |
| D | 2 | 234 | 15014 | 130.99 | 451 | 438 | 111.3 |
| D | 13 | 172 | 7750 | 65.71 | 451 | 438 | 111.3 |
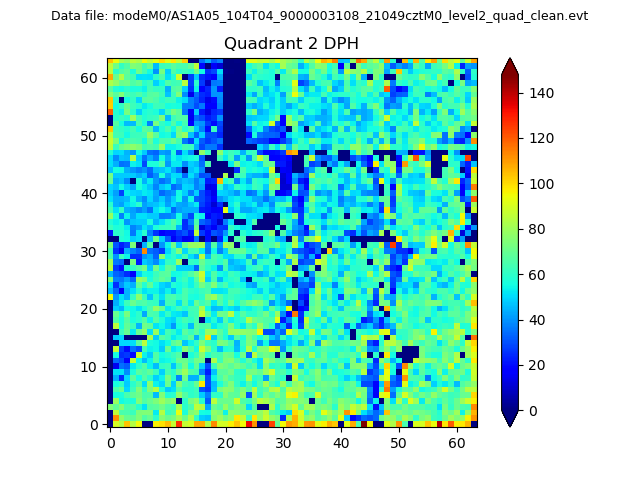
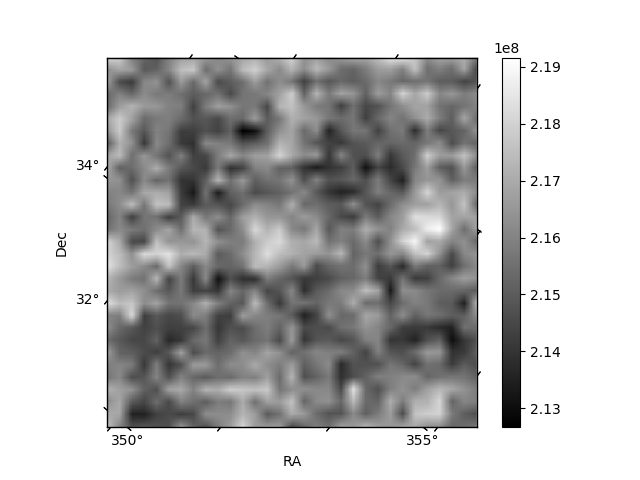
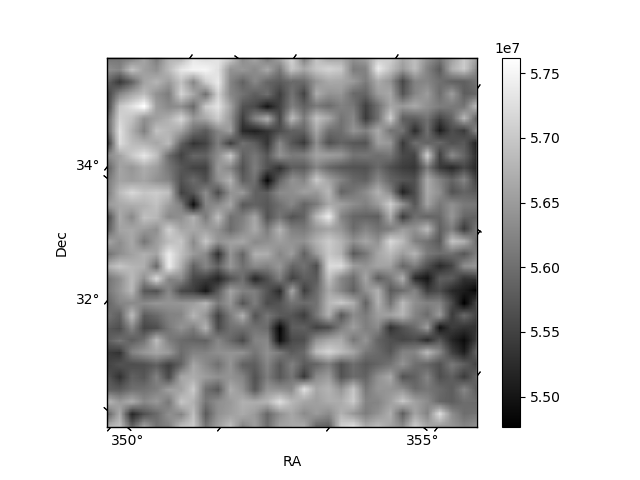
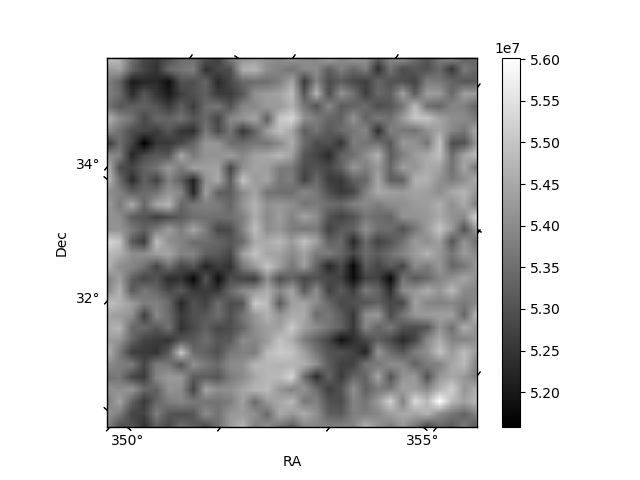
Histogram calculated using DETX and DETY for each event in the final _common_clean file
| Quadrant A | 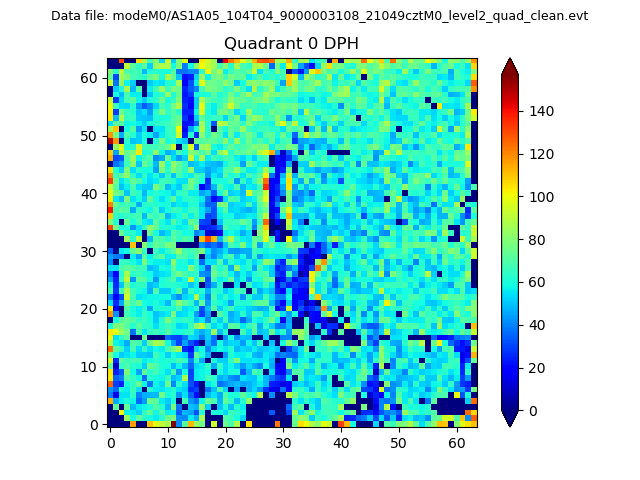 |
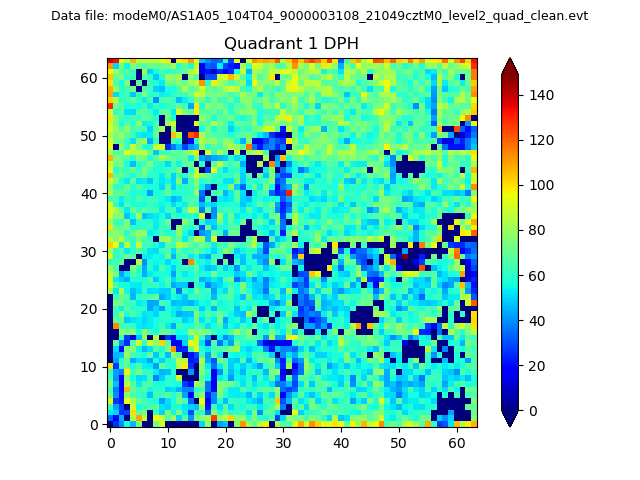 |
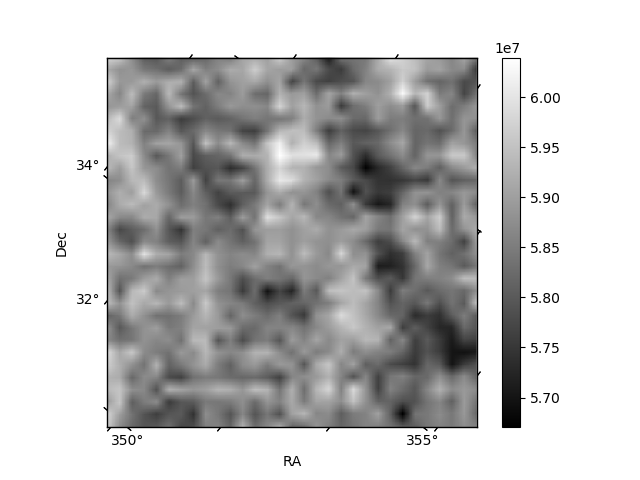
Quadrant B |
|---|---|---|---|
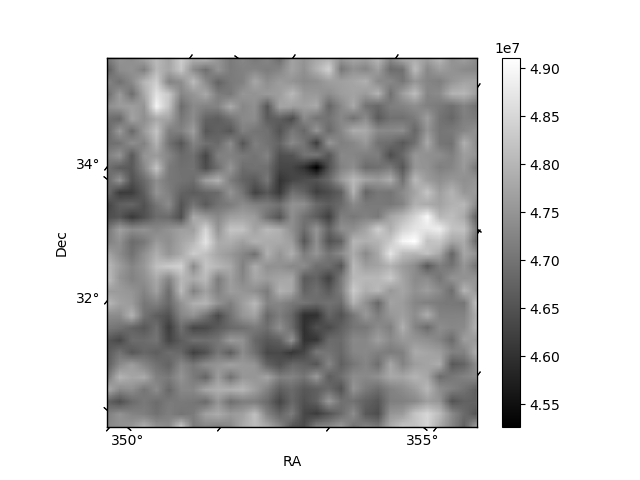
| Quadrant D | 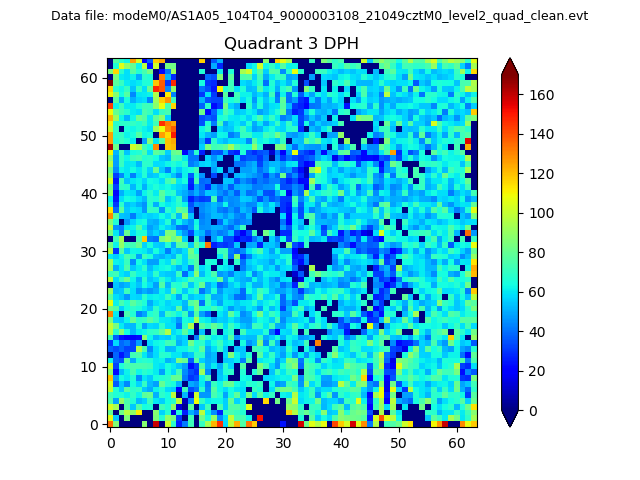 |
 |
Quadrant C |
| Plot type | Count rate plots | Images |
|---|---|---|
| Comparison with Poisson distribution Blue bars denote a histogram of data divided into 1 sec bins. Red curve is a Poisson curve with rate = median count rate of data. |
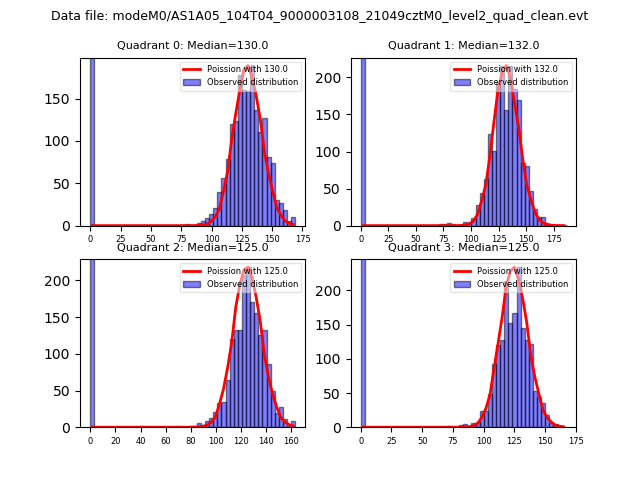 |
 |
| Quadrant-wise count rates Data is divided into 100 sec bins |
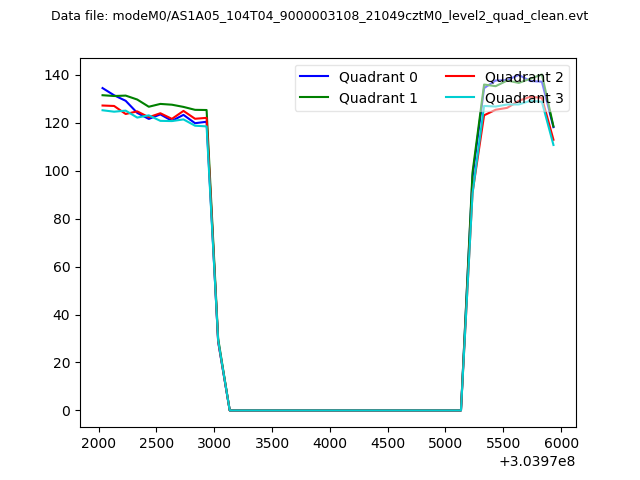 |
|
| Module-wise count rates for Quadrant A Data is divided into 100 sec bins |
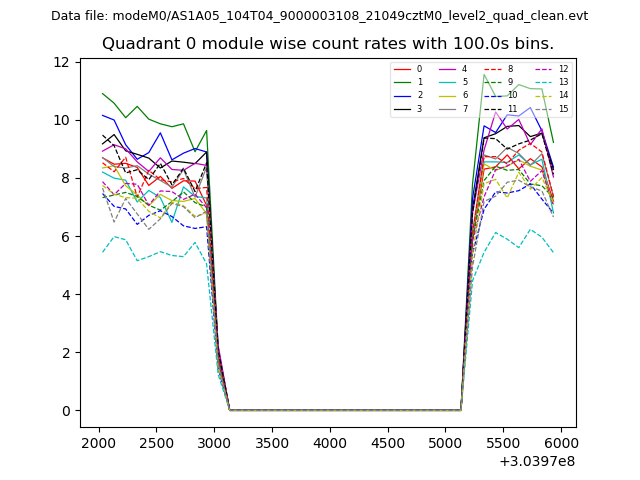 |
 |
| Module-wise count rates for Quadrant B Data is divided into 100 sec bins |
 |
 |
| Module-wise count rates for Quadrant C Data is divided into 100 sec bins |
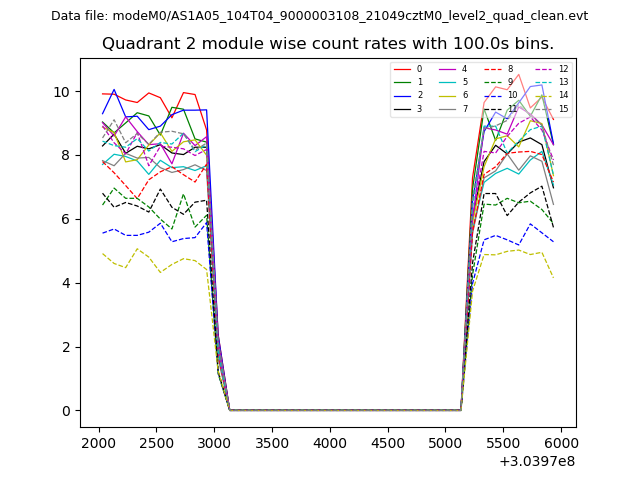 |
 |
| Module-wise count rates for Quadrant D Data is divided into 100 sec bins |
 |
 |
| Parameter | Plot |
|---|---|
| CZT HV Monitor |  |
| D_VDD |  |
| Temperature 1 | 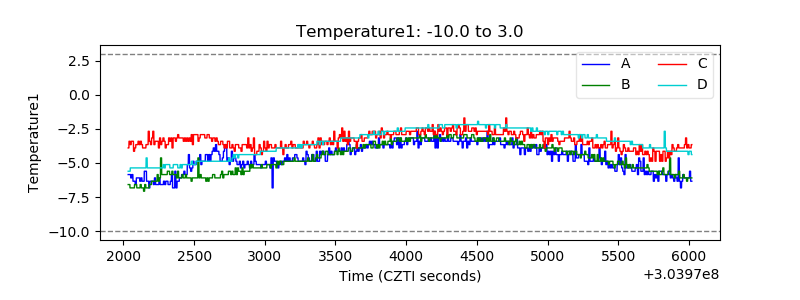 |
| Veto HV Monitor | 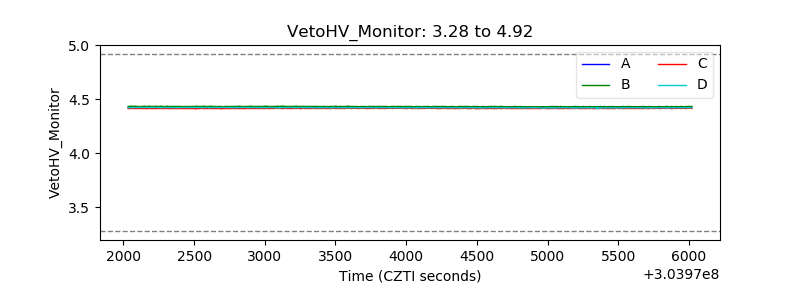 |
| Veto LLD |  |
| Alpha Counter | 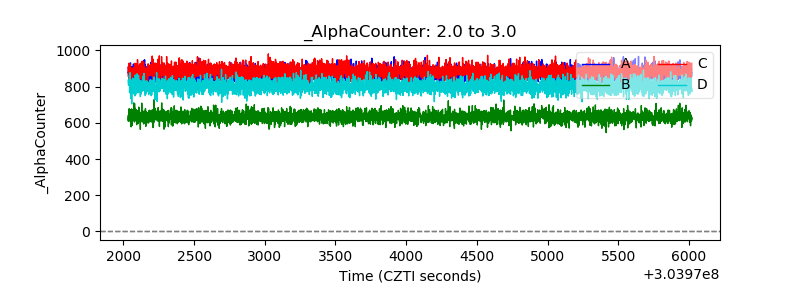 |
| _CPM_Rate | 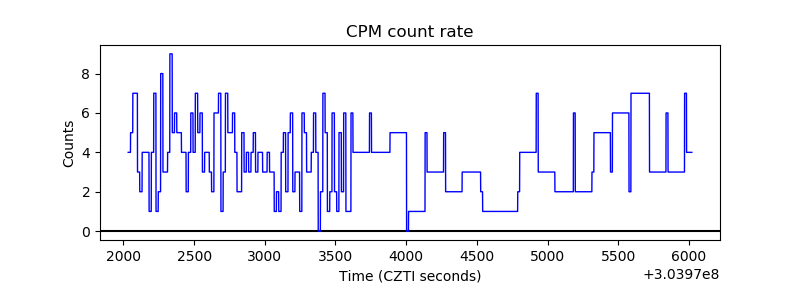 |
| CZT Counter | 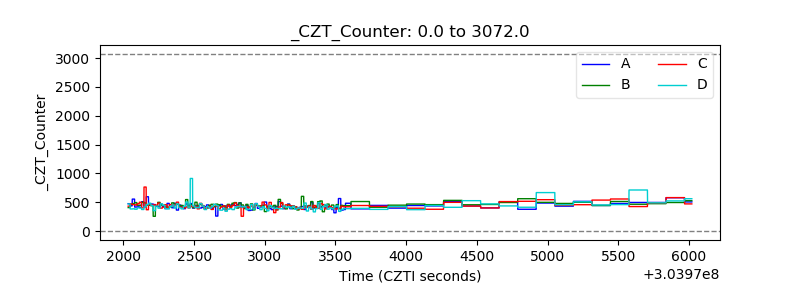 |
| +2.5 Volts monitor |  |
| +5 Volts monitor |  |
| _ROLL_ROT |  |
| _Roll_DEC | 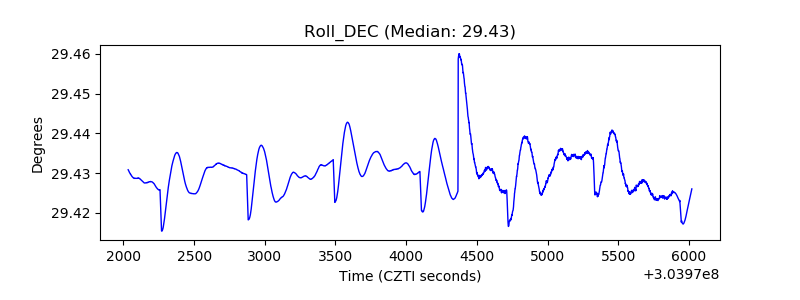 |
| _Roll_RA | 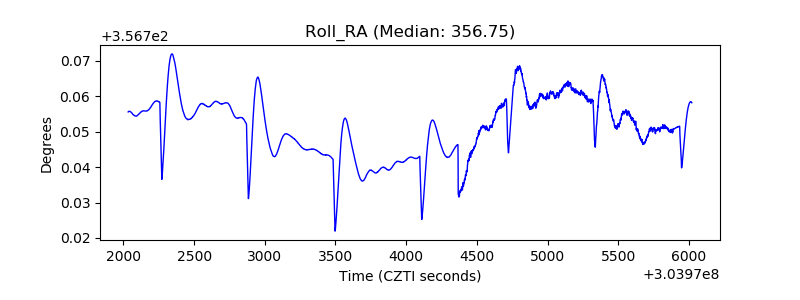 |
| Veto Counter |  |