| Param | Original file | Final file |
|---|---|---|
| Filename | modeM0/AS1A05_025T04_9000003110cztM0_level2.fits | modeM0/AS1A05_025T04_9000003110cztM0_level2_quad_clean.evt |
| Size (bytes) | 395,821,440 | 380,675,520 |
| Size | 377.5 MB | 363.0 MB |
| Events in quadrant A | 2,408,206 | 2,273,159 |
| Events in quadrant B | 2,307,674 | 2,276,936 |
| Events in quadrant C | 2,362,498 | 2,152,582 |
| Events in quadrant D | 2,026,038 | 1,943,859 |
| Mode M9 | |||
|---|---|---|---|
| Quadrant | BADHDUFLAG | Total packets | Discarded packets |
| A | 0 | 52 | 0 |
| B | 0 | 52 | 0 |
| C | 0 | 52 | 0 |
| D | 0 | 52 | 0 |
| Mode SS | |||
|---|---|---|---|
| Quadrant | BADHDUFLAG | Total packets | Discarded packets |
| A | 0 | 852 | 0 |
| B | 0 | 852 | 0 |
| C | 0 | 852 | 0 |
| D | 0 | 852 | 0 |
| Mode M0 | |||
|---|---|---|---|
| Quadrant | BADHDUFLAG | Total packets | Discarded packets |
| A | 0 | 86167 | 0 |
| B | 0 | 91465 | 0 |
| C | 0 | 85987 | 0 |
| D | 0 | 107457 | 0 |
| Quadrant | Total seconds | Saturated seconds | Saturation percentage |
|---|---|---|---|
| A | 41991 | 591 | 1.407444% |
| B | 41991 | 849 | 2.021862% |
| C | 41991 | 756 | 1.800386% |
| D | 41991 | 1856 | 4.419995% |
Noise dominated data is calculated using 1-second bins in cleaned event files. If a bin has >2000 counts, and if more than 50% of those come from <1% of pixels, then it is considered to be noise-dominated and hence unusable.
| Quadrant | # 1 sec bins | Bins with >0 counts | Bins with >2000 counts | High rate bins dominated by noise | Noise dominated (total time) | Noise dominated (detector-on time) | Marked lightcurve |
|---|---|---|---|---|---|---|---|
| A | 46450 | 41989 | 0 | 0 | 0.00% | 0.00% | 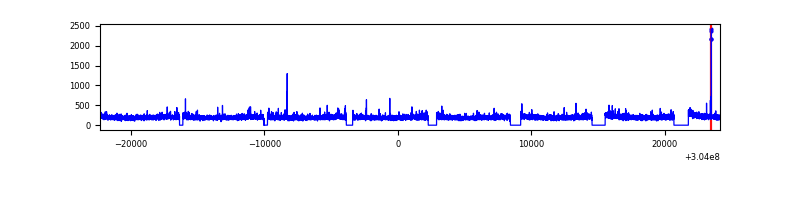 |
| B | 46450 | 41985 | 0 | 0 | 0.00% | 0.00% |  |
| C | 46450 | 41991 | 0 | 0 | 0.00% | 0.00% | 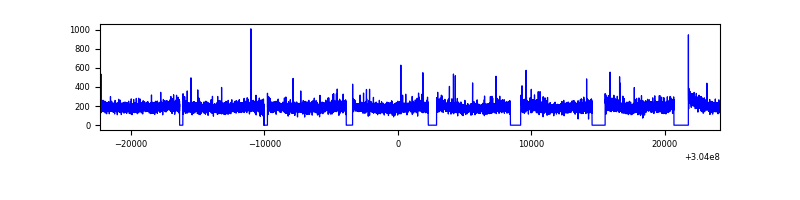 |
| D | 46450 | 41986 | 0 | 0 | 0.00% | 0.00% |  |
Top three noisy pixels from each quadrant. If the there are fewer than three noisy pixels in the level2.evt file, extra rows are filled as -1
| Pixel properties | Quadrant properties | ||||||
|---|---|---|---|---|---|---|---|
| Quadrant | DetID | PixID | Counts | Sigma | Mean | Median | Sigma |
| A | 0 | 29 | 2376 | 11.6 | 625 | 588 | 154.1 |
| A | 7 | 110 | 1995 | 9.13 | 625 | 588 | 154.1 |
| A | 9 | 19 | 1858 | 8.24 | 625 | 588 | 154.1 |
| B | 2 | 9 | 1827 | 10.15 | 610 | 581 | 122.8 |
| B | 3 | 17 | 1579 | 8.13 | 610 | 581 | 122.8 |
| B | 2 | 8 | 1575 | 8.1 | 610 | 581 | 122.8 |
| C | 3 | 234 | 1769 | 7.35 | 622 | 578 | 162.1 |
| C | 12 | 241 | 1760 | 7.29 | 622 | 578 | 162.1 |
| C | 1 | 81 | 1751 | 7.23 | 622 | 578 | 162.1 |
| D | 7 | 3 | 1478 | 6.11 | 578 | 524 | 156.2 |
| D | 6 | 67 | 1403 | 5.63 | 578 | 524 | 156.2 |
| D | 6 | 231 | 1382 | 5.49 | 578 | 524 | 156.2 |
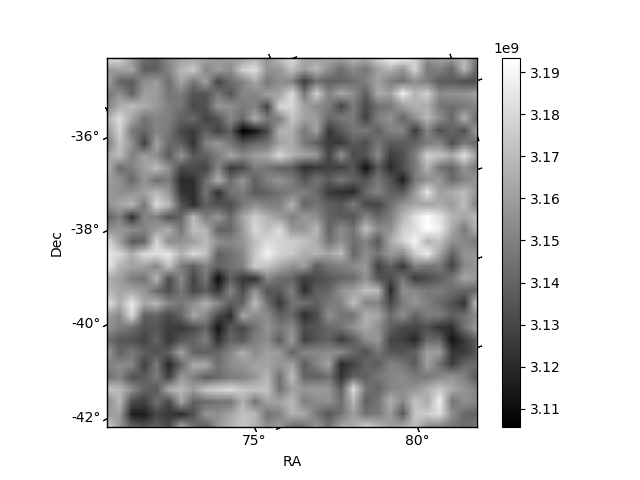
Histogram calculated using DETX and DETY for each event in the final _common_clean file
| Quadrant A | 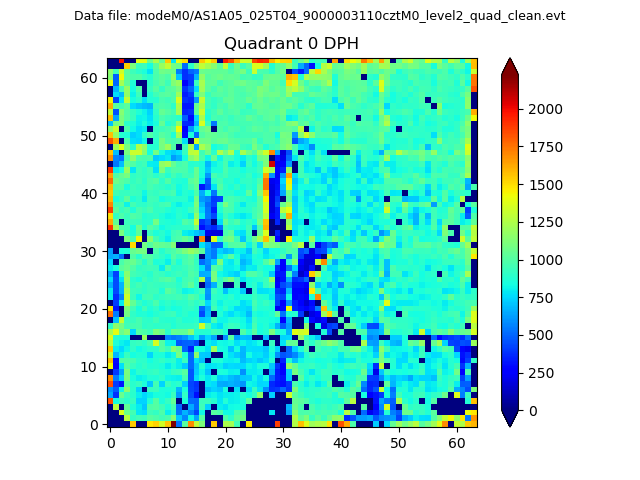 |
 |
Quadrant B |
|---|---|---|---|
| Quadrant D |  |
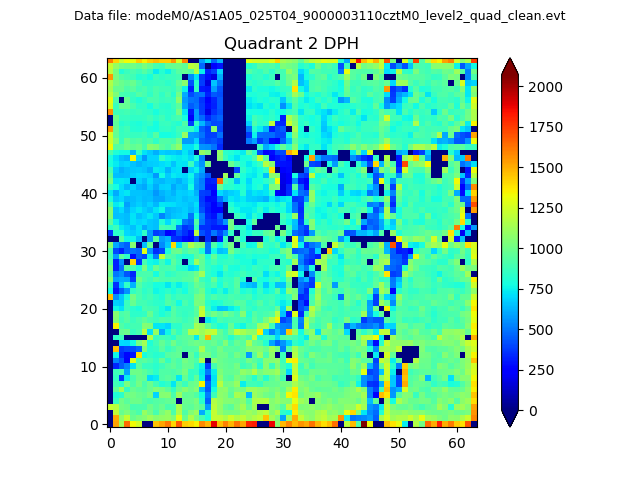 |
Quadrant C |
| Plot type | Count rate plots | Images |
|---|---|---|
| Comparison with Poisson distribution Blue bars denote a histogram of data divided into 1 sec bins. Red curve is a Poisson curve with rate = median count rate of data. |
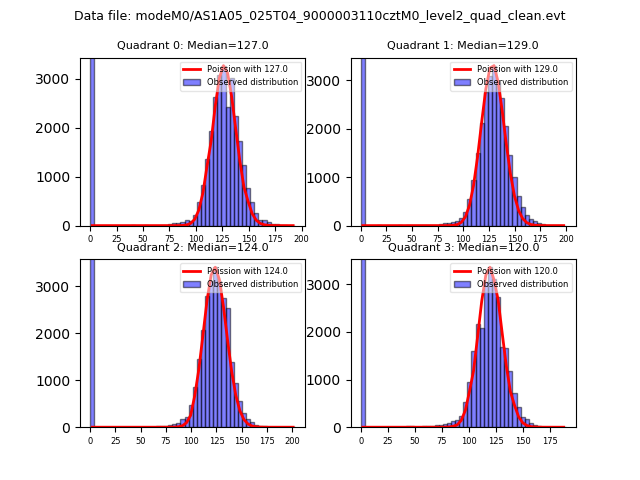 |
 |
| Quadrant-wise count rates Data is divided into 100 sec bins |
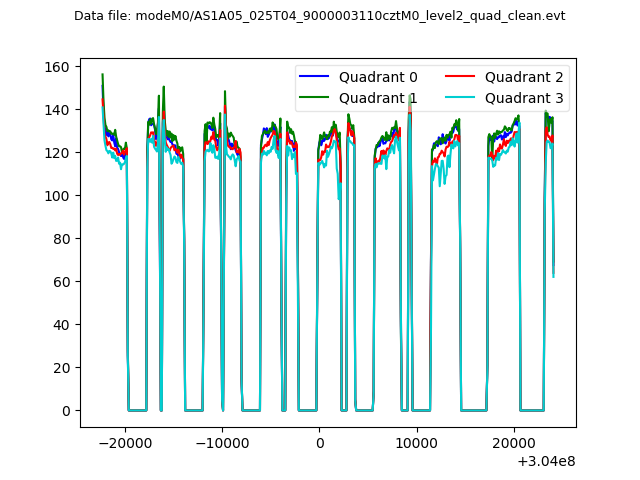 |
|
| Module-wise count rates for Quadrant A Data is divided into 100 sec bins |
 |
 |
| Module-wise count rates for Quadrant B Data is divided into 100 sec bins |
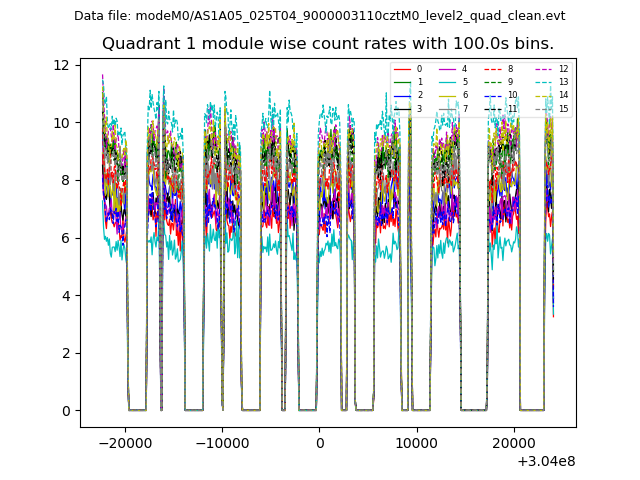 |
 |
| Module-wise count rates for Quadrant C Data is divided into 100 sec bins |
 |
 |
| Module-wise count rates for Quadrant D Data is divided into 100 sec bins |
 |
 |
| Parameter | Plot |
|---|---|
| CZT HV Monitor | 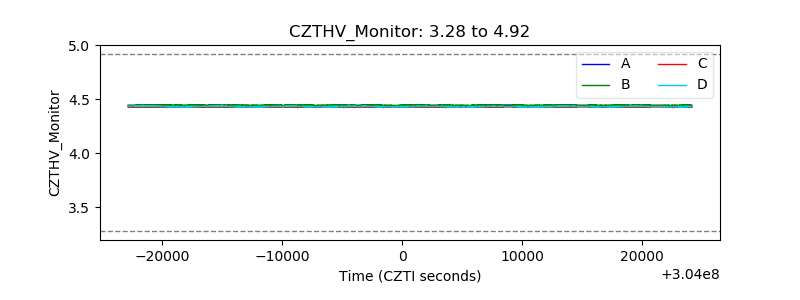 |
| D_VDD | 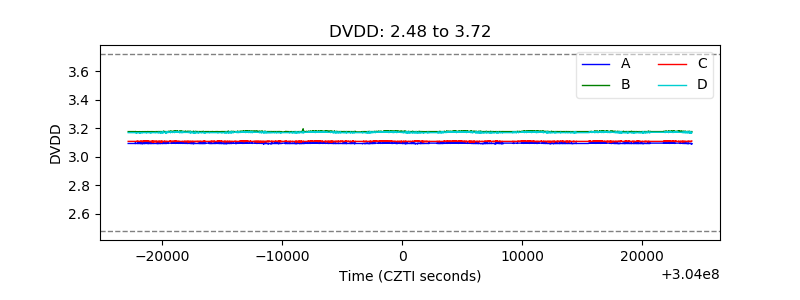 |
| Temperature 1 |  |
| Veto HV Monitor | 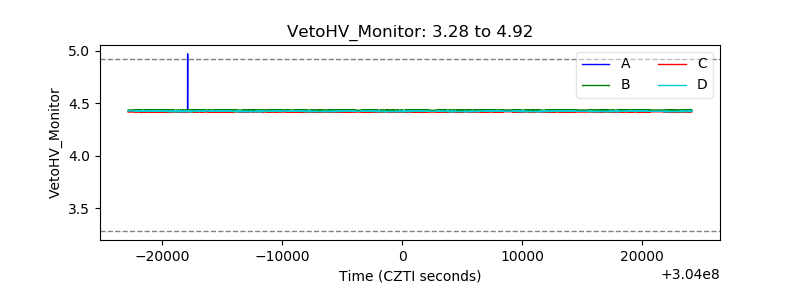 |
| Veto LLD |  |
| Alpha Counter |  |
| _CPM_Rate |  |
| CZT Counter |  |
| +2.5 Volts monitor |  |
| +5 Volts monitor | 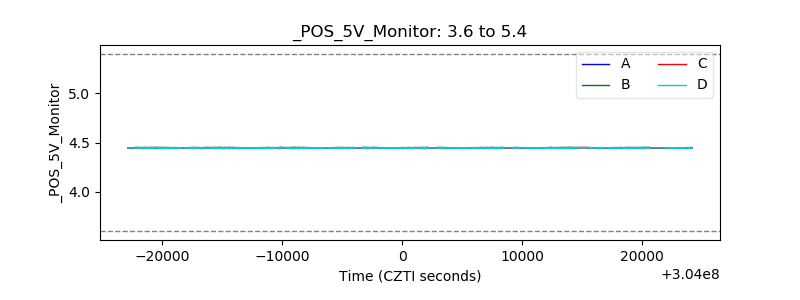 |
| _ROLL_ROT |  |
| _Roll_DEC | 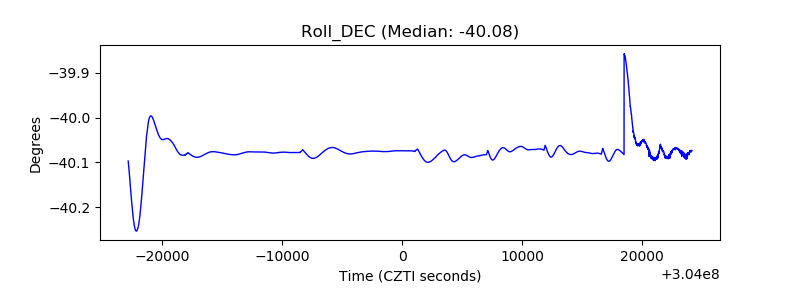 |
| _Roll_RA | 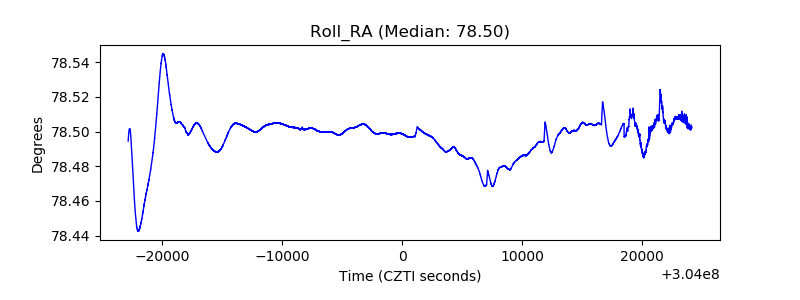 |
| Veto Counter |  |