| Param | Original file | Final file |
|---|---|---|
| Filename | modeM0/AS1A05_025T04_9000003110_21049cztM0_level2.evt | modeM0/AS1A05_025T04_9000003110_21049cztM0_level2_quad_clean.evt |
| Size (bytes) | 95,863,680 | 28,310,400 |
| Size | 91.4 MB | 27.0 MB |
| Events in quadrant A | 688,214 | 190,028 |
| Events in quadrant B | 707,738 | 194,990 |
| Events in quadrant C | 720,090 | 184,213 |
| Events in quadrant D | 685,201 | 179,597 |
| Mode M9 | |||
|---|---|---|---|
| Quadrant | BADHDUFLAG | Total packets | Discarded packets |
| A | 0 | 6 | 0 |
| B | 0 | 6 | 0 |
| C | 0 | 6 | 0 |
| D | 0 | 6 | 0 |
| Mode SS | |||
|---|---|---|---|
| Quadrant | BADHDUFLAG | Total packets | Discarded packets |
| A | 0 | 30 | 0 |
| B | 0 | 30 | 0 |
| C | 0 | 30 | 0 |
| D | 0 | 30 | 0 |
| Mode M0 | |||
|---|---|---|---|
| Quadrant | BADHDUFLAG | Total packets | Discarded packets |
| A | 0 | 3029 | 1 |
| B | 0 | 3060 | 1 |
| C | 0 | 3050 | 1 |
| D | 0 | 3065 | 1 |
| Quadrant | Total seconds | Saturated seconds | Saturation percentage |
|---|---|---|---|
| A | 1458 | 29 | 1.989026% |
| B | 1458 | 33 | 2.263374% |
| C | 1458 | 48 | 3.292181% |
| D | 1458 | 25 | 1.714678% |
Noise dominated data is calculated using 1-second bins in cleaned event files. If a bin has >2000 counts, and if more than 50% of those come from <1% of pixels, then it is considered to be noise-dominated and hence unusable.
| Quadrant | # 1 sec bins | Bins with >0 counts | Bins with >2000 counts | High rate bins dominated by noise | Noise dominated (total time) | Noise dominated (detector-on time) | Marked lightcurve |
|---|---|---|---|---|---|---|---|
| A | 1458 | 1458 | 0 | 0 | 0.00% | 0.00% | 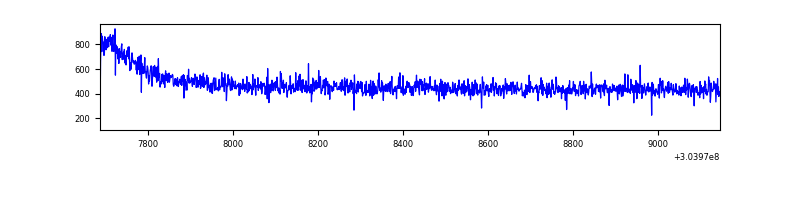 |
| B | 1458 | 1458 | 1 | 1 | 0.07% | 0.07% | 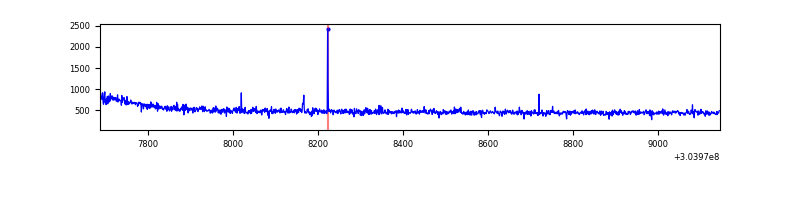 |
| C | 1458 | 1458 | 0 | 0 | 0.00% | 0.00% | 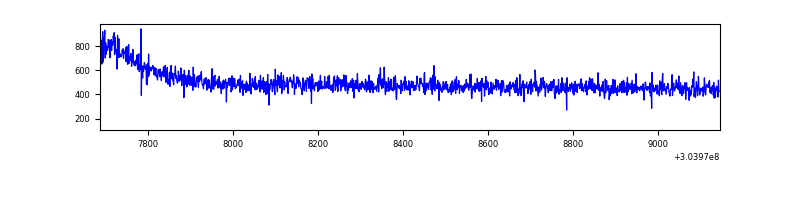 |
| D | 1458 | 1458 | 0 | 0 | 0.00% | 0.00% | 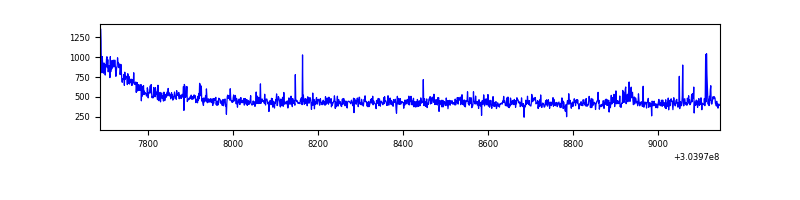 |
Top three noisy pixels from each quadrant. If the there are fewer than three noisy pixels in the level2.evt file, extra rows are filled as -1
| Pixel properties | Quadrant properties | ||||||
|---|---|---|---|---|---|---|---|
| Quadrant | DetID | PixID | Counts | Sigma | Mean | Median | Sigma |
| A | 13 | 254 | 2366 | 57.53 | 178 | 173 | 38.1 |
| A | 3 | 137 | 1487 | 34.47 | 178 | 173 | 38.1 |
| A | 0 | 226 | 1416 | 32.61 | 178 | 173 | 38.1 |
| B | 3 | 64 | 4414 | 117.04 | 179 | 174 | 36.2 |
| B | 12 | 111 | 4283 | 113.42 | 179 | 174 | 36.2 |
| B | 11 | 111 | 3642 | 95.73 | 179 | 174 | 36.2 |
| C | 14 | 238 | 27210 | 626.39 | 177 | 178 | 43.2 |
| C | 13 | 61 | 1277 | 25.47 | 177 | 178 | 43.2 |
| C | 7 | 247 | 421 | 5.63 | 177 | 178 | 43.2 |
| D | 1 | 52 | 15117 | 336.12 | 177 | 171 | 44.5 |
| D | 2 | 234 | 4349 | 93.96 | 177 | 171 | 44.5 |
| D | 3 | 238 | 2403 | 50.2 | 177 | 171 | 44.5 |
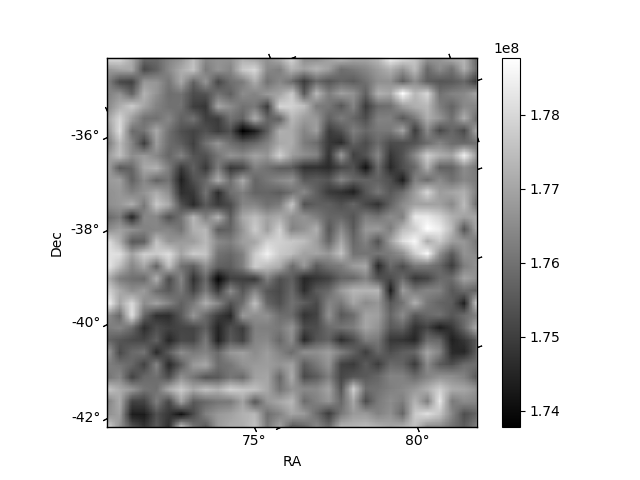
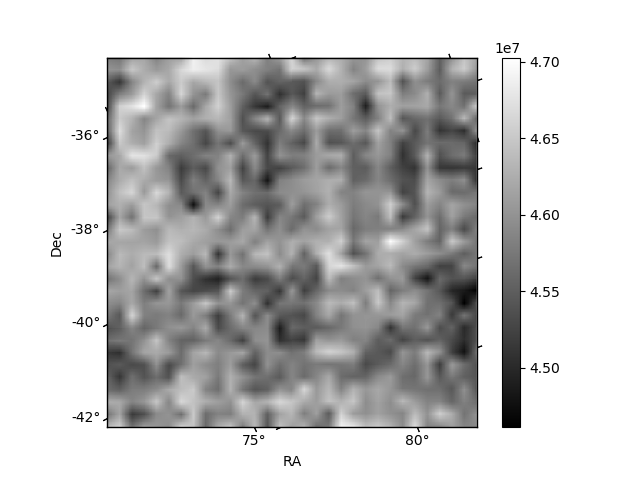
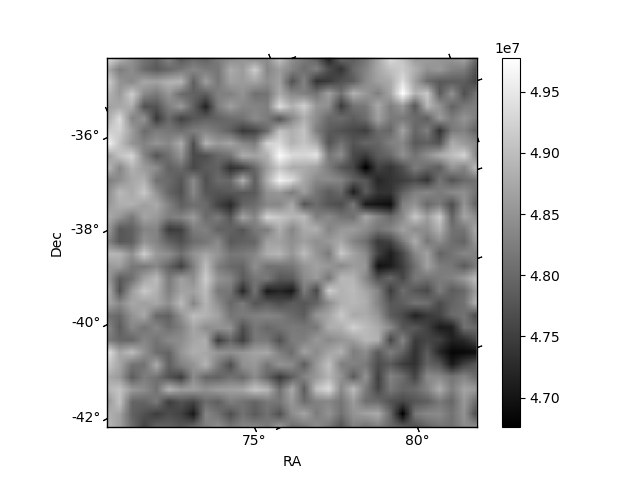
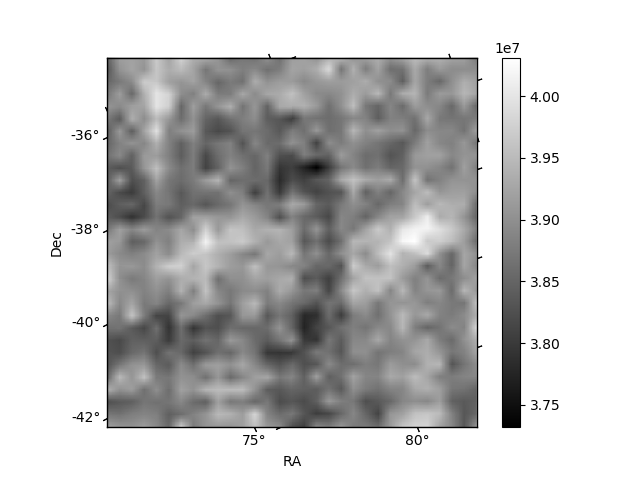
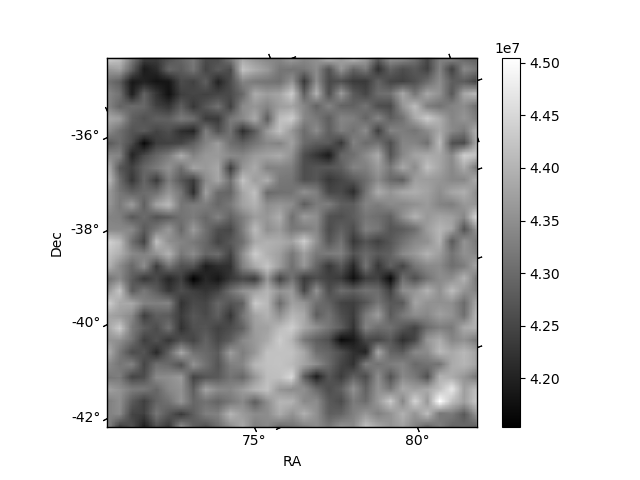
Histogram calculated using DETX and DETY for each event in the final _common_clean file
| Quadrant A | 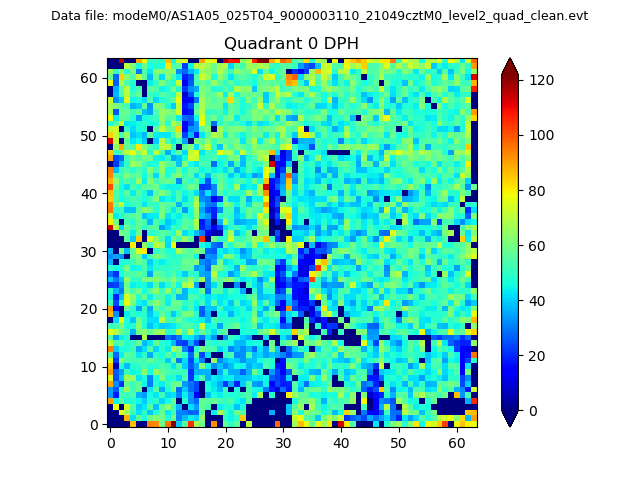 |
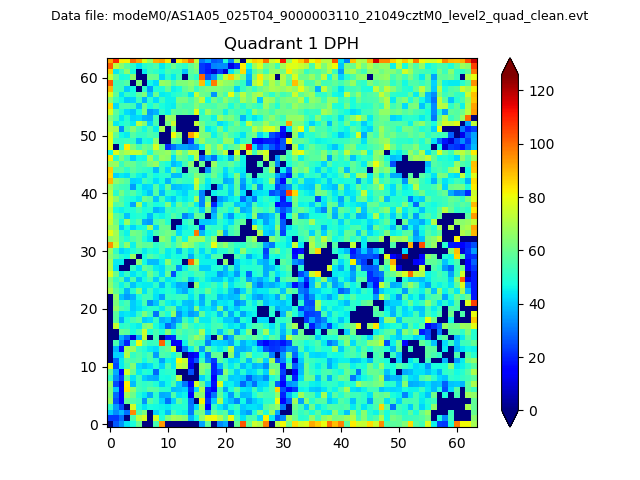 |
Quadrant B |
|---|---|---|---|
| Quadrant D | 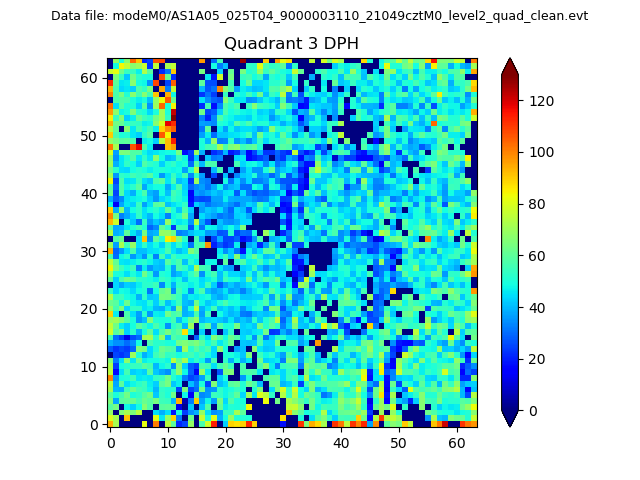 |
 |
Quadrant C |
| Plot type | Count rate plots | Images |
|---|---|---|
| Comparison with Poisson distribution Blue bars denote a histogram of data divided into 1 sec bins. Red curve is a Poisson curve with rate = median count rate of data. |
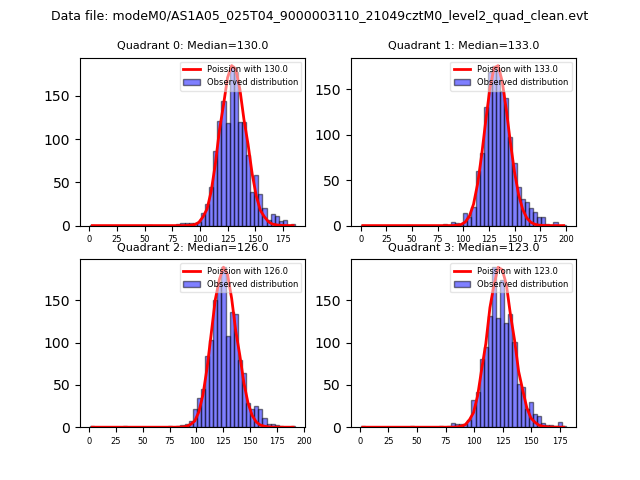 |
 |
| Quadrant-wise count rates Data is divided into 100 sec bins |
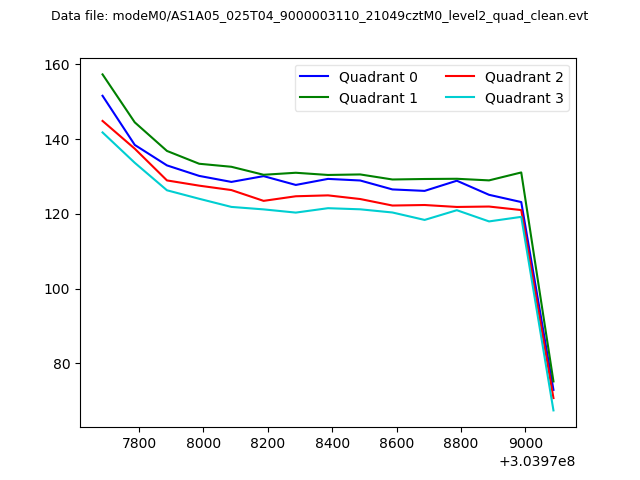 |
|
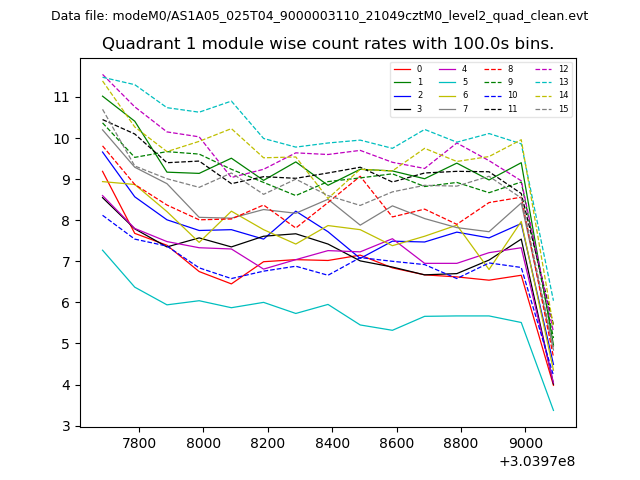
| Module-wise count rates for Quadrant A Data is divided into 100 sec bins |
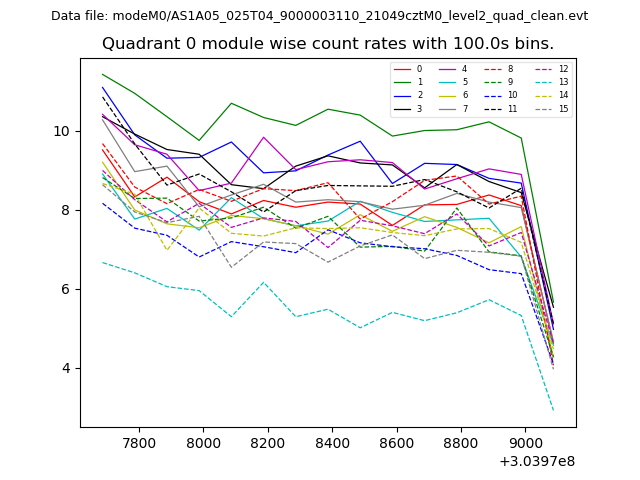 |
 |
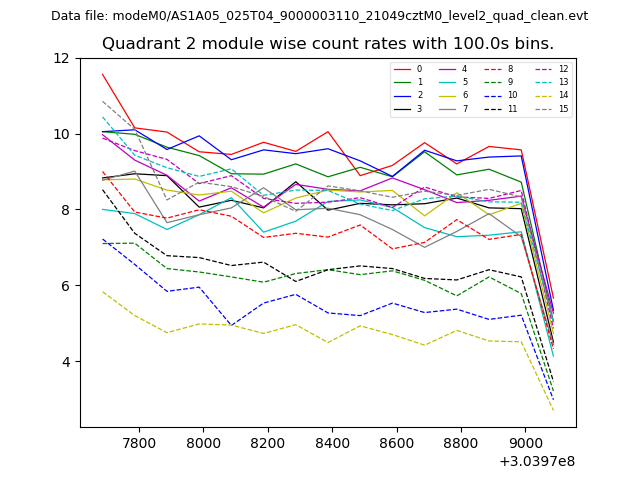
| Module-wise count rates for Quadrant B Data is divided into 100 sec bins |
 |
 |
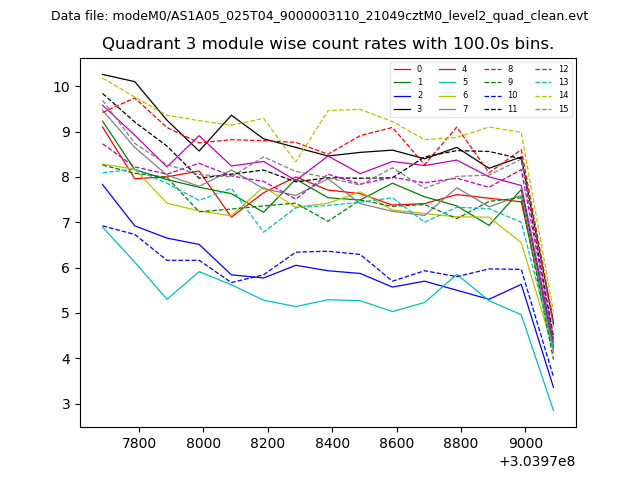
| Module-wise count rates for Quadrant C Data is divided into 100 sec bins |
 |
 |
| Module-wise count rates for Quadrant D Data is divided into 100 sec bins |
 |
 |
| Parameter | Plot |
|---|---|
| CZT HV Monitor | 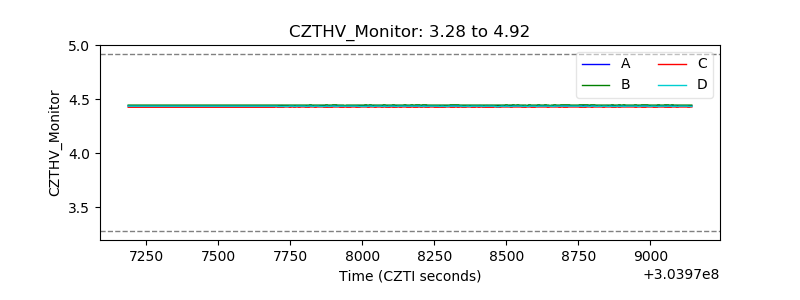 |
| D_VDD | 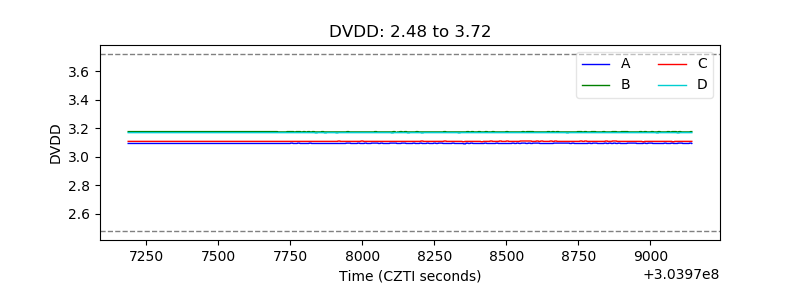 |
| Temperature 1 | 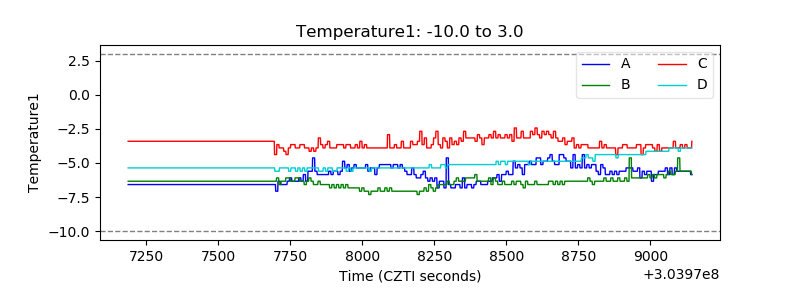 |
| Veto HV Monitor |  |
| Veto LLD | 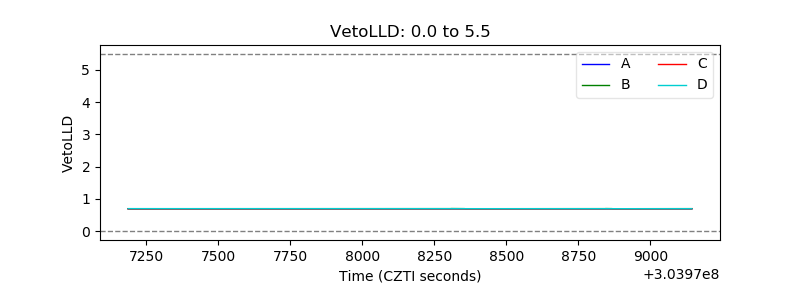 |
| Alpha Counter | 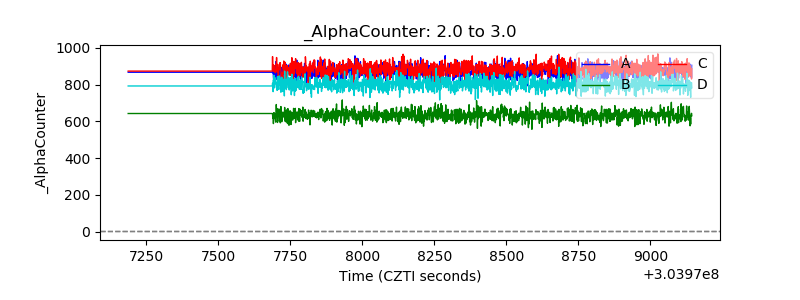 |
| _CPM_Rate | 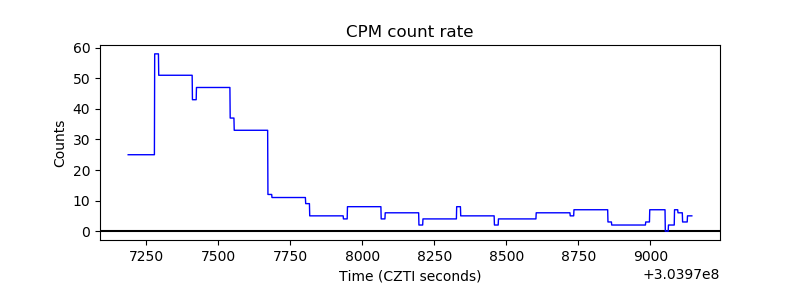 |
| CZT Counter |  |
| +2.5 Volts monitor |  |
| +5 Volts monitor |  |
| _ROLL_ROT | 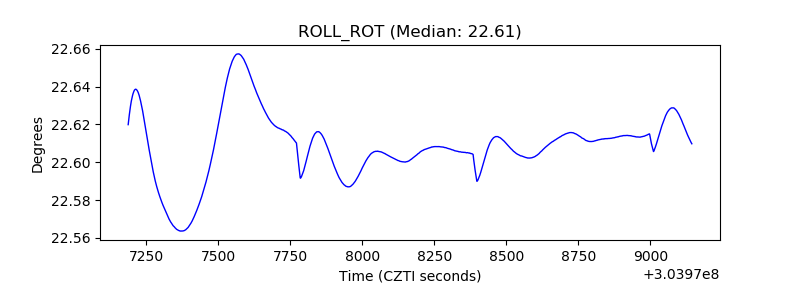 |
| _Roll_DEC | 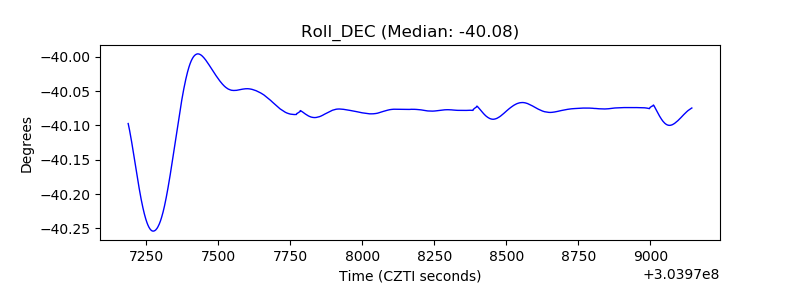 |
| _Roll_RA |  |
| Veto Counter | 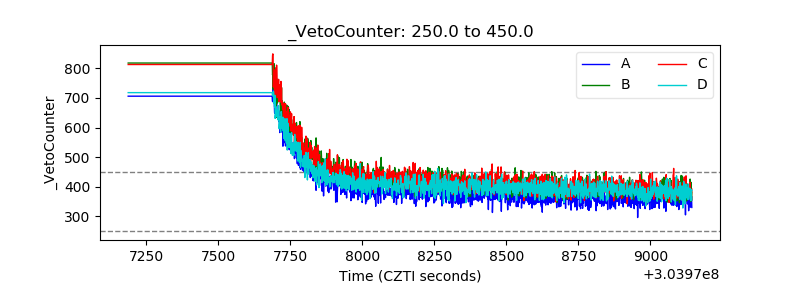 |