| Param | Original file | Final file |
|---|---|---|
| Filename | modeM0/AS1A05_025T04_9000003110_21051cztM0_level2.evt | modeM0/AS1A05_025T04_9000003110_21051cztM0_level2_quad_clean.evt |
| Size (bytes) | 466,879,680 | 96,226,560 |
| Size | 445.3 MB | 91.8 MB |
| Events in quadrant A | 3,169,841 | 614,681 |
| Events in quadrant B | 3,378,696 | 627,892 |
| Events in quadrant C | 3,193,848 | 605,381 |
| Events in quadrant D | 3,927,132 | 584,608 |
| Mode M9 | |||
|---|---|---|---|
| Quadrant | BADHDUFLAG | Total packets | Discarded packets |
| A | 0 | 2 | 0 |
| B | 0 | 2 | 0 |
| C | 0 | 2 | 0 |
| D | 0 | 2 | 0 |
| Mode SS | |||
|---|---|---|---|
| Quadrant | BADHDUFLAG | Total packets | Discarded packets |
| A | 0 | 142 | 0 |
| B | 0 | 142 | 0 |
| C | 0 | 142 | 0 |
| D | 0 | 142 | 0 |
| Mode M0 | |||
|---|---|---|---|
| Quadrant | BADHDUFLAG | Total packets | Discarded packets |
| A | 0 | 14104 | 2 |
| B | 0 | 14538 | 2 |
| C | 0 | 14066 | 2 |
| D | 0 | 16380 | 2 |
| Quadrant | Total seconds | Saturated seconds | Saturation percentage |
|---|---|---|---|
| A | 6903 | 119 | 1.723888% |
| B | 6904 | 149 | 2.158169% |
| C | 6904 | 149 | 2.158169% |
| D | 6903 | 143 | 2.071563% |
Noise dominated data is calculated using 1-second bins in cleaned event files. If a bin has >2000 counts, and if more than 50% of those come from <1% of pixels, then it is considered to be noise-dominated and hence unusable.
| Quadrant | # 1 sec bins | Bins with >0 counts | Bins with >2000 counts | High rate bins dominated by noise | Noise dominated (total time) | Noise dominated (detector-on time) | Marked lightcurve |
|---|---|---|---|---|---|---|---|
| A | 7178 | 6905 | 0 | 0 | 0.00% | 0.00% |  |
| B | 7179 | 6906 | 15 | 15 | 0.21% | 0.22% |  |
| C | 7179 | 6906 | 0 | 0 | 0.00% | 0.00% | 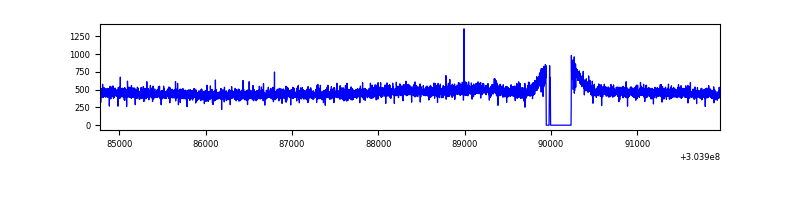 |
| D | 7178 | 6905 | 47 | 47 | 0.65% | 0.68% | 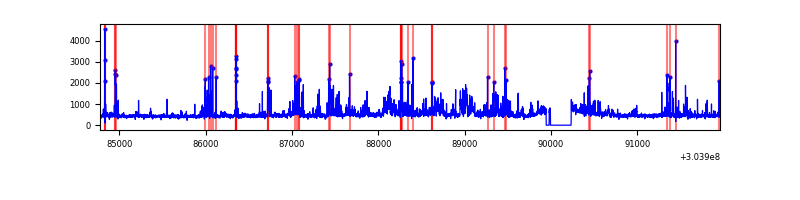 |
Top three noisy pixels from each quadrant. If the there are fewer than three noisy pixels in the level2.evt file, extra rows are filled as -1
| Pixel properties | Quadrant properties | ||||||
|---|---|---|---|---|---|---|---|
| Quadrant | DetID | PixID | Counts | Sigma | Mean | Median | Sigma |
| A | 13 | 252 | 24835 | 145.81 | 816 | 799 | 164.8 |
| A | 13 | 254 | 9754 | 54.32 | 816 | 799 | 164.8 |
| A | 0 | 226 | 7073 | 38.06 | 816 | 799 | 164.8 |
| B | 7 | 220 | 70985 | 450.06 | 811 | 790 | 156.0 |
| B | 3 | 64 | 36483 | 228.85 | 811 | 790 | 156.0 |
| B | 0 | 190 | 24269 | 150.54 | 811 | 790 | 156.0 |
| C | 14 | 238 | 123227 | 664.64 | 786 | 791 | 184.2 |
| C | 3 | 9 | 5881 | 27.63 | 786 | 791 | 184.2 |
| C | 13 | 61 | 5477 | 25.44 | 786 | 791 | 184.2 |
| D | 1 | 52 | 767906 | 3961.27 | 797 | 774 | 193.7 |
| D | 1 | 239 | 49828 | 253.3 | 797 | 774 | 193.7 |
| D | 13 | 172 | 32801 | 165.38 | 797 | 774 | 193.7 |
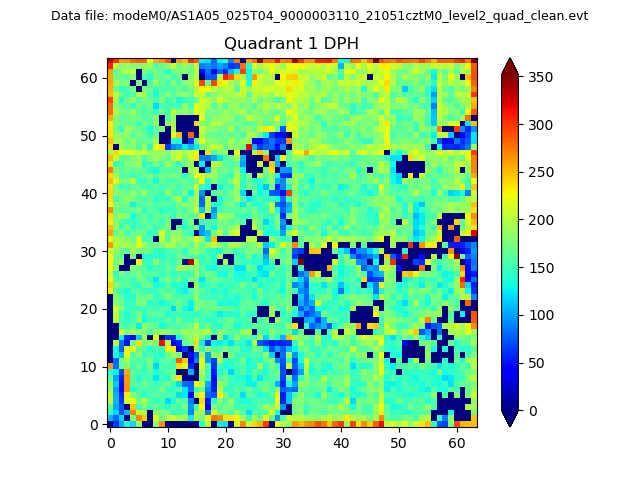
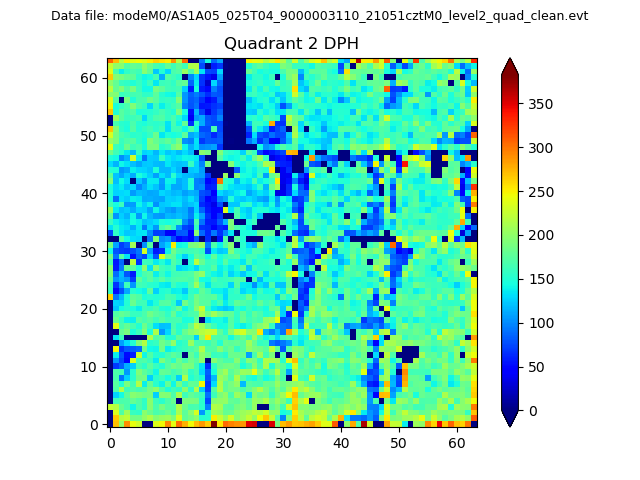
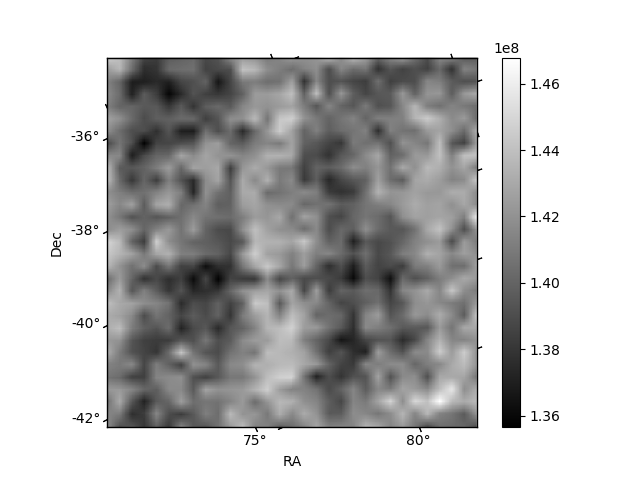
Histogram calculated using DETX and DETY for each event in the final _common_clean file
| Quadrant A | 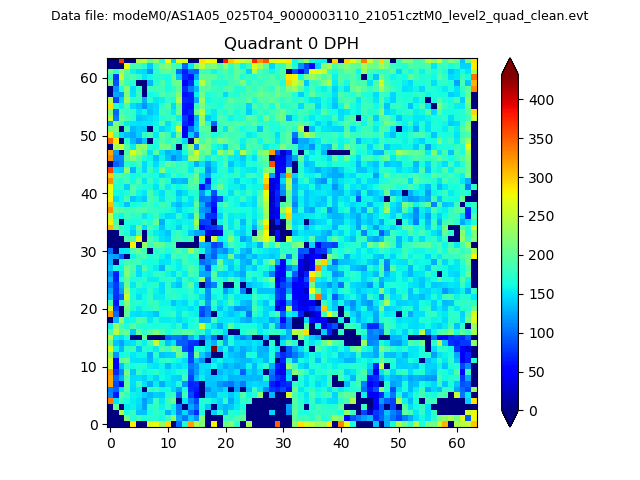 |
 |
Quadrant B |
|---|---|---|---|
| Quadrant D | 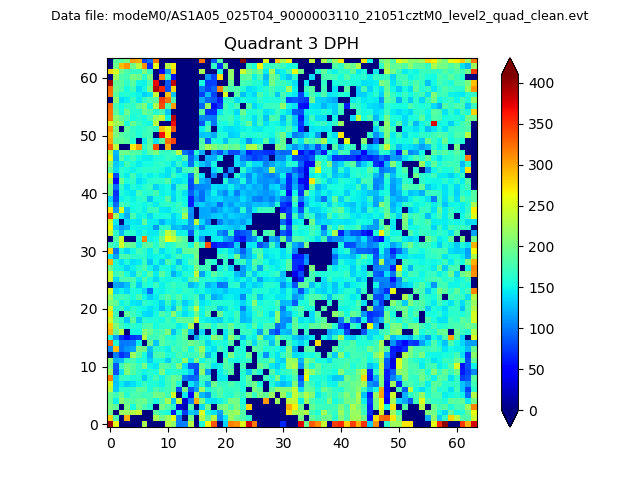 |
 |
Quadrant C |
| Plot type | Count rate plots | Images |
|---|---|---|
| Comparison with Poisson distribution Blue bars denote a histogram of data divided into 1 sec bins. Red curve is a Poisson curve with rate = median count rate of data. |
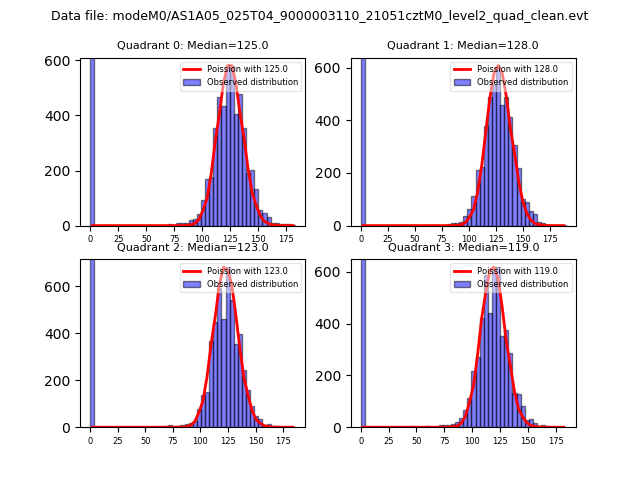 |
 |
| Quadrant-wise count rates Data is divided into 100 sec bins |
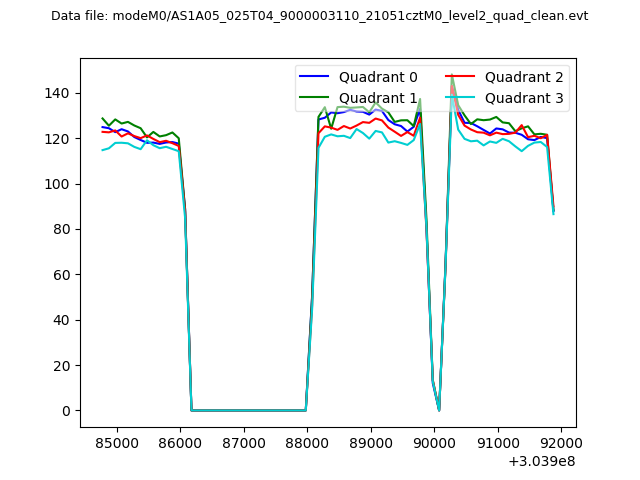 |
|
| Module-wise count rates for Quadrant A Data is divided into 100 sec bins |
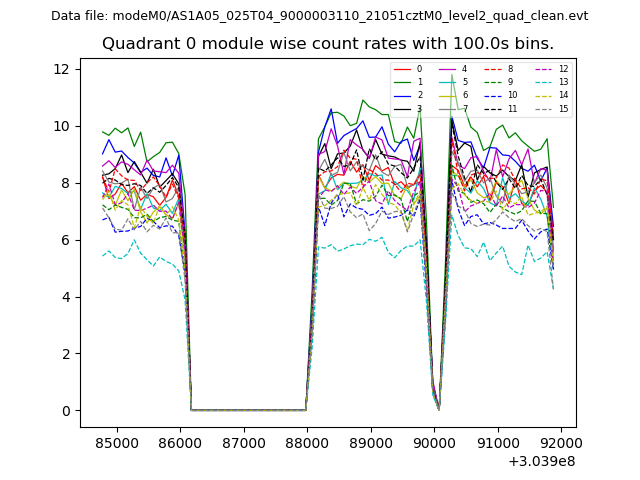 |
 |
| Module-wise count rates for Quadrant B Data is divided into 100 sec bins |
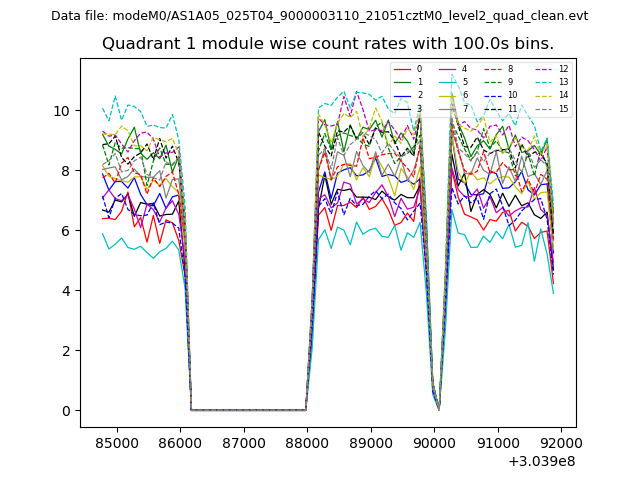 |
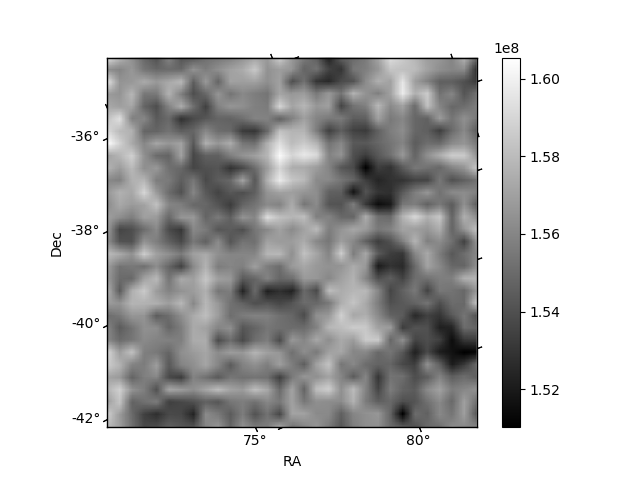 |
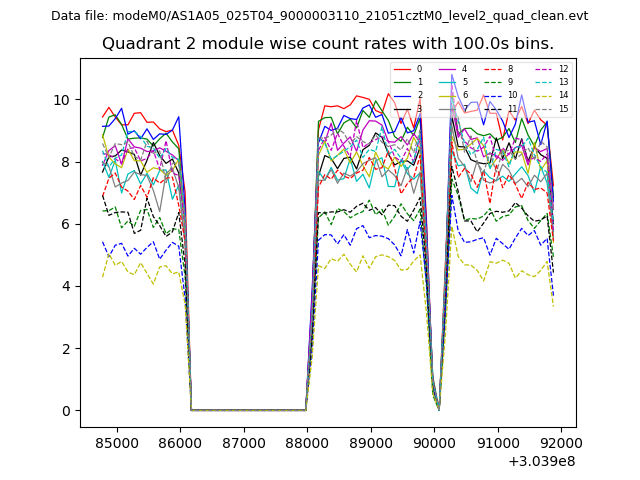
| Module-wise count rates for Quadrant C Data is divided into 100 sec bins |
 |
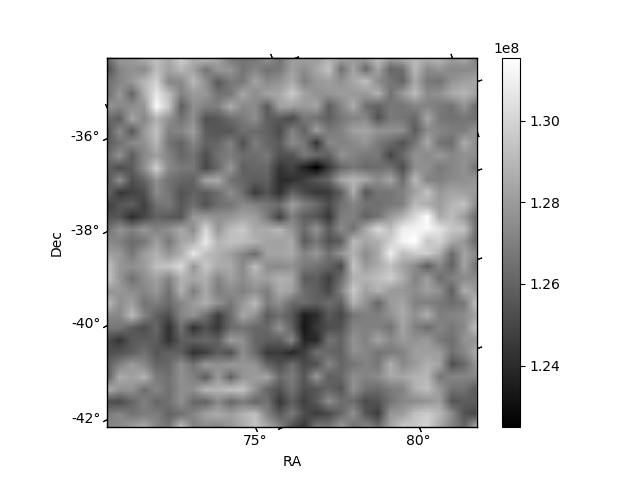 |
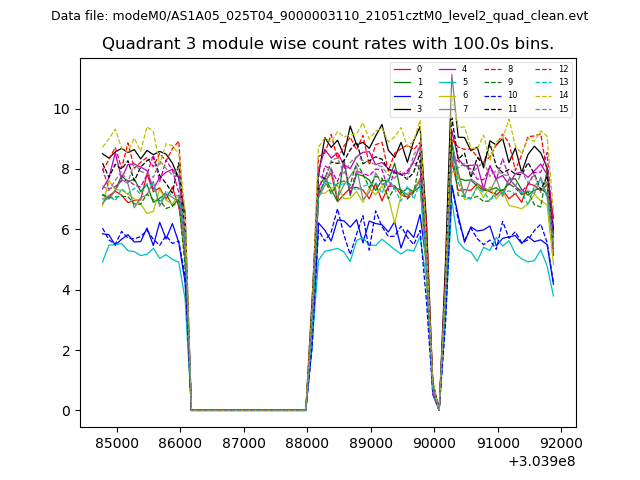
| Module-wise count rates for Quadrant D Data is divided into 100 sec bins |
 |
 |
| Parameter | Plot |
|---|---|
| CZT HV Monitor | 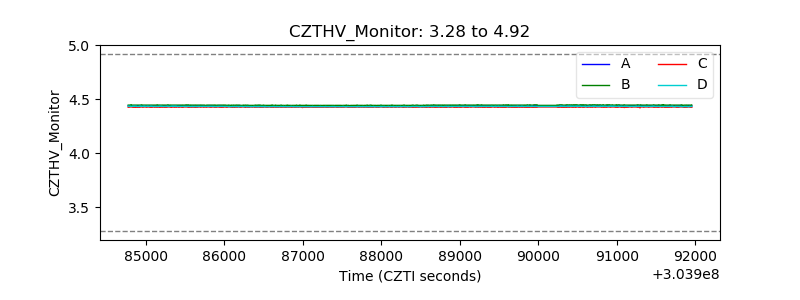 |
| D_VDD | 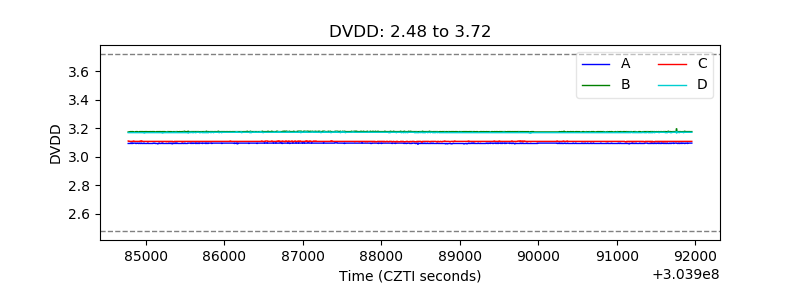 |
| Temperature 1 | 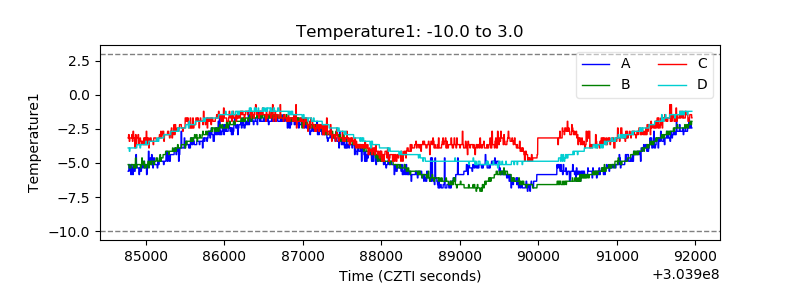 |
| Veto HV Monitor | 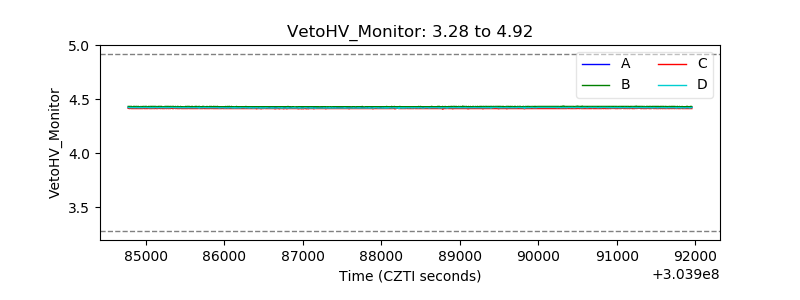 |
| Veto LLD | 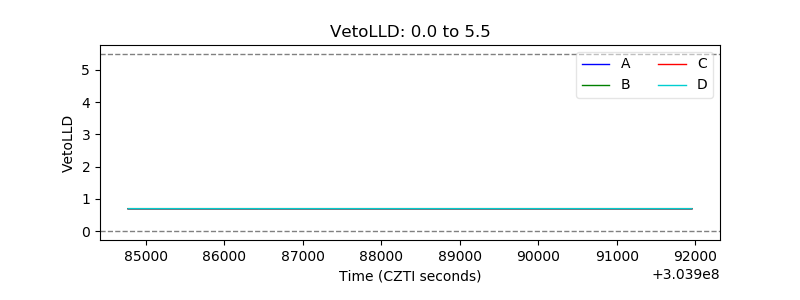 |
| Alpha Counter | 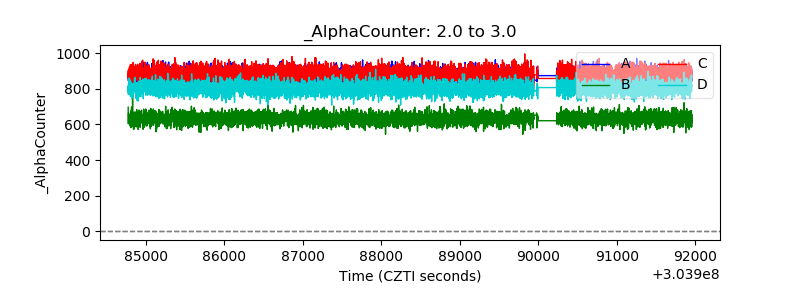 |
| _CPM_Rate | 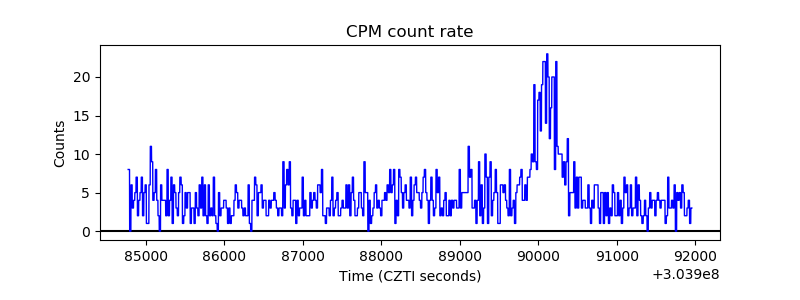 |
| CZT Counter | 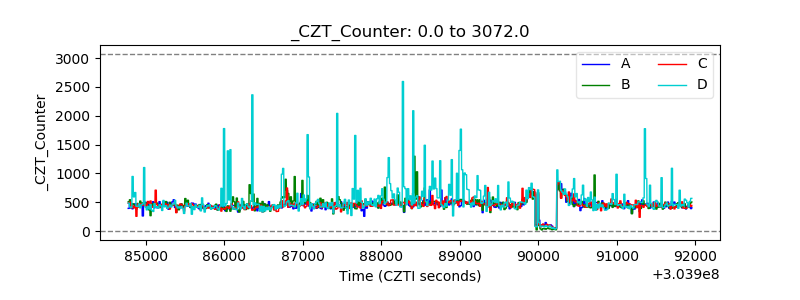 |
| +2.5 Volts monitor |  |
| +5 Volts monitor |  |
| _ROLL_ROT | 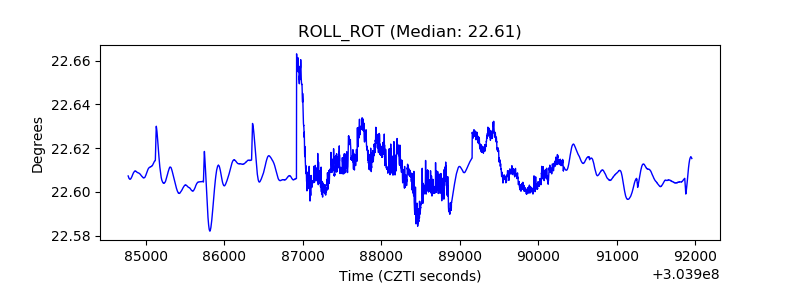 |
| _Roll_DEC | 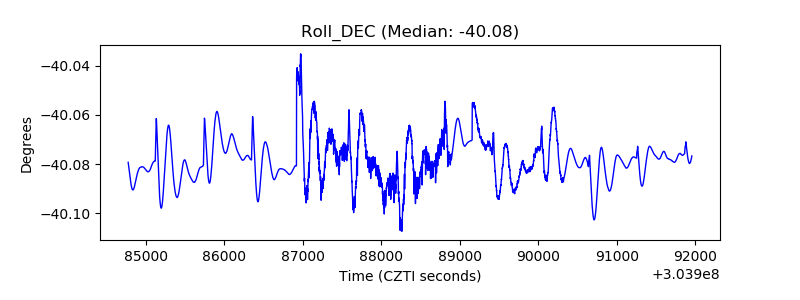 |
| _Roll_RA | 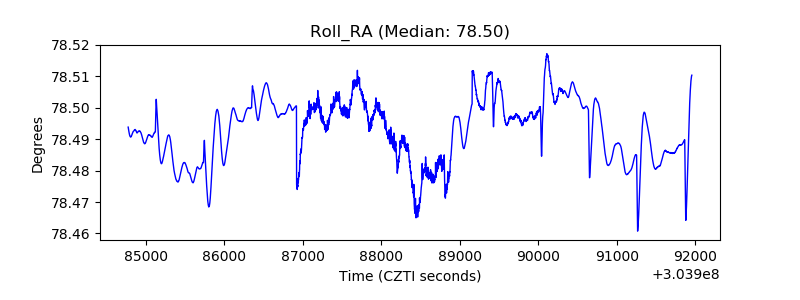 |
| Veto Counter | 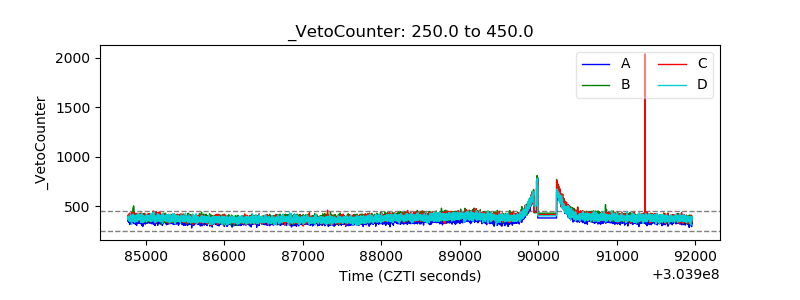 |