| Param | Original file | Final file |
|---|---|---|
| Filename | modeM0/AS1A05_025T04_9000003110_21054cztM0_level2.evt | modeM0/AS1A05_025T04_9000003110_21054cztM0_level2_quad_clean.evt |
| Size (bytes) | 1,282,754,880 | 217,005,120 |
| Size | 1.2 GB | 207.0 MB |
| Events in quadrant A | 8,154,297 | 1,358,456 |
| Events in quadrant B | 9,412,882 | 1,380,472 |
| Events in quadrant C | 8,219,320 | 1,329,866 |
| Events in quadrant D | 11,862,941 | 1,280,947 |
| Mode M9 | |||
|---|---|---|---|
| Quadrant | BADHDUFLAG | Total packets | Discarded packets |
| A | 0 | 20 | 0 |
| B | 0 | 20 | 0 |
| C | 0 | 20 | 0 |
| D | 0 | 20 | 0 |
| Mode SS | |||
|---|---|---|---|
| Quadrant | BADHDUFLAG | Total packets | Discarded packets |
| A | 0 | 360 | 0 |
| B | 0 | 360 | 0 |
| C | 0 | 360 | 0 |
| D | 0 | 360 | 0 |
| Mode M0 | |||
|---|---|---|---|
| Quadrant | BADHDUFLAG | Total packets | Discarded packets |
| A | 0 | 36111 | 3 |
| B | 0 | 39271 | 3 |
| C | 0 | 36079 | 3 |
| D | 0 | 47234 | 3 |
| Quadrant | Total seconds | Saturated seconds | Saturation percentage |
|---|---|---|---|
| A | 17738 | 194 | 1.093697% |
| B | 17739 | 362 | 2.040701% |
| C | 17739 | 257 | 1.448785% |
| D | 17738 | 1004 | 5.660165% |
Noise dominated data is calculated using 1-second bins in cleaned event files. If a bin has >2000 counts, and if more than 50% of those come from <1% of pixels, then it is considered to be noise-dominated and hence unusable.
| Quadrant | # 1 sec bins | Bins with >0 counts | Bins with >2000 counts | High rate bins dominated by noise | Noise dominated (total time) | Noise dominated (detector-on time) | Marked lightcurve |
|---|---|---|---|---|---|---|---|
| A | 19608 | 17740 | 0 | 0 | 0.00% | 0.00% | 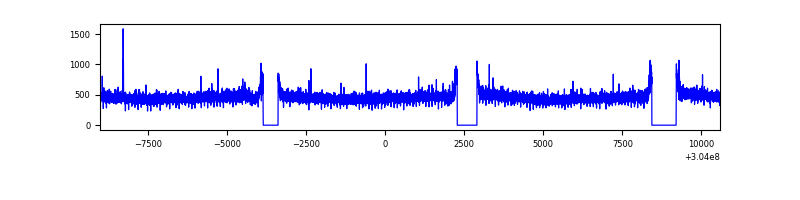 |
| B | 19609 | 17741 | 88 | 88 | 0.45% | 0.50% | 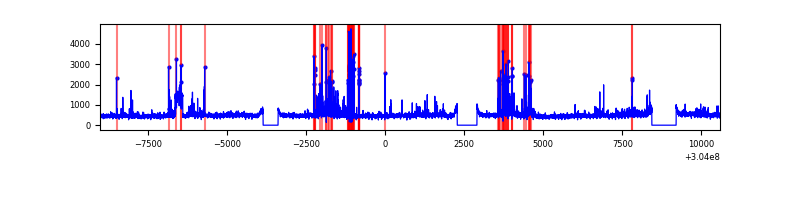 |
| C | 19609 | 17742 | 0 | 0 | 0.00% | 0.00% | 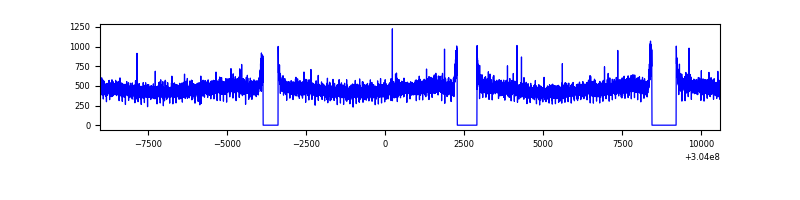 |
| D | 19608 | 17741 | 737 | 737 | 3.76% | 4.15% | 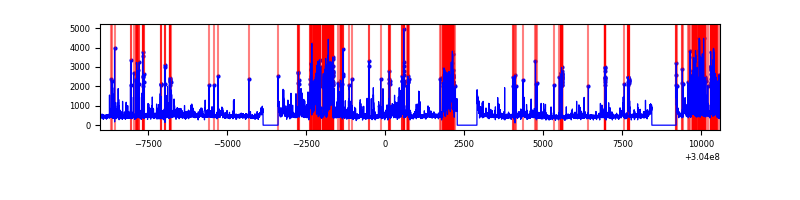 |
Top three noisy pixels from each quadrant. If the there are fewer than three noisy pixels in the level2.evt file, extra rows are filled as -1
| Pixel properties | Quadrant properties | ||||||
|---|---|---|---|---|---|---|---|
| Quadrant | DetID | PixID | Counts | Sigma | Mean | Median | Sigma |
| A | 13 | 252 | 32311 | 71.87 | 2106 | 2063 | 420.9 |
| A | 13 | 254 | 25489 | 55.66 | 2106 | 2063 | 420.9 |
| A | 0 | 226 | 17990 | 37.84 | 2106 | 2063 | 420.9 |
| B | 7 | 220 | 424436 | 1067.07 | 2091 | 2035 | 395.9 |
| B | 7 | 205 | 226957 | 568.2 | 2091 | 2035 | 395.9 |
| B | 0 | 228 | 148708 | 370.52 | 2091 | 2035 | 395.9 |
| C | 14 | 238 | 316920 | 666.58 | 2024 | 2035 | 472.4 |
| C | 3 | 9 | 16709 | 31.06 | 2024 | 2035 | 472.4 |
| C | 13 | 61 | 14192 | 25.73 | 2024 | 2035 | 472.4 |
| D | 1 | 52 | 2132971 | 4352.54 | 2024 | 1964 | 489.6 |
| D | 7 | 238 | 1677695 | 3422.65 | 2024 | 1964 | 489.6 |
| D | 13 | 172 | 107538 | 215.63 | 2024 | 1964 | 489.6 |
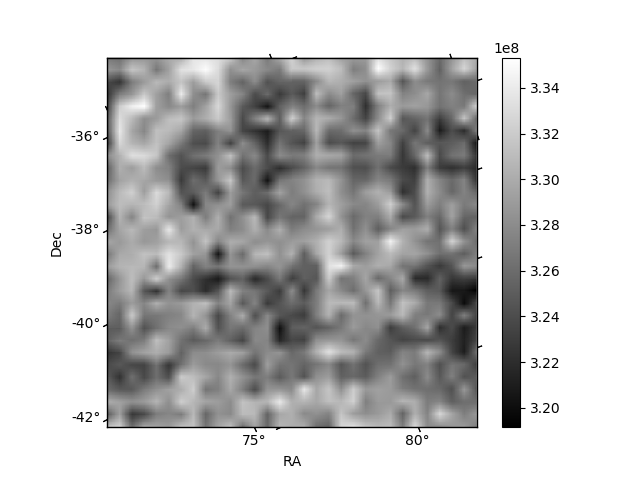
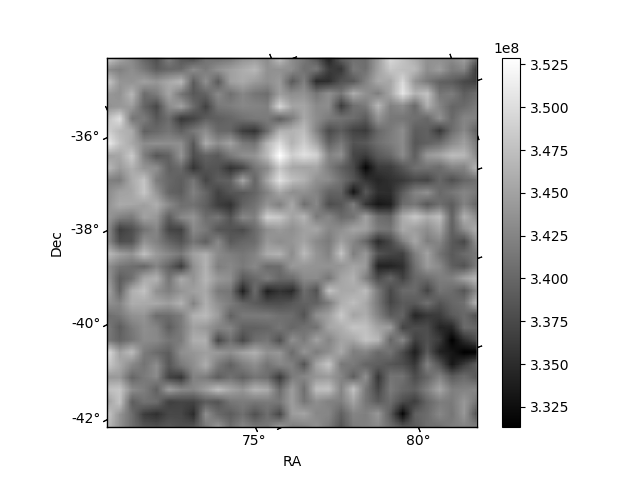
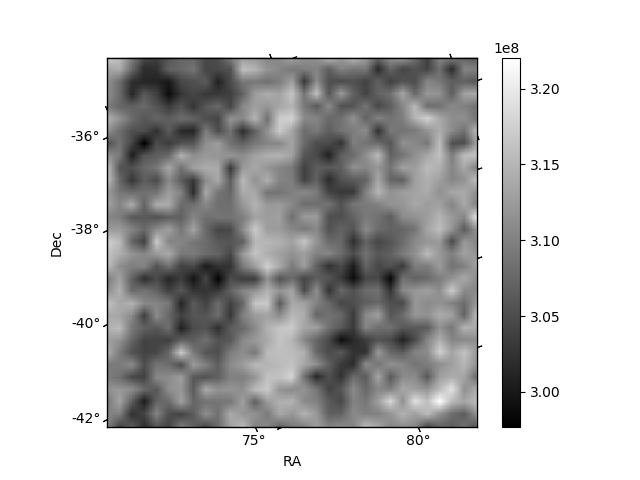
Histogram calculated using DETX and DETY for each event in the final _common_clean file
| Quadrant A | 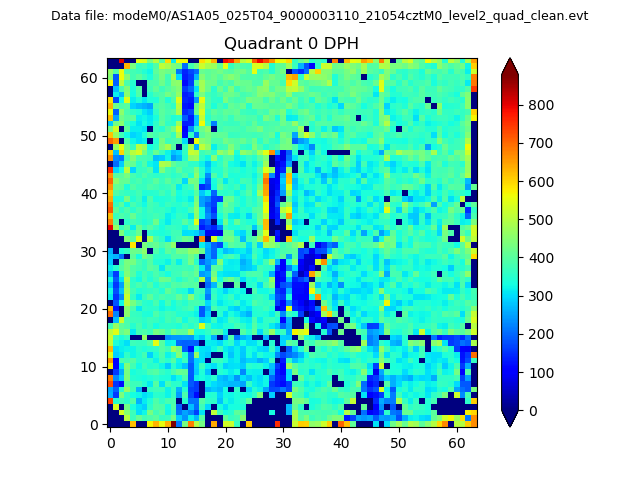 |
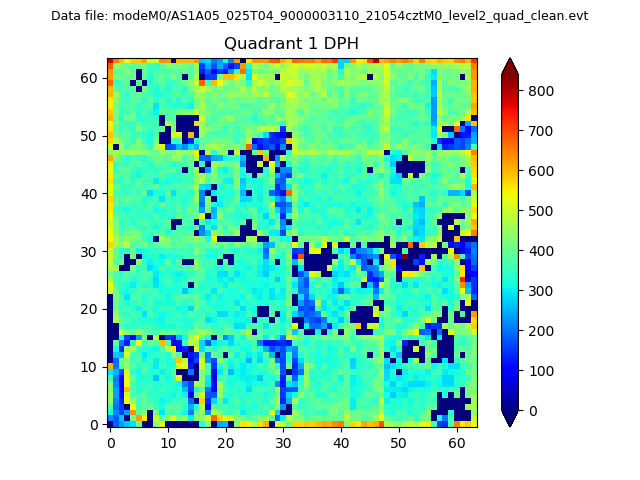 |
Quadrant B |
|---|---|---|---|
| Quadrant D | 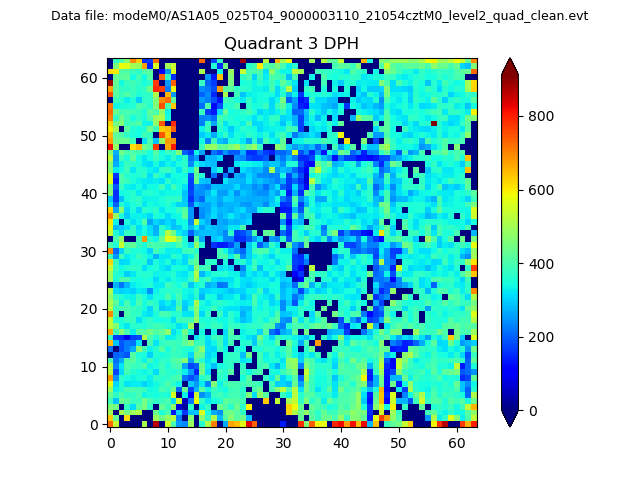 |
 |
Quadrant C |
| Plot type | Count rate plots | Images |
|---|---|---|
| Comparison with Poisson distribution Blue bars denote a histogram of data divided into 1 sec bins. Red curve is a Poisson curve with rate = median count rate of data. |
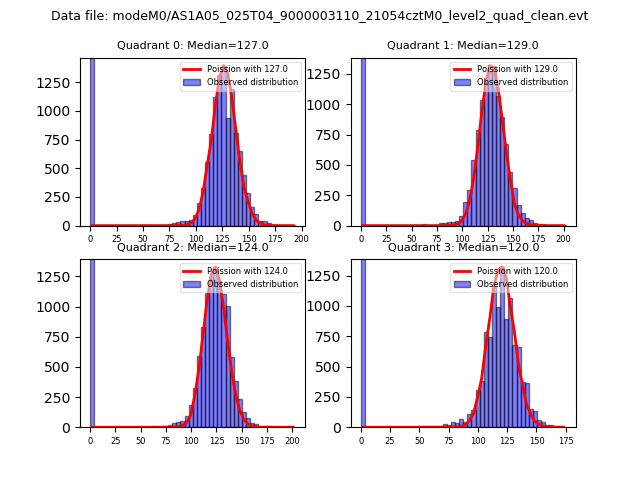 |
 |
| Quadrant-wise count rates Data is divided into 100 sec bins |
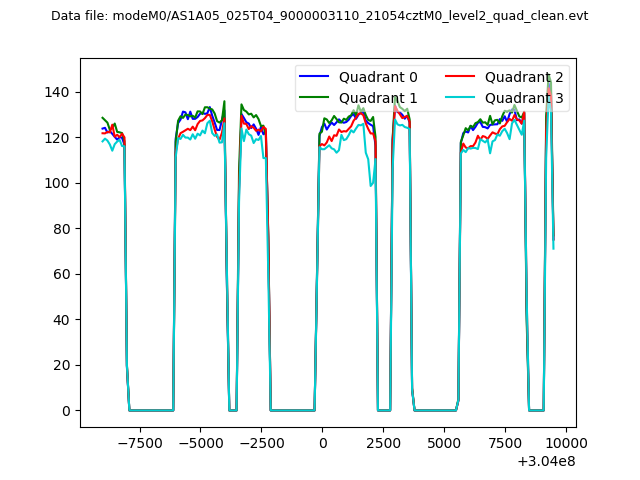 |
|
| Module-wise count rates for Quadrant A Data is divided into 100 sec bins |
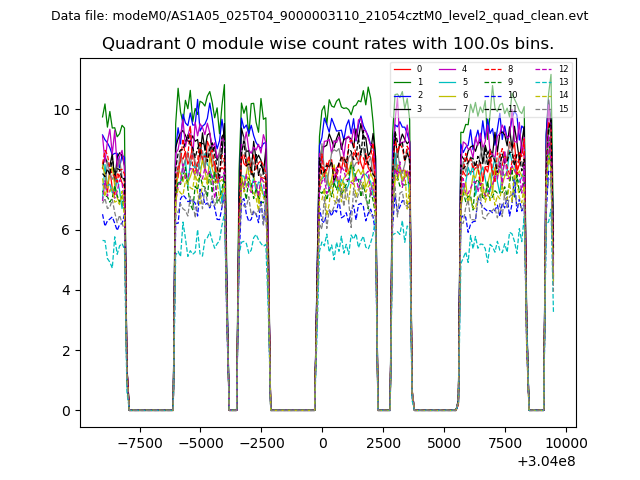 |
 |
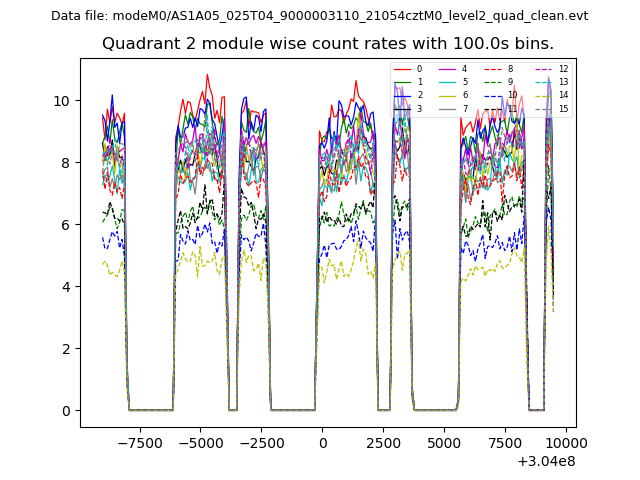
| Module-wise count rates for Quadrant B Data is divided into 100 sec bins |
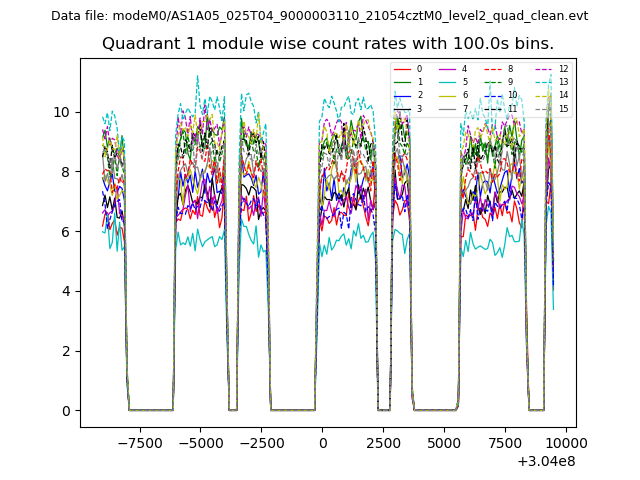 |
 |
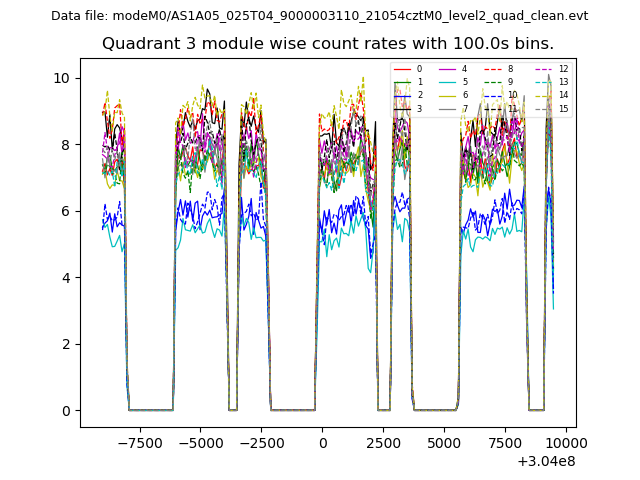
| Module-wise count rates for Quadrant C Data is divided into 100 sec bins |
 |
 |
| Module-wise count rates for Quadrant D Data is divided into 100 sec bins |
 |
 |
| Parameter | Plot |
|---|---|
| CZT HV Monitor | 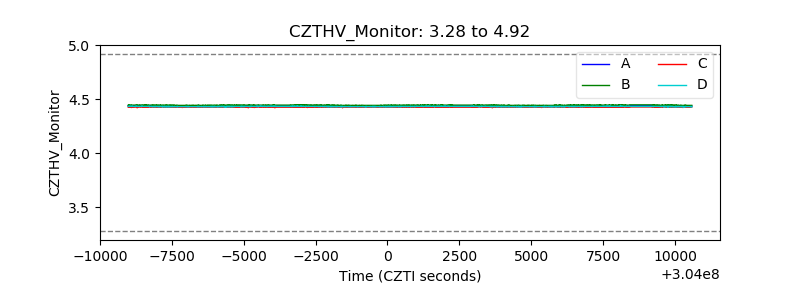 |
| D_VDD |  |
| Temperature 1 | 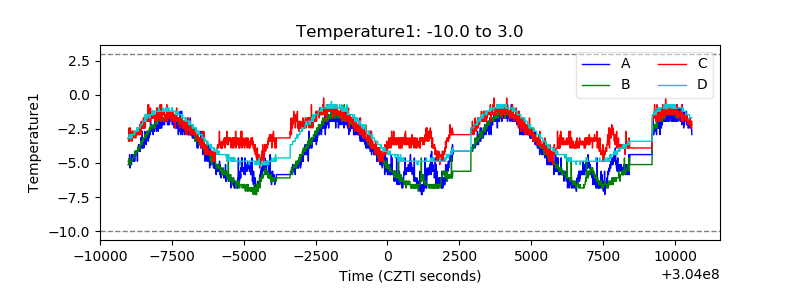 |
| Veto HV Monitor | 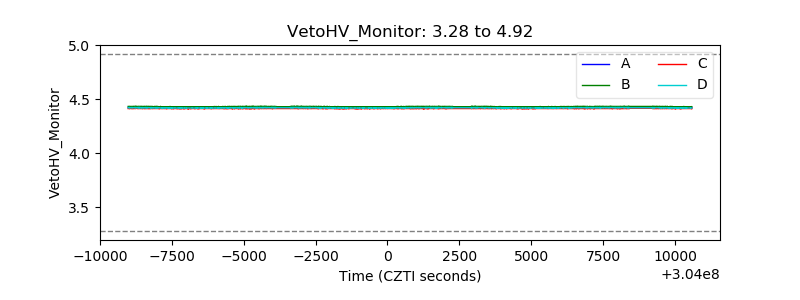 |
| Veto LLD | 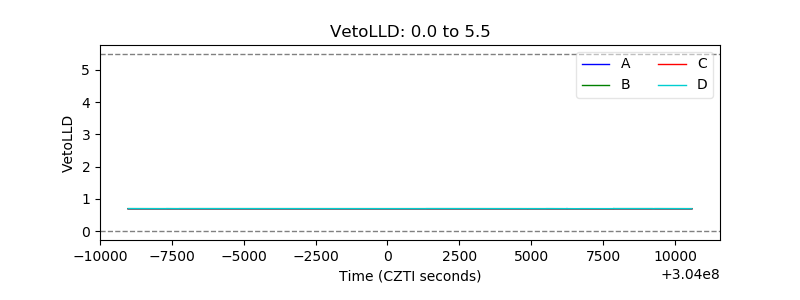 |
| Alpha Counter | 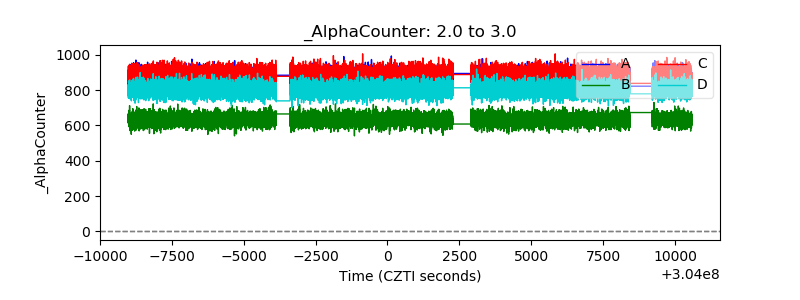 |
| _CPM_Rate | 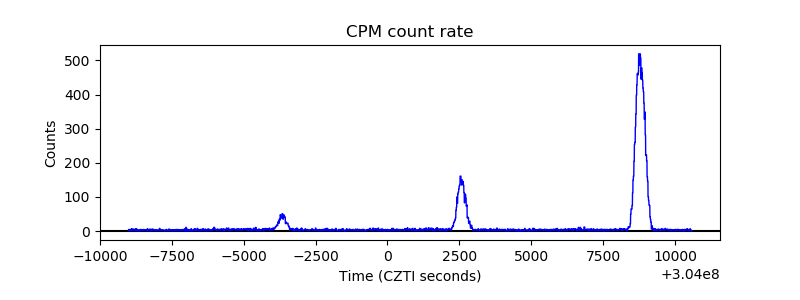 |
| CZT Counter | 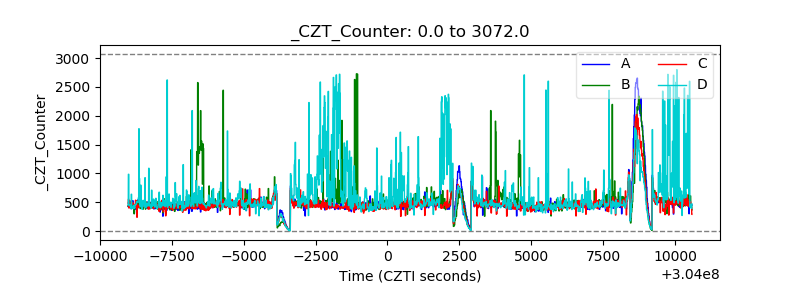 |
| +2.5 Volts monitor |  |
| +5 Volts monitor |  |
| _ROLL_ROT | 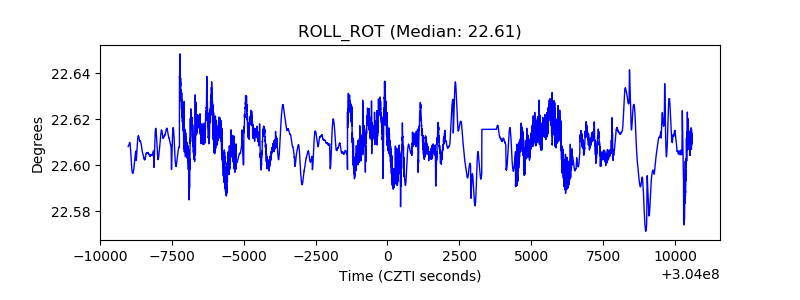 |
| _Roll_DEC | 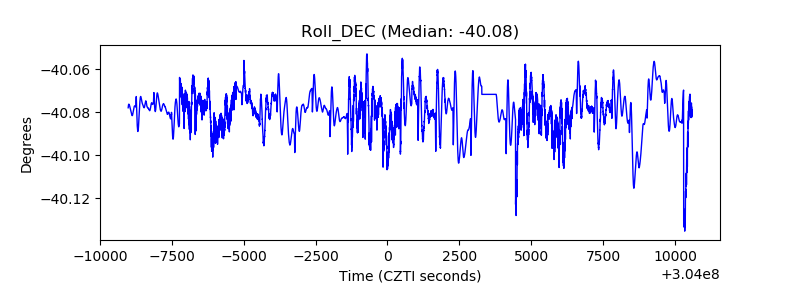 |
| _Roll_RA | 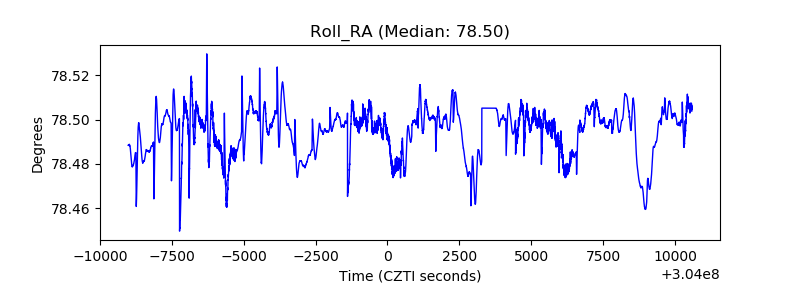 |
| Veto Counter | 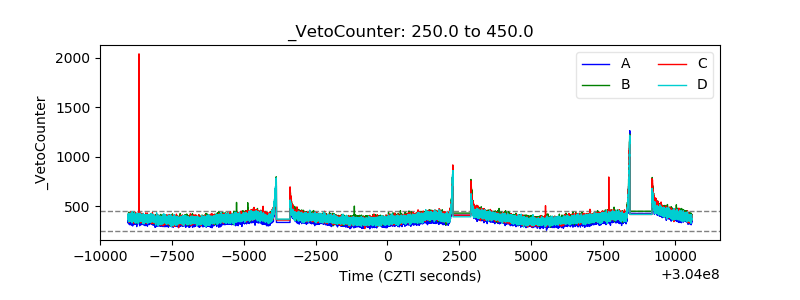 |