| Param | Original file | Final file |
|---|---|---|
| Filename | modeM0/AS1A05_025T04_9000003110_21055cztM0_level2.evt | modeM0/AS1A05_025T04_9000003110_21055cztM0_level2_quad_clean.evt |
| Size (bytes) | 531,996,480 | 70,859,520 |
| Size | 507.4 MB | 67.6 MB |
| Events in quadrant A | 3,206,271 | 431,922 |
| Events in quadrant B | 3,551,330 | 435,320 |
| Events in quadrant C | 3,211,881 | 414,433 |
| Events in quadrant D | 5,683,996 | 393,063 |
| Mode M9 | |||
|---|---|---|---|
| Quadrant | BADHDUFLAG | Total packets | Discarded packets |
| A | 0 | 13 | 0 |
| B | 0 | 14 | 0 |
| C | 0 | 14 | 0 |
| D | 0 | 14 | 0 |
| Mode SS | |||
|---|---|---|---|
| Quadrant | BADHDUFLAG | Total packets | Discarded packets |
| A | 0 | 136 | 0 |
| B | 0 | 136 | 0 |
| C | 0 | 136 | 0 |
| D | 0 | 136 | 0 |
| Mode M0 | |||
|---|---|---|---|
| Quadrant | BADHDUFLAG | Total packets | Discarded packets |
| A | 0 | 13920 | 2 |
| B | 0 | 14749 | 2 |
| C | 0 | 13858 | 2 |
| D | 0 | 21387 | 2 |
| Quadrant | Total seconds | Saturated seconds | Saturation percentage |
|---|---|---|---|
| A | 6755 | 53 | 0.784604% |
| B | 6755 | 70 | 1.036269% |
| C | 6755 | 75 | 1.110289% |
| D | 6755 | 636 | 9.415248% |
Noise dominated data is calculated using 1-second bins in cleaned event files. If a bin has >2000 counts, and if more than 50% of those come from <1% of pixels, then it is considered to be noise-dominated and hence unusable.
| Quadrant | # 1 sec bins | Bins with >0 counts | Bins with >2000 counts | High rate bins dominated by noise | Noise dominated (total time) | Noise dominated (detector-on time) | Marked lightcurve |
|---|---|---|---|---|---|---|---|
| A | 7740 | 6756 | 0 | 0 | 0.00% | 0.00% | 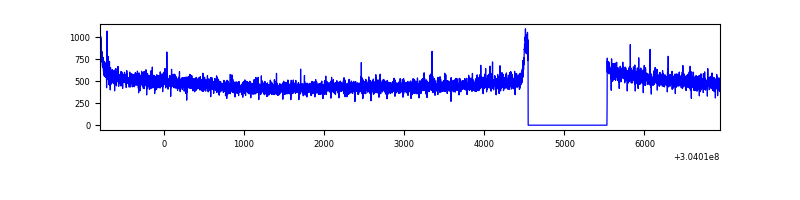 |
| B | 7740 | 6756 | 4 | 4 | 0.05% | 0.06% |  |
| C | 7740 | 6756 | 0 | 0 | 0.00% | 0.00% | 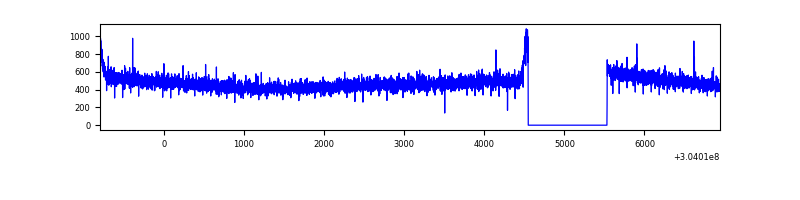 |
| D | 7740 | 6756 | 529 | 529 | 6.83% | 7.83% | 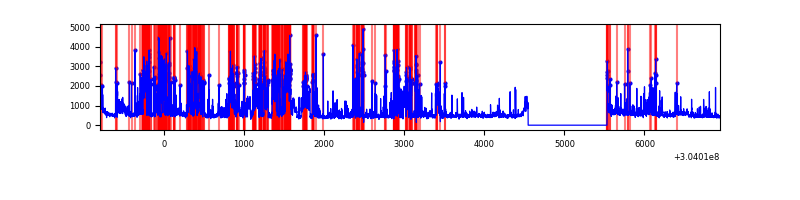 |
Top three noisy pixels from each quadrant. If the there are fewer than three noisy pixels in the level2.evt file, extra rows are filled as -1
| Pixel properties | Quadrant properties | ||||||
|---|---|---|---|---|---|---|---|
| Quadrant | DetID | PixID | Counts | Sigma | Mean | Median | Sigma |
| A | 13 | 254 | 8325 | 44.72 | 831 | 814 | 168.0 |
| A | 0 | 226 | 7324 | 38.76 | 831 | 814 | 168.0 |
| A | 12 | 96 | 6957 | 36.57 | 831 | 814 | 168.0 |
| B | 0 | 219 | 169212 | 1079.14 | 825 | 805 | 156.1 |
| B | 0 | 190 | 40637 | 255.24 | 825 | 805 | 156.1 |
| B | 7 | 220 | 29607 | 184.56 | 825 | 805 | 156.1 |
| C | 14 | 238 | 125729 | 678.95 | 788 | 792 | 184.0 |
| C | 3 | 9 | 10373 | 52.06 | 788 | 792 | 184.0 |
| C | 13 | 61 | 5560 | 25.91 | 788 | 792 | 184.0 |
| D | 1 | 52 | 2248264 | 12017.87 | 775 | 752 | 187.0 |
| D | 7 | 238 | 171396 | 912.47 | 775 | 752 | 187.0 |
| D | 12 | 233 | 168183 | 895.29 | 775 | 752 | 187.0 |
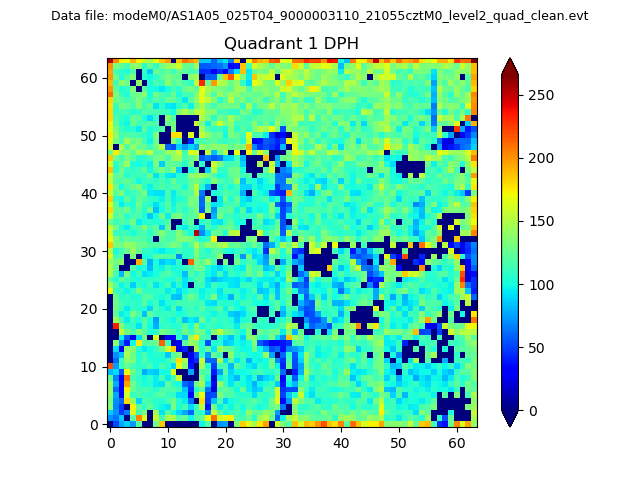
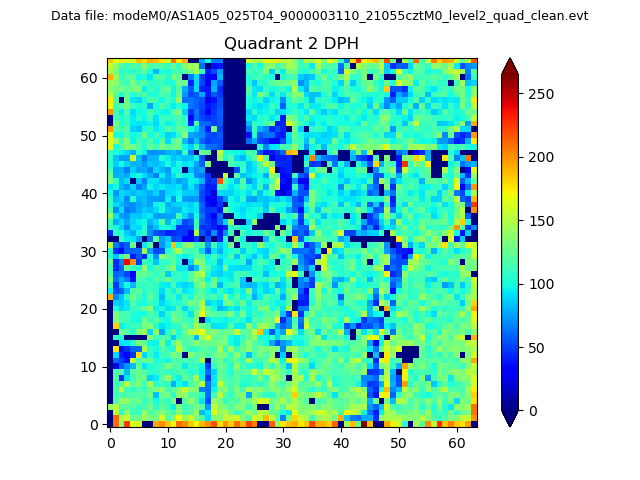
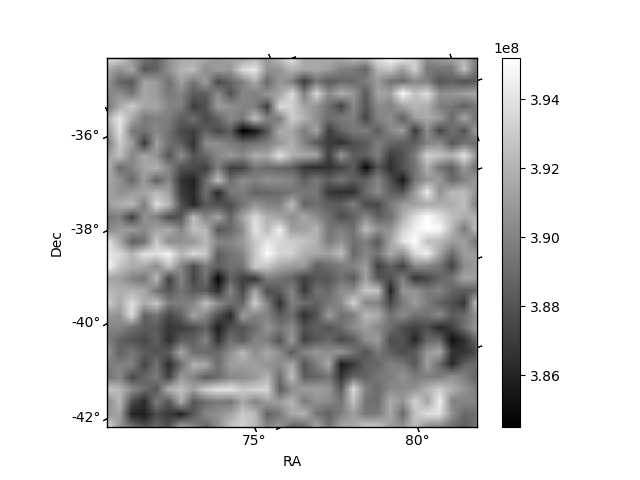
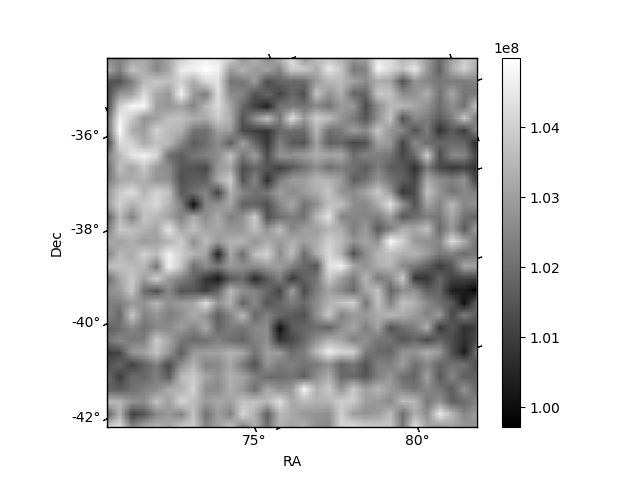
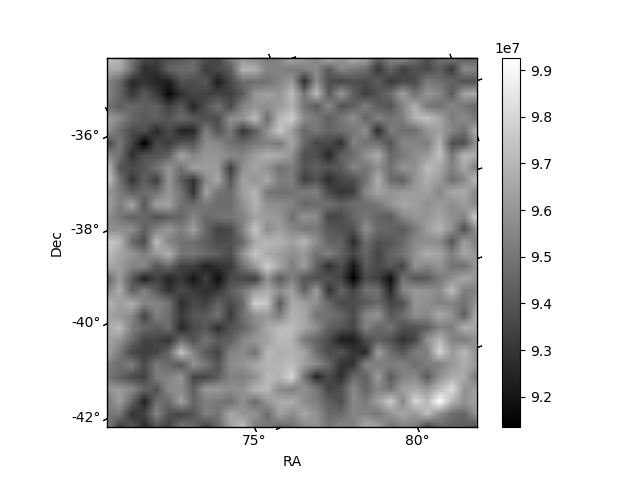
Histogram calculated using DETX and DETY for each event in the final _common_clean file
| Quadrant A | 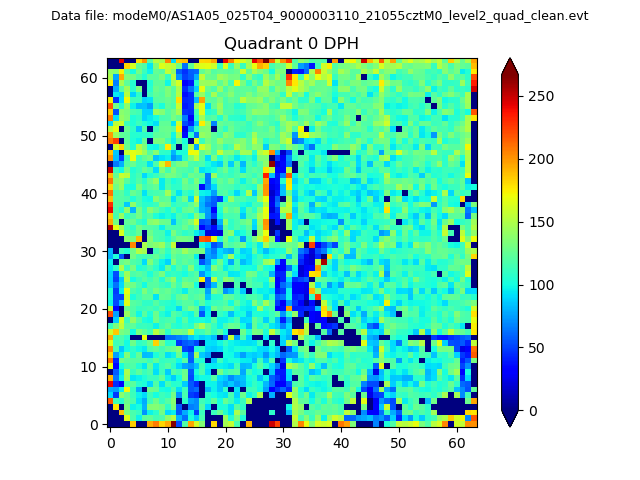 |
 |
Quadrant B |
|---|---|---|---|
| Quadrant D | 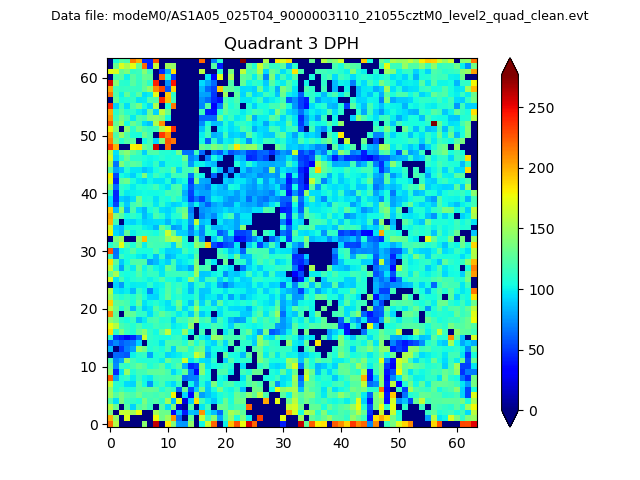 |
 |
Quadrant C |
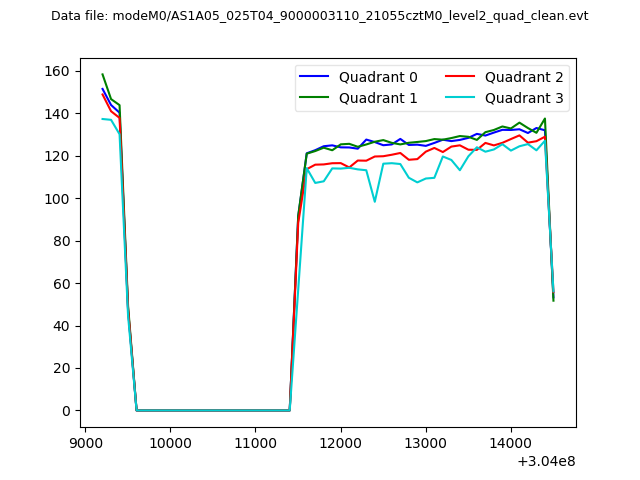
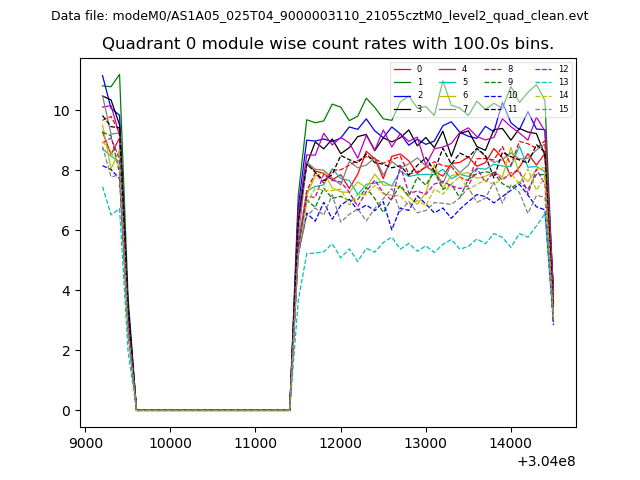
| Plot type | Count rate plots | Images |
|---|---|---|
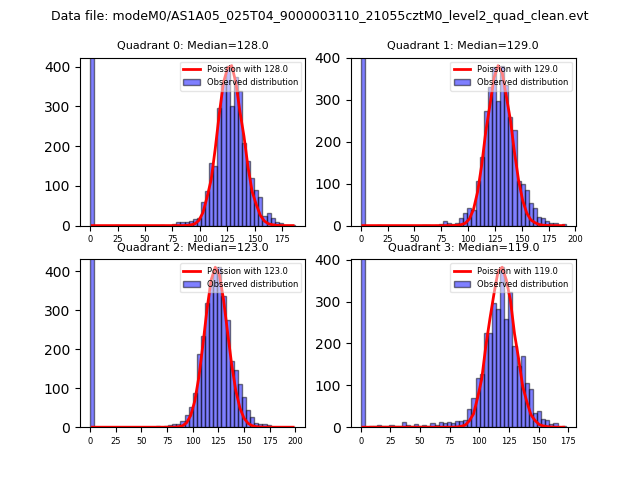
| Comparison with Poisson distribution Blue bars denote a histogram of data divided into 1 sec bins. Red curve is a Poisson curve with rate = median count rate of data. |
 |
 |
| Quadrant-wise count rates Data is divided into 100 sec bins |
 |
|
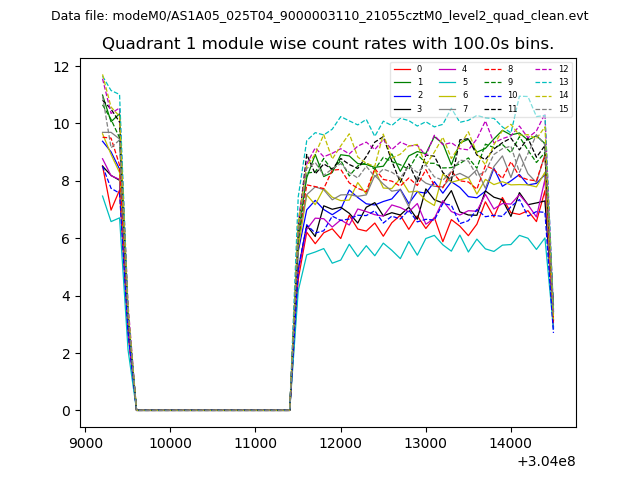
| Module-wise count rates for Quadrant A Data is divided into 100 sec bins |
 |
 |
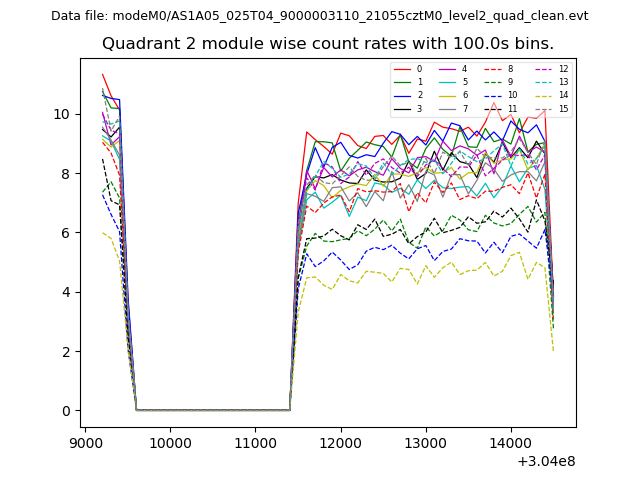
| Module-wise count rates for Quadrant B Data is divided into 100 sec bins |
 |
 |
| Module-wise count rates for Quadrant C Data is divided into 100 sec bins |
 |
 |
| Module-wise count rates for Quadrant D Data is divided into 100 sec bins |
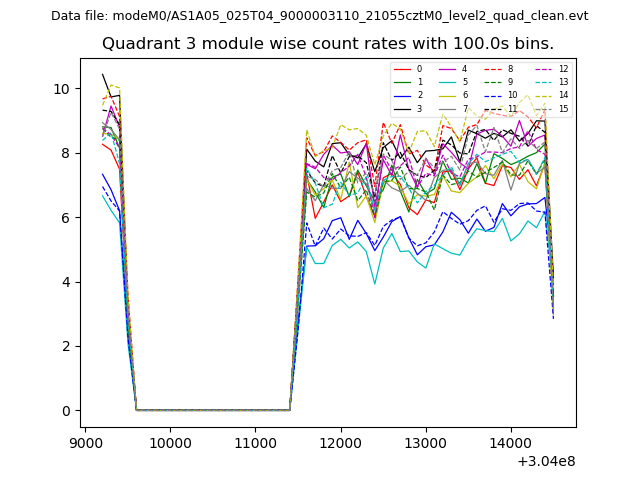 |
 |
| Parameter | Plot |
|---|---|
| CZT HV Monitor | 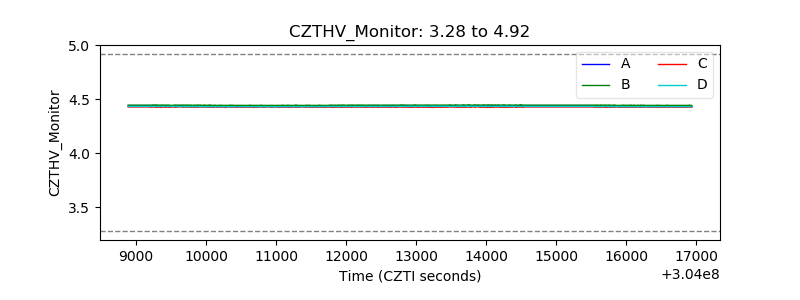 |
| D_VDD |  |
| Temperature 1 | 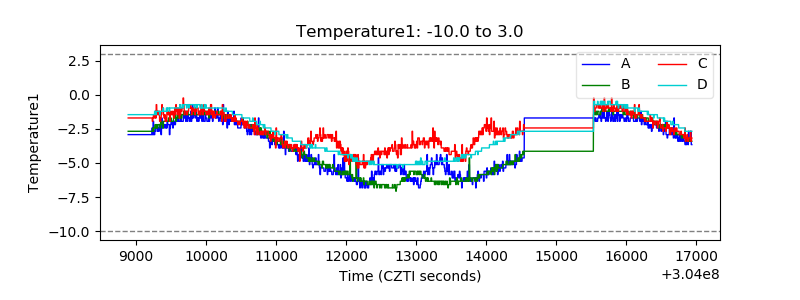 |
| Veto HV Monitor | 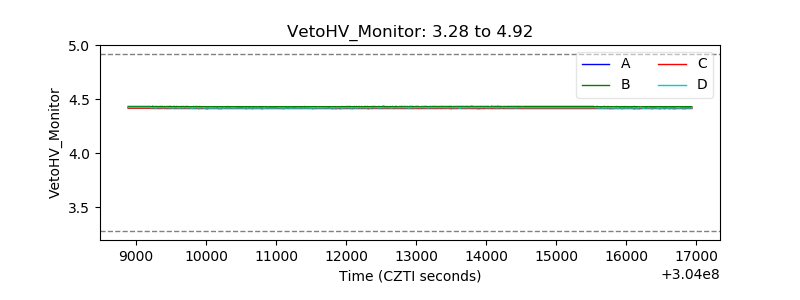 |
| Veto LLD | 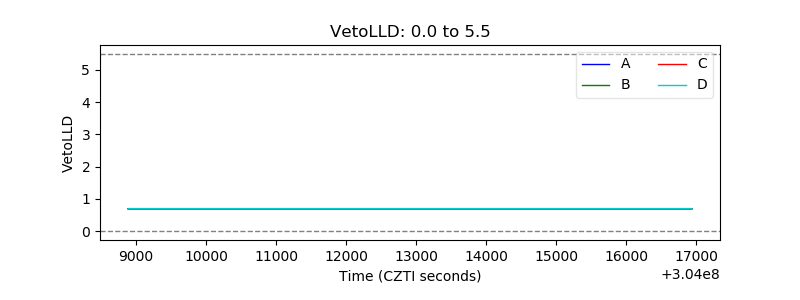 |
| Alpha Counter | 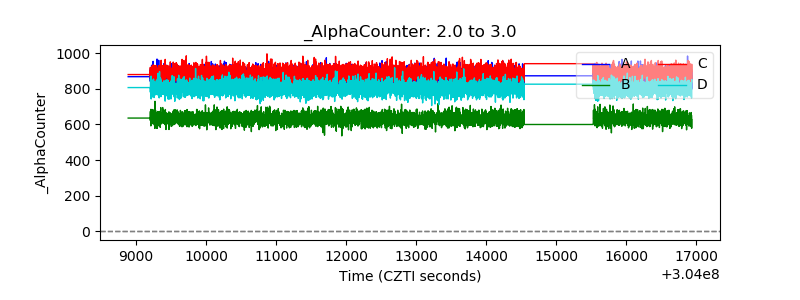 |
| _CPM_Rate | 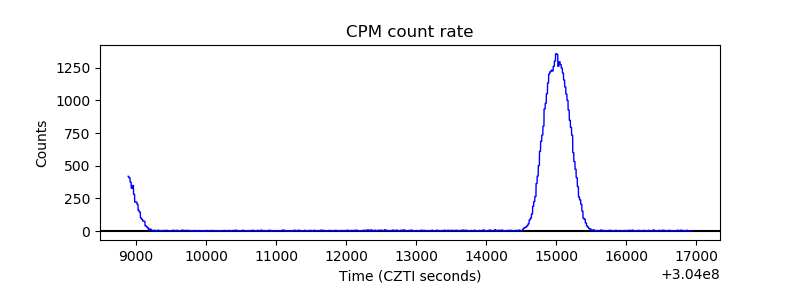 |
| CZT Counter | 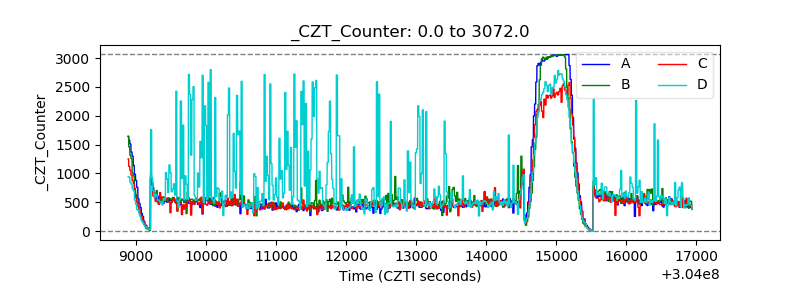 |
| +2.5 Volts monitor |  |
| +5 Volts monitor |  |
| _ROLL_ROT | 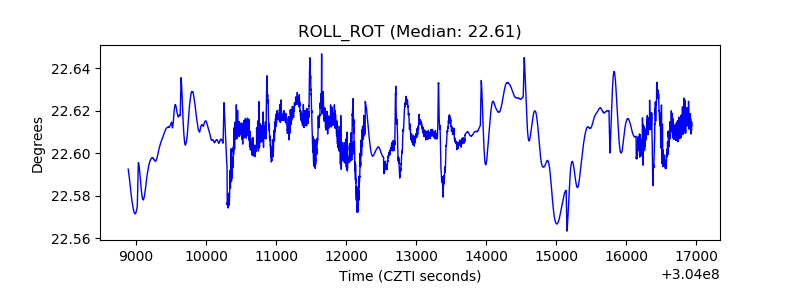 |
| _Roll_DEC |  |
| _Roll_RA | 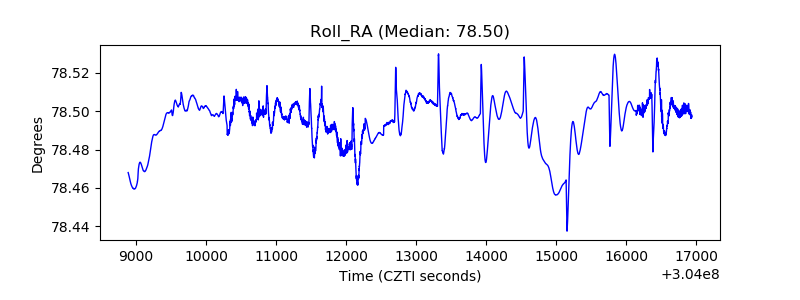 |
| Veto Counter | 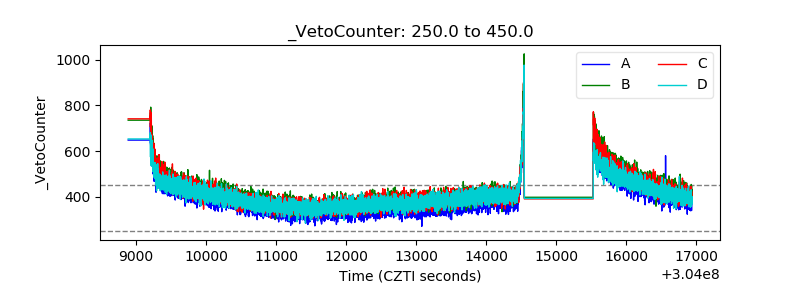 |