| Param | Original file | Final file |
|---|---|---|
| Filename | modeM0/AS1A05_025T04_9000003110_21056cztM0_level2.evt | modeM0/AS1A05_025T04_9000003110_21056cztM0_level2_quad_clean.evt |
| Size (bytes) | 466,378,560 | 69,992,640 |
| Size | 444.8 MB | 66.8 MB |
| Events in quadrant A | 3,125,895 | 427,701 |
| Events in quadrant B | 3,437,593 | 432,862 |
| Events in quadrant C | 3,133,842 | 409,756 |
| Events in quadrant D | 3,992,381 | 402,507 |
| Mode M9 | |||
|---|---|---|---|
| Quadrant | BADHDUFLAG | Total packets | Discarded packets |
| A | 0 | 14 | 0 |
| B | 0 | 15 | 0 |
| C | 0 | 15 | 0 |
| D | 0 | 15 | 0 |
| Mode SS | |||
|---|---|---|---|
| Quadrant | BADHDUFLAG | Total packets | Discarded packets |
| A | 0 | 130 | 0 |
| B | 0 | 130 | 0 |
| C | 0 | 130 | 0 |
| D | 0 | 130 | 0 |
| Mode M0 | |||
|---|---|---|---|
| Quadrant | BADHDUFLAG | Total packets | Discarded packets |
| A | 0 | 13489 | 2 |
| B | 0 | 14361 | 2 |
| C | 0 | 13368 | 2 |
| D | 0 | 16110 | 2 |
| Quadrant | Total seconds | Saturated seconds | Saturation percentage |
|---|---|---|---|
| A | 6398 | 51 | 0.797124% |
| B | 6397 | 85 | 1.328748% |
| C | 6397 | 68 | 1.062998% |
| D | 6397 | 164 | 2.563702% |
Noise dominated data is calculated using 1-second bins in cleaned event files. If a bin has >2000 counts, and if more than 50% of those come from <1% of pixels, then it is considered to be noise-dominated and hence unusable.
| Quadrant | # 1 sec bins | Bins with >0 counts | Bins with >2000 counts | High rate bins dominated by noise | Noise dominated (total time) | Noise dominated (detector-on time) | Marked lightcurve |
|---|---|---|---|---|---|---|---|
| A | 7483 | 6399 | 0 | 0 | 0.00% | 0.00% | 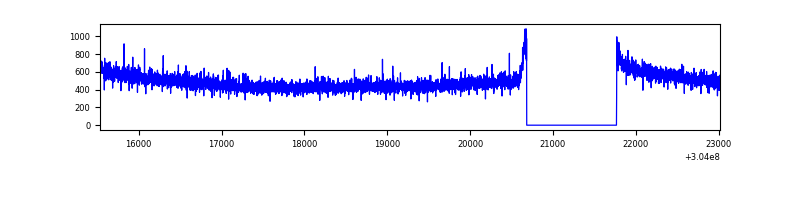 |
| B | 7482 | 6398 | 10 | 10 | 0.13% | 0.16% | 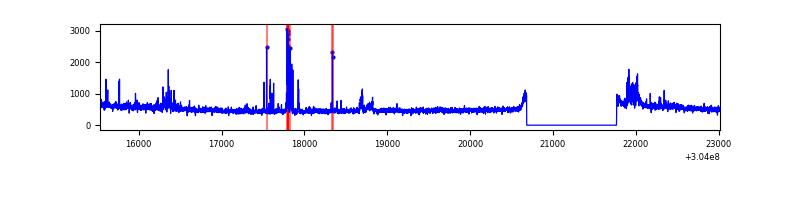 |
| C | 7482 | 6398 | 0 | 0 | 0.00% | 0.00% | 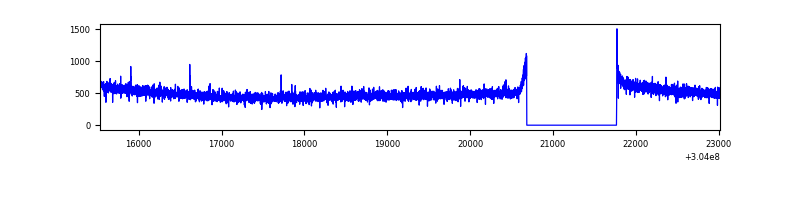 |
| D | 7482 | 6398 | 113 | 113 | 1.51% | 1.77% | 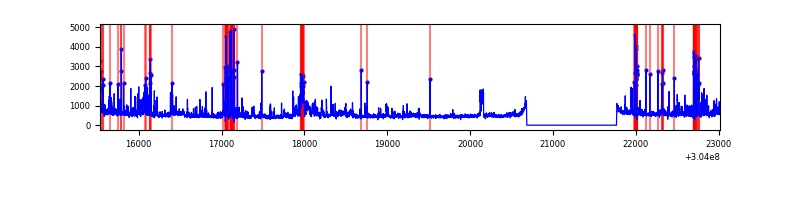 |
Top three noisy pixels from each quadrant. If the there are fewer than three noisy pixels in the level2.evt file, extra rows are filled as -1
| Pixel properties | Quadrant properties | ||||||
|---|---|---|---|---|---|---|---|
| Quadrant | DetID | PixID | Counts | Sigma | Mean | Median | Sigma |
| A | 13 | 254 | 7815 | 43.61 | 810 | 796 | 161.0 |
| A | 0 | 226 | 7166 | 39.58 | 810 | 796 | 161.0 |
| A | 3 | 137 | 6328 | 34.37 | 810 | 796 | 161.0 |
| B | 7 | 220 | 72302 | 470.0 | 808 | 790 | 152.2 |
| B | 0 | 197 | 70188 | 456.1 | 808 | 790 | 152.2 |
| B | 0 | 230 | 41189 | 265.51 | 808 | 790 | 152.2 |
| C | 14 | 238 | 122543 | 677.98 | 770 | 775 | 179.6 |
| C | 13 | 61 | 5535 | 26.5 | 770 | 775 | 179.6 |
| C | 3 | 9 | 4985 | 23.44 | 770 | 775 | 179.6 |
| D | 1 | 52 | 761251 | 4069.52 | 771 | 748 | 186.9 |
| D | 12 | 233 | 78526 | 416.2 | 771 | 748 | 186.9 |
| D | 7 | 238 | 70534 | 373.43 | 771 | 748 | 186.9 |
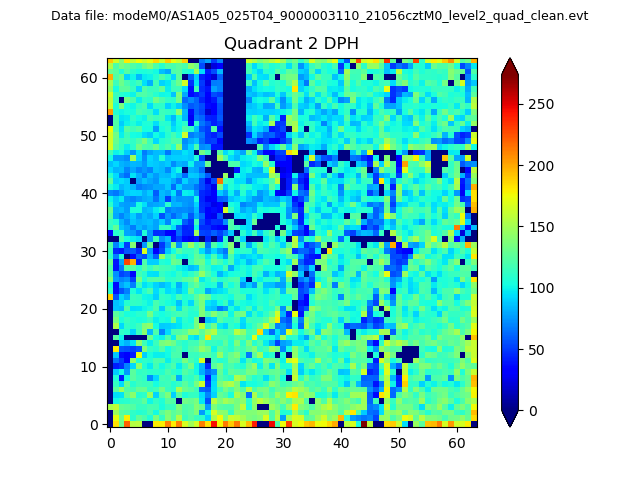
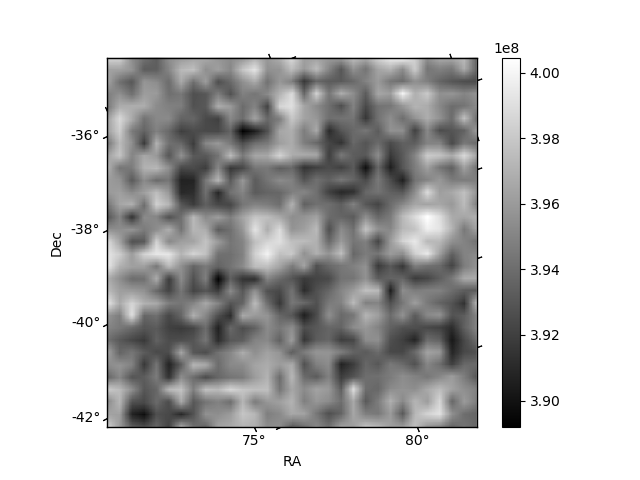
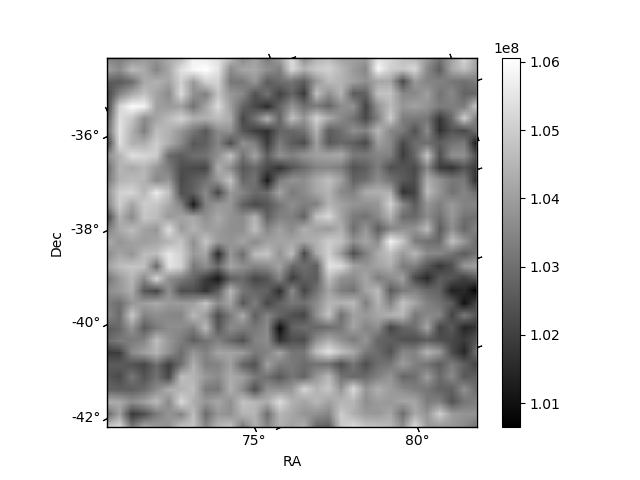
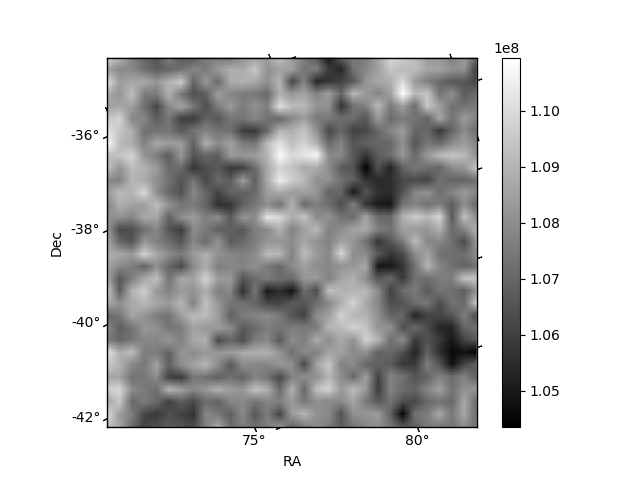
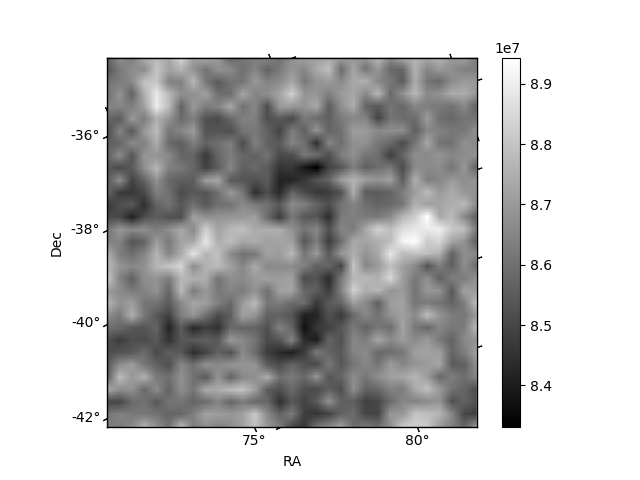
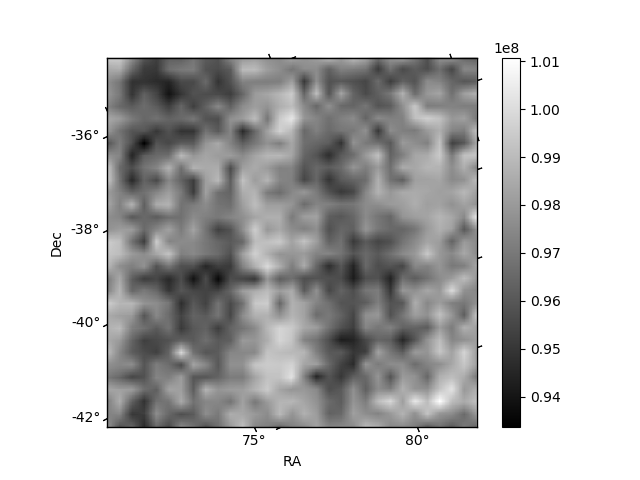
Histogram calculated using DETX and DETY for each event in the final _common_clean file
| Quadrant A | 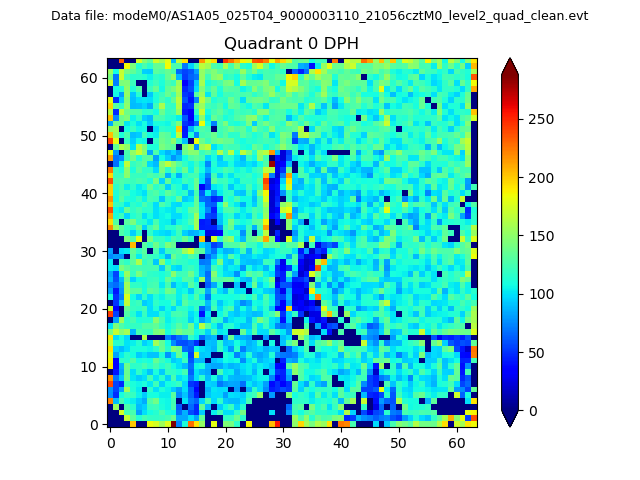 |
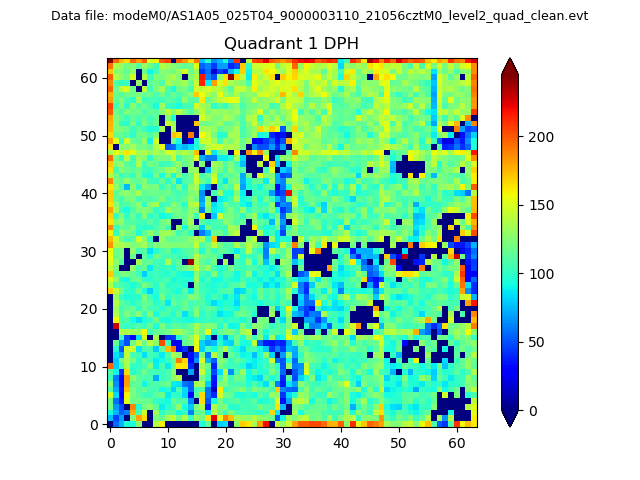 |
Quadrant B |
|---|---|---|---|
| Quadrant D | 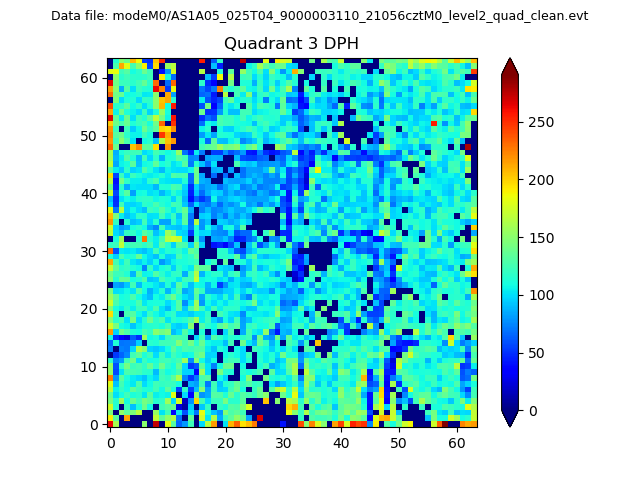 |
 |
Quadrant C |
| Plot type | Count rate plots | Images |
|---|---|---|
| Comparison with Poisson distribution Blue bars denote a histogram of data divided into 1 sec bins. Red curve is a Poisson curve with rate = median count rate of data. |
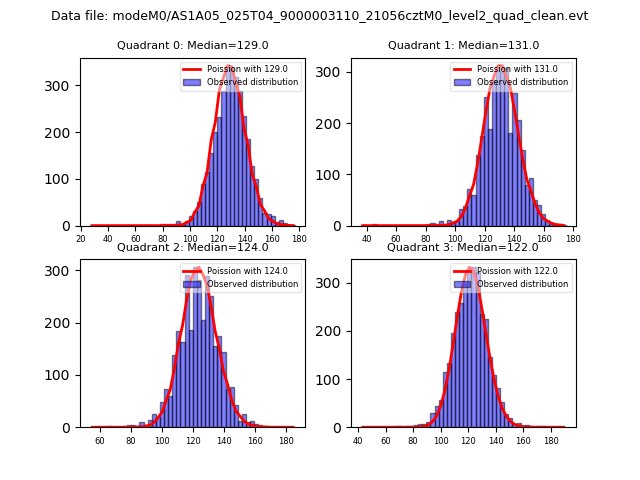 |
 |
| Quadrant-wise count rates Data is divided into 100 sec bins |
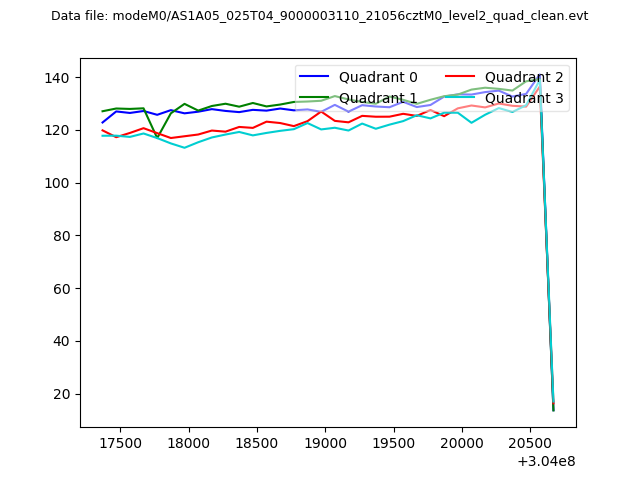 |
|
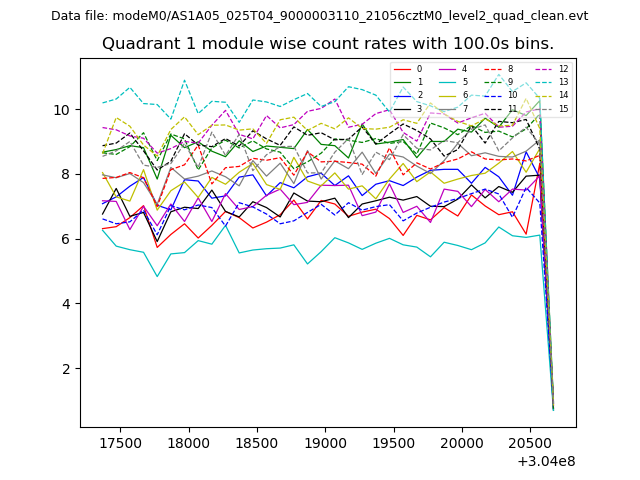
| Module-wise count rates for Quadrant A Data is divided into 100 sec bins |
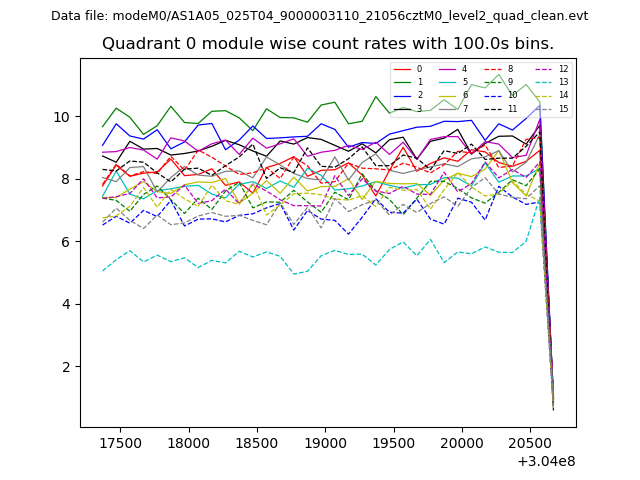 |
 |
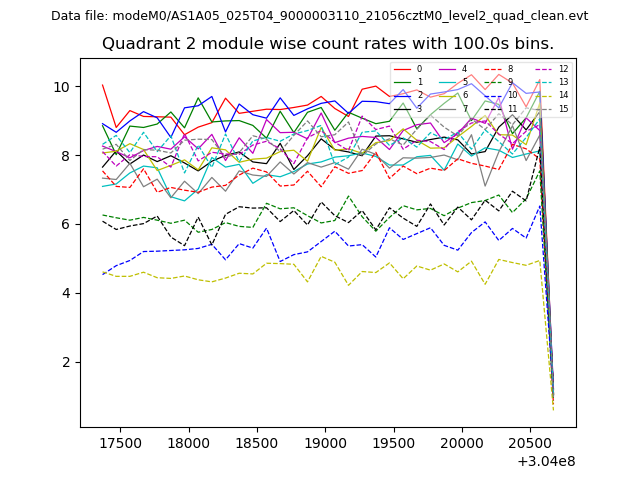
| Module-wise count rates for Quadrant B Data is divided into 100 sec bins |
 |
 |
| Module-wise count rates for Quadrant C Data is divided into 100 sec bins |
 |
 |
| Module-wise count rates for Quadrant D Data is divided into 100 sec bins |
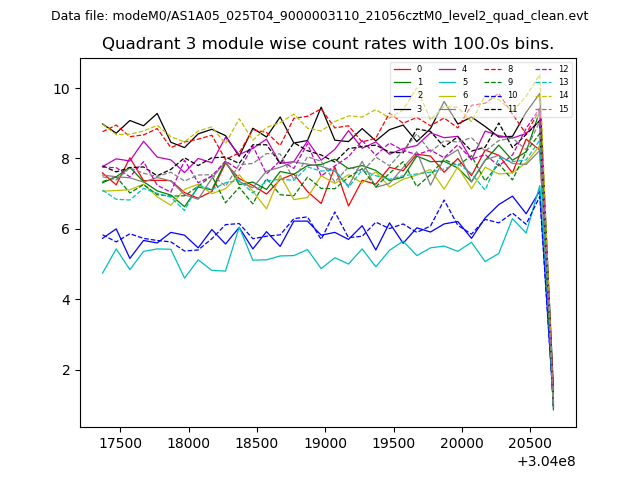 |
 |
| Parameter | Plot |
|---|---|
| CZT HV Monitor | 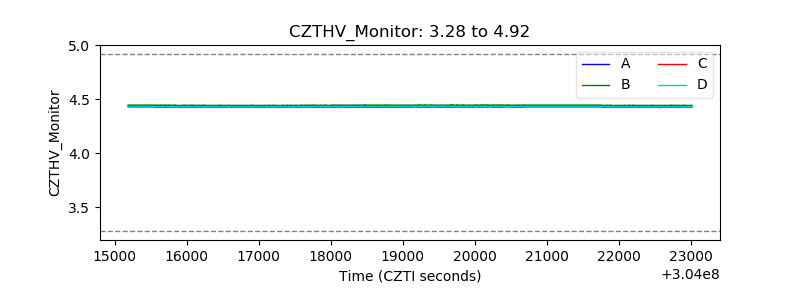 |
| D_VDD | 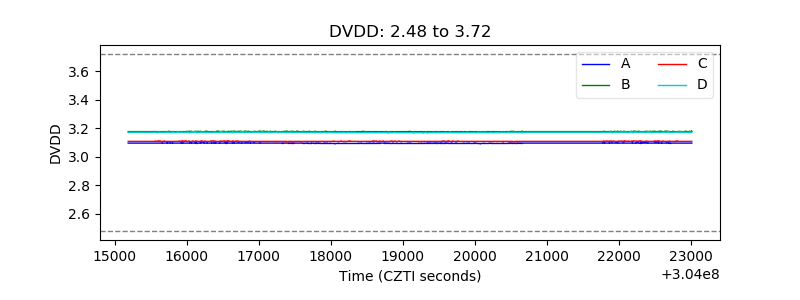 |
| Temperature 1 | 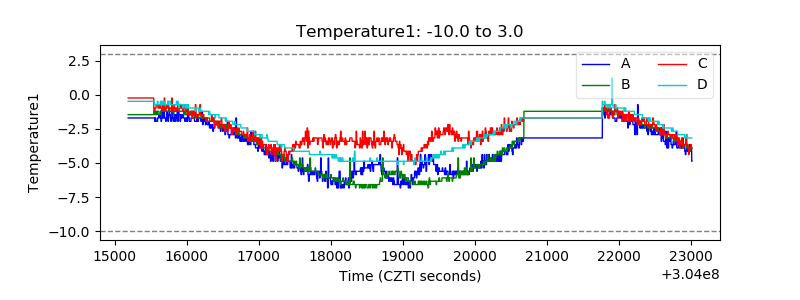 |
| Veto HV Monitor |  |
| Veto LLD | 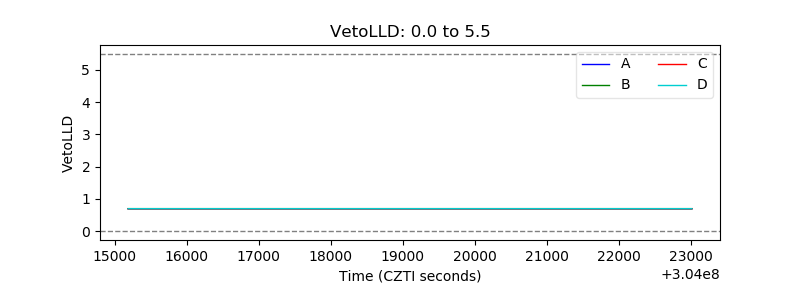 |
| Alpha Counter | 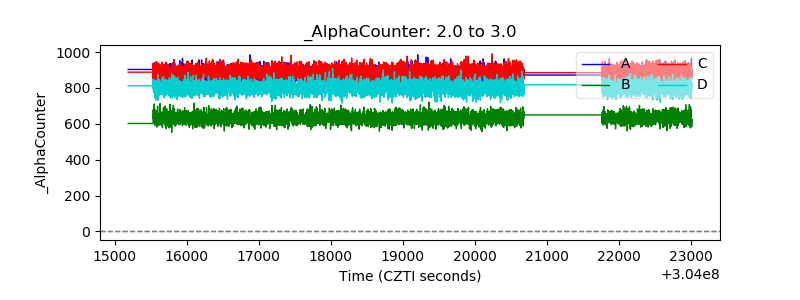 |
| _CPM_Rate | 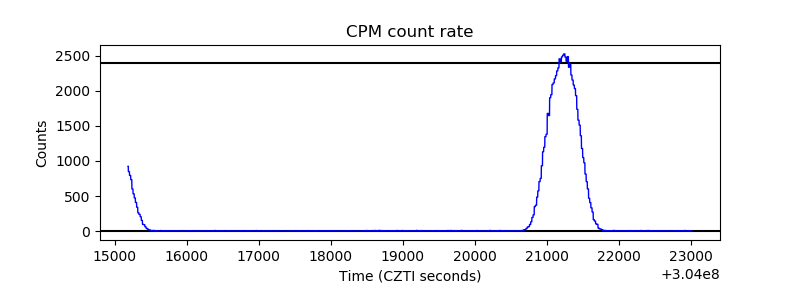 |
| CZT Counter | 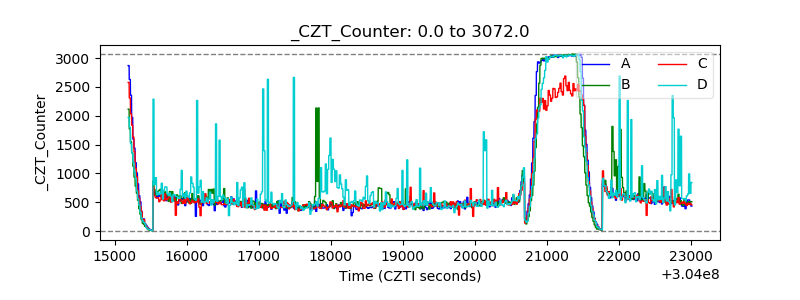 |
| +2.5 Volts monitor |  |
| +5 Volts monitor |  |
| _ROLL_ROT | 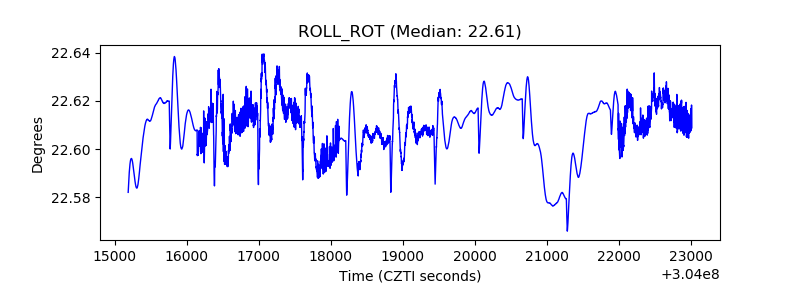 |
| _Roll_DEC | 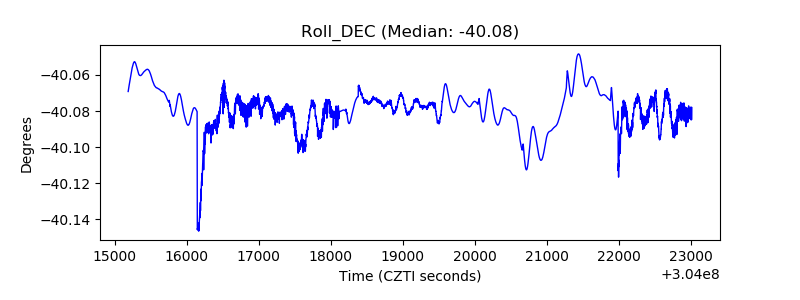 |
| _Roll_RA | 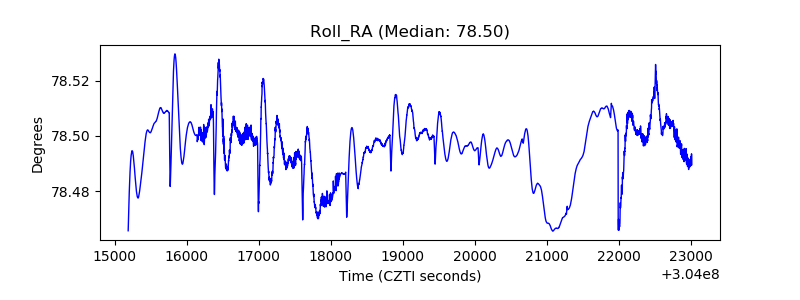 |
| Veto Counter | 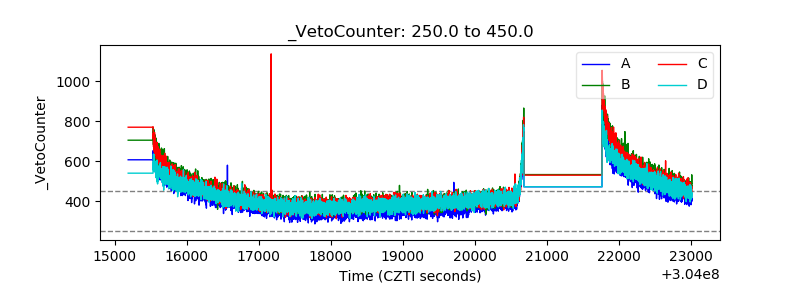 |