| Param | Original file | Final file |
|---|---|---|
| Filename | modeM0/AS1A05_025T04_9000003110_21058cztM0_level2.evt | modeM0/AS1A05_025T04_9000003110_21058cztM0_level2_quad_clean.evt |
| Size (bytes) | 169,185,600 | 21,274,560 |
| Size | 161.3 MB | 20.3 MB |
| Events in quadrant A | 1,122,747 | 125,688 |
| Events in quadrant B | 1,241,713 | 125,346 |
| Events in quadrant C | 1,096,293 | 118,014 |
| Events in quadrant D | 1,510,088 | 114,140 |
| Mode SS | |||
|---|---|---|---|
| Quadrant | BADHDUFLAG | Total packets | Discarded packets |
| A | 0 | 44 | 0 |
| B | 0 | 44 | 0 |
| C | 0 | 44 | 0 |
| D | 0 | 44 | 0 |
| Mode M0 | |||
|---|---|---|---|
| Quadrant | BADHDUFLAG | Total packets | Discarded packets |
| A | 0 | 4727 | 0 |
| B | 0 | 5085 | 0 |
| C | 0 | 4631 | 0 |
| D | 0 | 5945 | 0 |
| Quadrant | Total seconds | Saturated seconds | Saturation percentage |
|---|---|---|---|
| A | 2218 | 5 | 0.225428% |
| B | 2219 | 24 | 1.081568% |
| C | 2219 | 6 | 0.270392% |
| D | 2219 | 95 | 4.281208% |
Noise dominated data is calculated using 1-second bins in cleaned event files. If a bin has >2000 counts, and if more than 50% of those come from <1% of pixels, then it is considered to be noise-dominated and hence unusable.
| Quadrant | # 1 sec bins | Bins with >0 counts | Bins with >2000 counts | High rate bins dominated by noise | Noise dominated (total time) | Noise dominated (detector-on time) | Marked lightcurve |
|---|---|---|---|---|---|---|---|
| A | 2218 | 2218 | 4 | 4 | 0.18% | 0.18% | 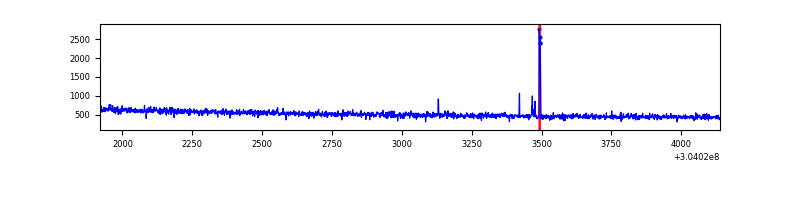 |
| B | 2219 | 2219 | 7 | 7 | 0.32% | 0.32% | 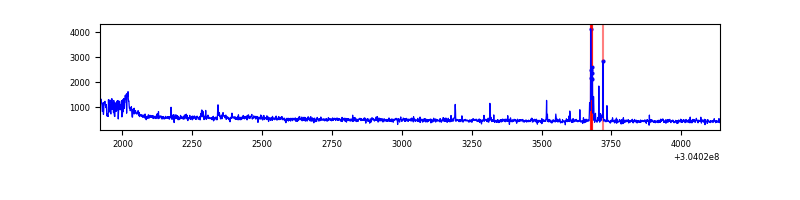 |
| C | 2219 | 2219 | 0 | 0 | 0.00% | 0.00% | 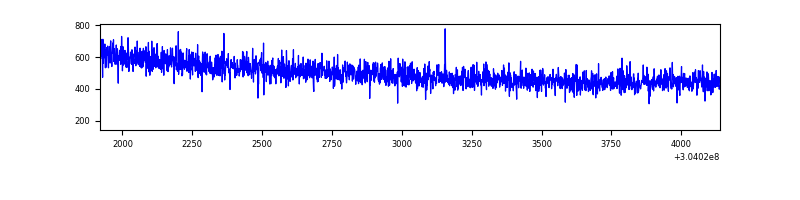 |
| D | 2219 | 2219 | 82 | 82 | 3.70% | 3.70% | 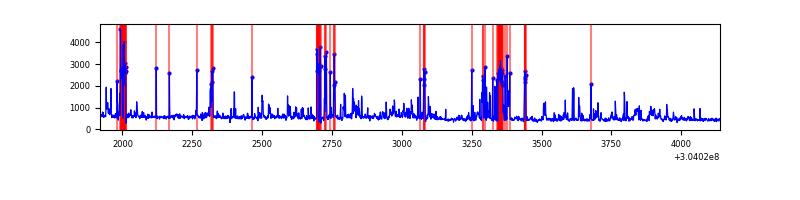 |
Top three noisy pixels from each quadrant. If the there are fewer than three noisy pixels in the level2.evt file, extra rows are filled as -1
| Pixel properties | Quadrant properties | ||||||
|---|---|---|---|---|---|---|---|
| Quadrant | DetID | PixID | Counts | Sigma | Mean | Median | Sigma |
| A | 12 | 96 | 14466 | 245.25 | 287 | 282 | 57.8 |
| A | 13 | 254 | 3274 | 51.73 | 287 | 282 | 57.8 |
| A | 0 | 226 | 2556 | 39.32 | 287 | 282 | 57.8 |
| B | 0 | 197 | 61774 | 1112.79 | 287 | 281 | 55.3 |
| B | 7 | 220 | 31255 | 560.51 | 287 | 281 | 55.3 |
| B | 0 | 190 | 9799 | 172.24 | 287 | 281 | 55.3 |
| C | 14 | 238 | 43915 | 684.95 | 269 | 271 | 63.7 |
| C | 13 | 61 | 1940 | 26.19 | 269 | 271 | 63.7 |
| C | 3 | 9 | 1033 | 11.96 | 269 | 271 | 63.7 |
| D | 1 | 52 | 346114 | 5187.01 | 267 | 259 | 66.7 |
| D | 9 | 1 | 73306 | 1095.53 | 267 | 259 | 66.7 |
| D | 12 | 233 | 58265 | 869.95 | 267 | 259 | 66.7 |
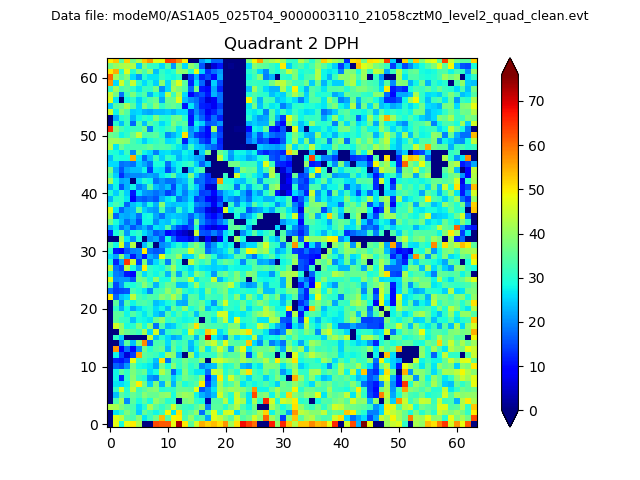
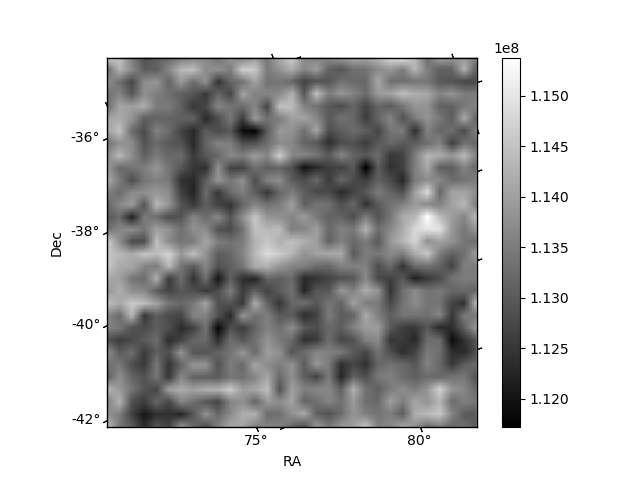
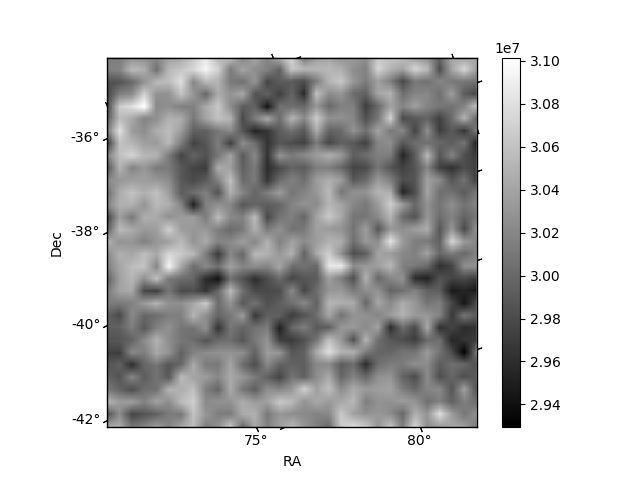
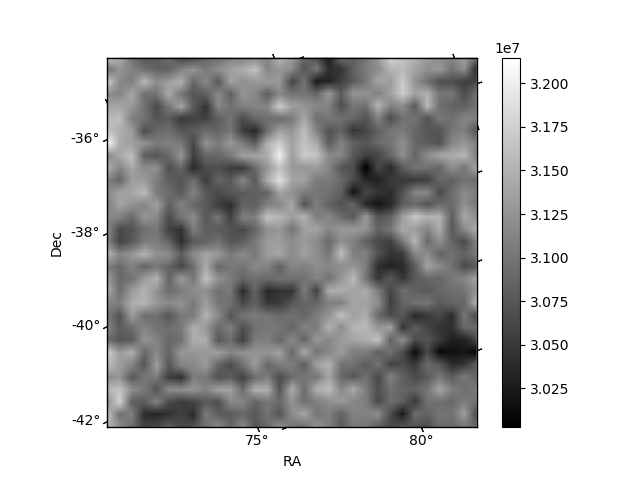
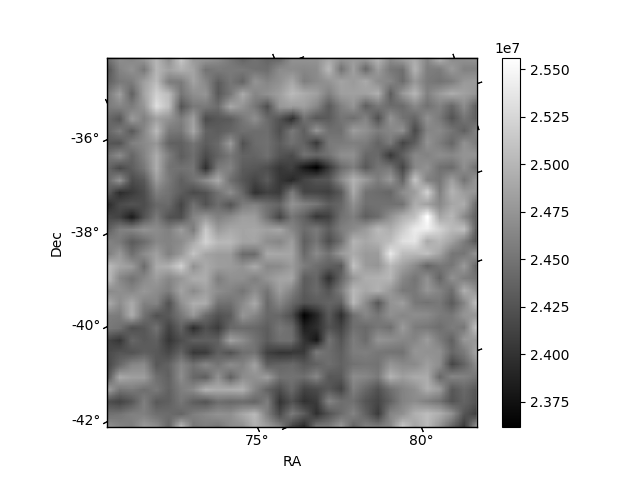
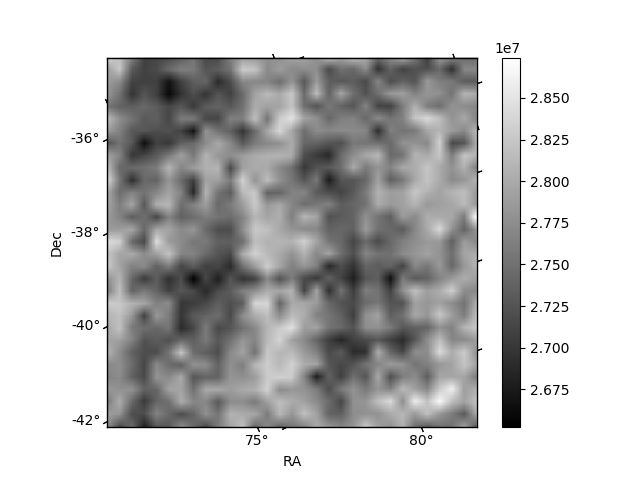
Histogram calculated using DETX and DETY for each event in the final _common_clean file
| Quadrant A | 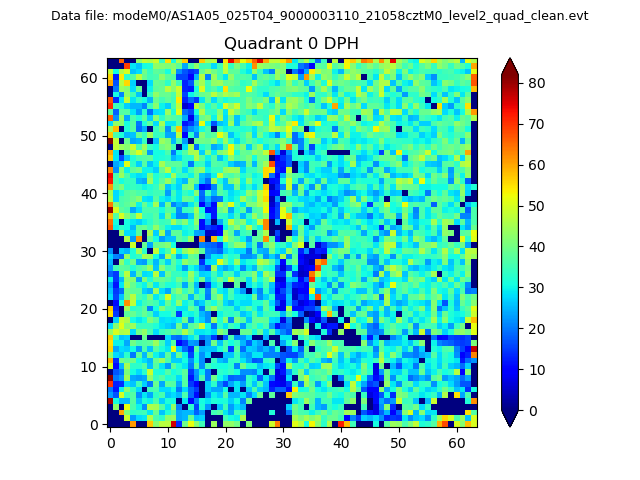 |
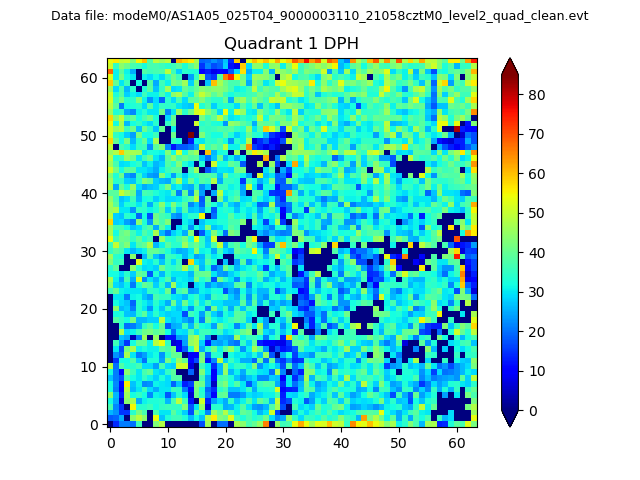 |
Quadrant B |
|---|---|---|---|
| Quadrant D | 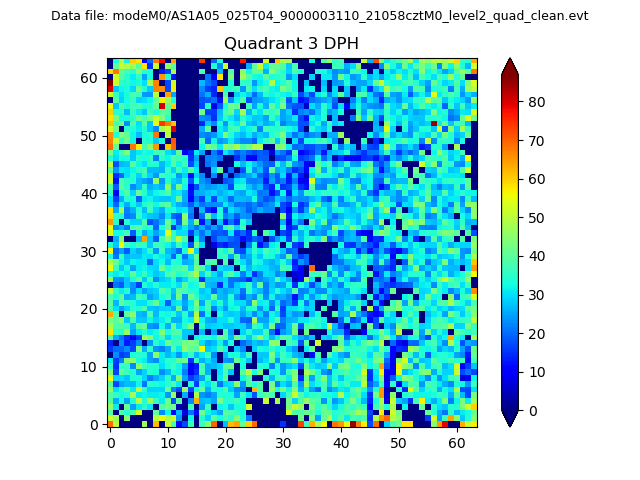 |
 |
Quadrant C |
| Plot type | Count rate plots | Images |
|---|---|---|
| Comparison with Poisson distribution Blue bars denote a histogram of data divided into 1 sec bins. Red curve is a Poisson curve with rate = median count rate of data. |
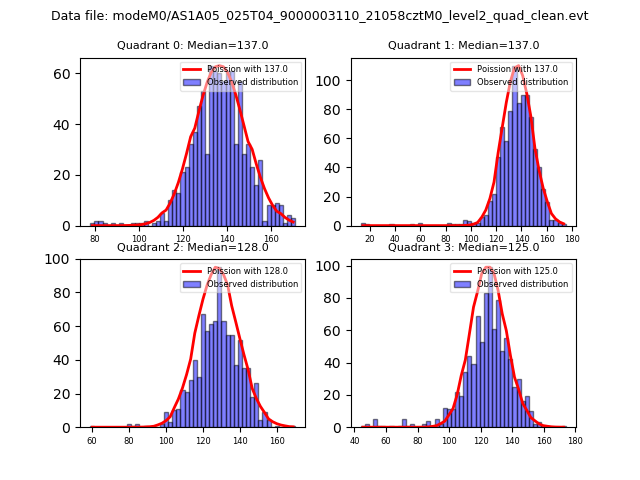 |
 |
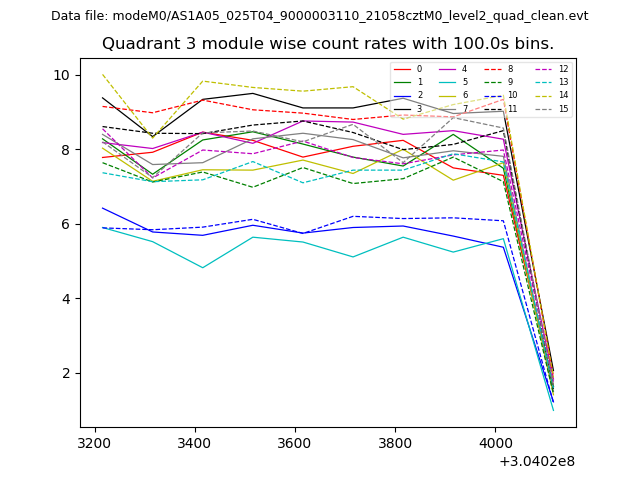
| Quadrant-wise count rates Data is divided into 100 sec bins |
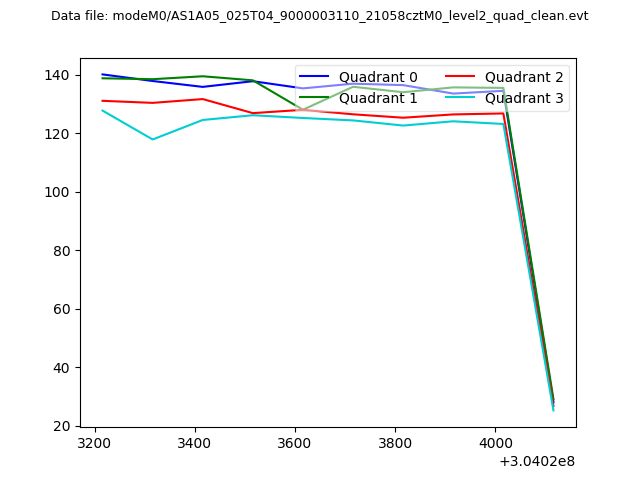 |
|
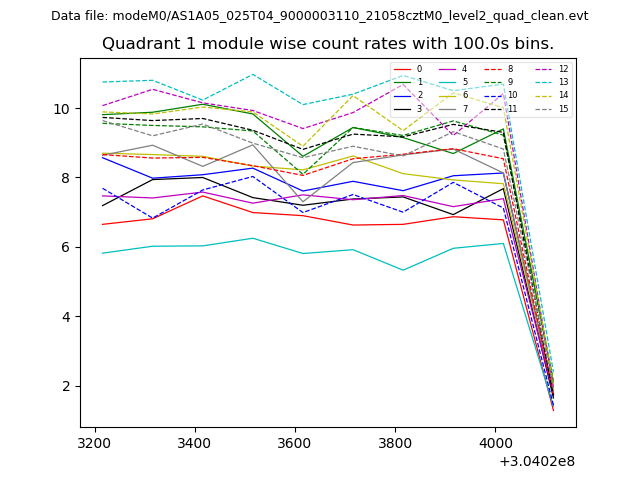
| Module-wise count rates for Quadrant A Data is divided into 100 sec bins |
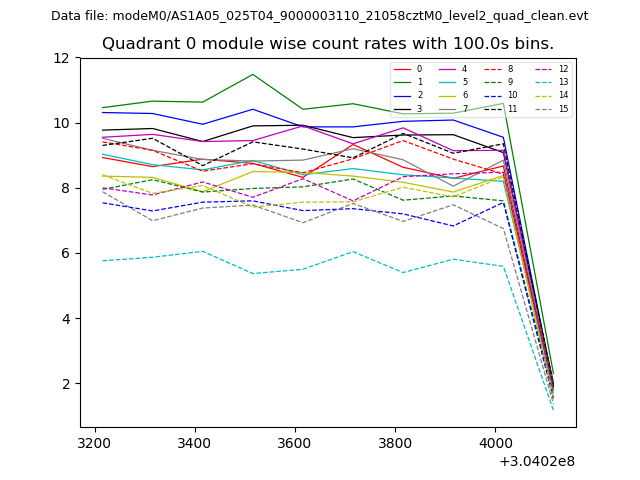 |
 |
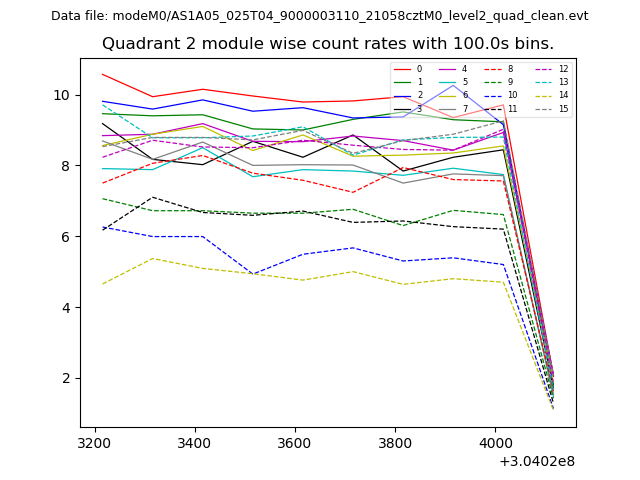
| Module-wise count rates for Quadrant B Data is divided into 100 sec bins |
 |
 |
| Module-wise count rates for Quadrant C Data is divided into 100 sec bins |
 |
 |
| Module-wise count rates for Quadrant D Data is divided into 100 sec bins |
 |
 |
| Parameter | Plot |
|---|---|
| CZT HV Monitor | 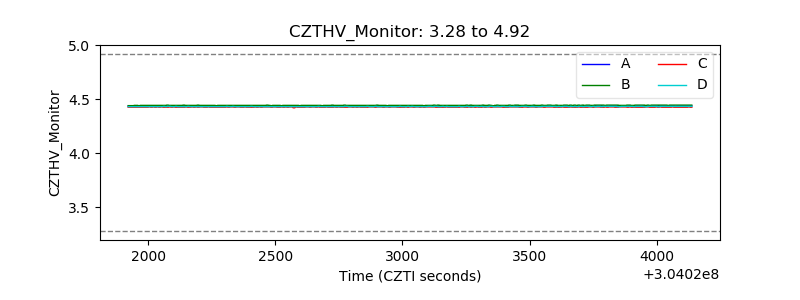 |
| D_VDD | 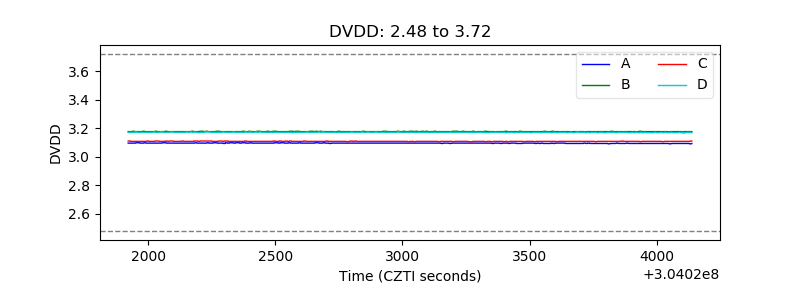 |
| Temperature 1 | 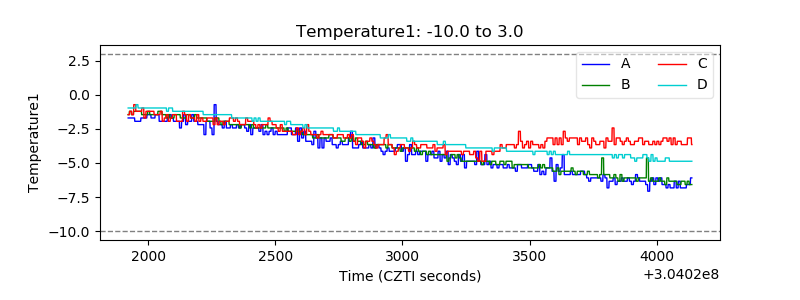 |
| Veto HV Monitor | 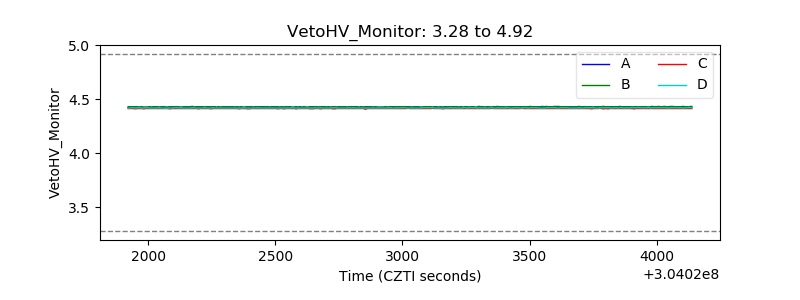 |
| Veto LLD | 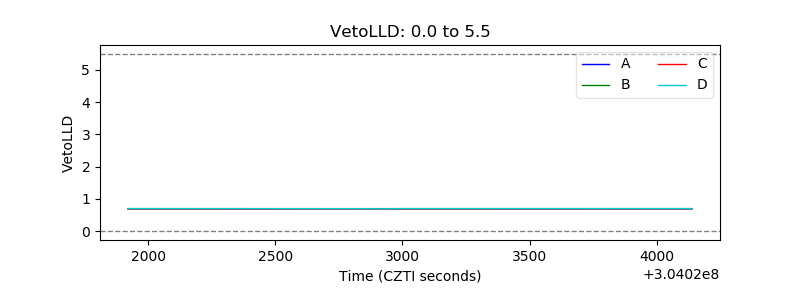 |
| Alpha Counter | 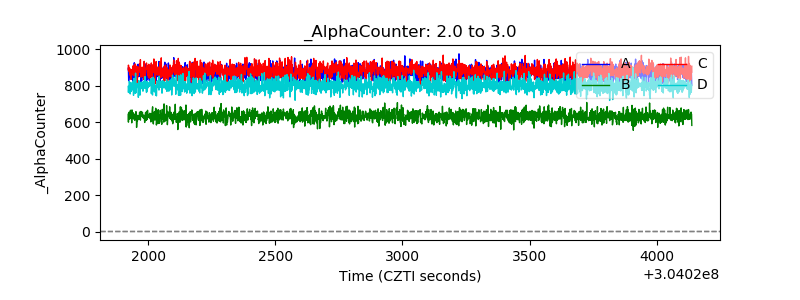 |
| _CPM_Rate | 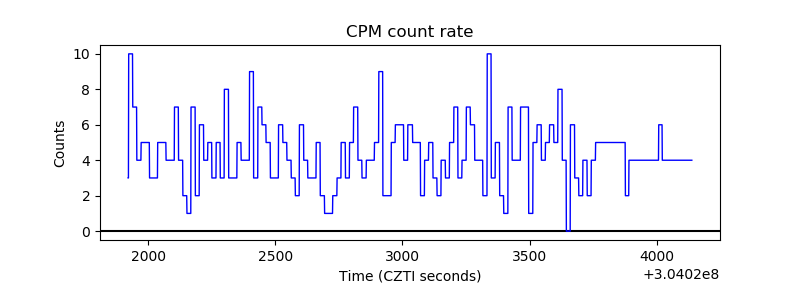 |
| CZT Counter | 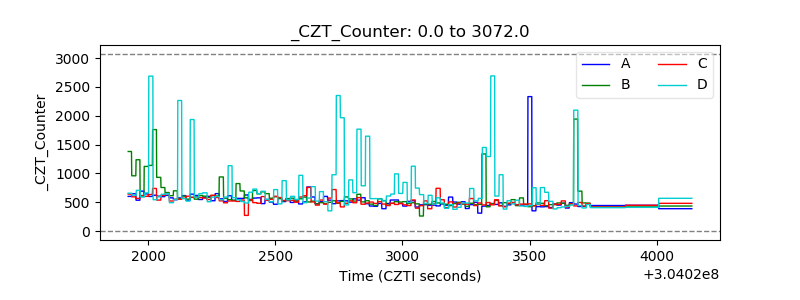 |
| +2.5 Volts monitor | 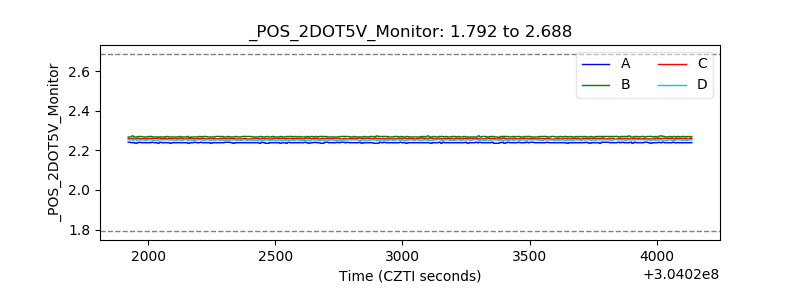 |
| +5 Volts monitor | 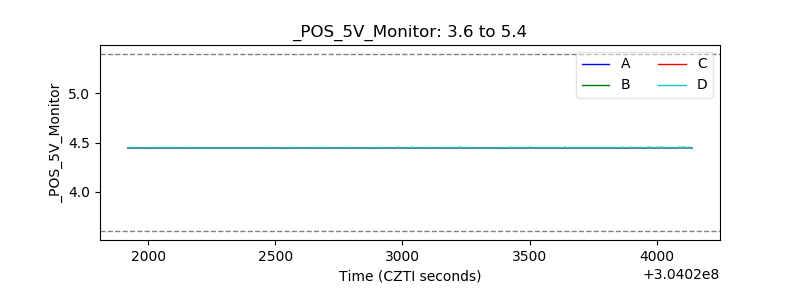 |
| _ROLL_ROT | 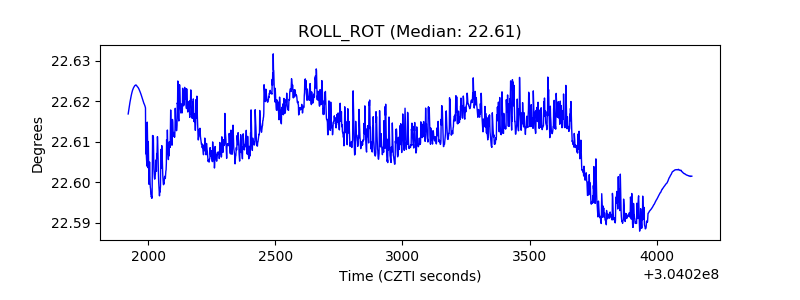 |
| _Roll_DEC | 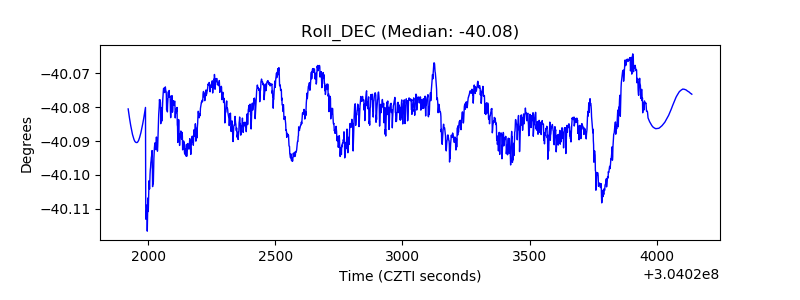 |
| _Roll_RA | 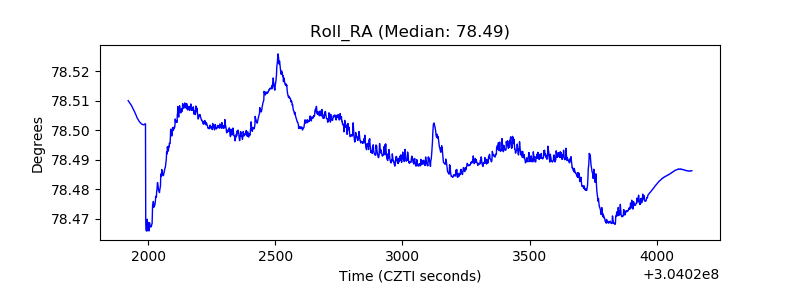 |
| Veto Counter | 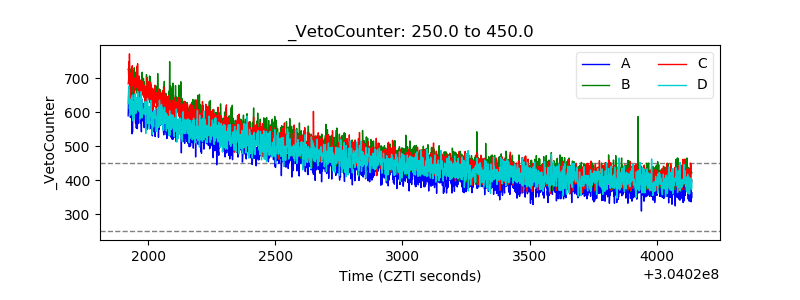 |