| Param | Original file | Final file |
|---|---|---|
| Filename | modeM0/AS1A05_101T03_9000003112cztM0_level2.fits | modeM0/AS1A05_101T03_9000003112cztM0_level2_quad_clean.evt |
| Size (bytes) | 184,380,480 | 65,016,000 |
| Size | 175.8 MB | 62.0 MB |
| Events in quadrant A | 1,151,424 | 201,955 |
| Events in quadrant B | 1,120,362 | 206,509 |
| Events in quadrant C | 1,146,624 | 192,601 |
| Events in quadrant D | 975,384 | 175,070 |
| Mode SS | |||
|---|---|---|---|
| Quadrant | BADHDUFLAG | Total packets | Discarded packets |
| A | 0 | 354 | 0 |
| B | 0 | 354 | 0 |
| C | 0 | 354 | 0 |
| D | 0 | 354 | 0 |
| Mode M0 | |||
|---|---|---|---|
| Quadrant | BADHDUFLAG | Total packets | Discarded packets |
| A | 0 | 36218 | 0 |
| B | 0 | 37624 | 0 |
| C | 0 | 36332 | 0 |
| D | 0 | 41897 | 0 |
| Mode M9 | |||
|---|---|---|---|
| Quadrant | BADHDUFLAG | Total packets | Discarded packets |
| A | 0 | 52 | 0 |
| B | 0 | 52 | 0 |
| C | 0 | 52 | 0 |
| D | 0 | 52 | 0 |
| Quadrant | Total seconds | Saturated seconds | Saturation percentage |
|---|---|---|---|
| A | 17269 | 108 | 0.625398% |
| B | 17269 | 218 | 1.262378% |
| C | 17269 | 198 | 1.146563% |
| D | 17269 | 311 | 1.800915% |
Noise dominated data is calculated using 1-second bins in cleaned event files. If a bin has >2000 counts, and if more than 50% of those come from <1% of pixels, then it is considered to be noise-dominated and hence unusable.
| Quadrant | # 1 sec bins | Bins with >0 counts | Bins with >2000 counts | High rate bins dominated by noise | Noise dominated (total time) | Noise dominated (detector-on time) | Marked lightcurve |
|---|---|---|---|---|---|---|---|
| A | 22434 | 17269 | 0 | 0 | 0.00% | 0.00% | 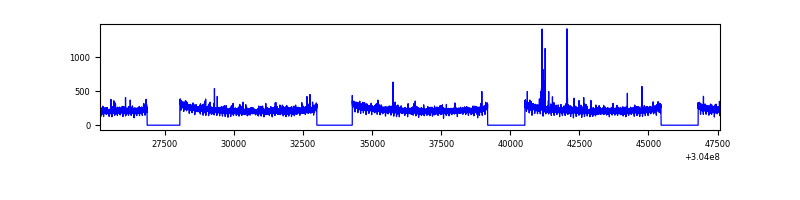 |
| B | 22434 | 17269 | 0 | 0 | 0.00% | 0.00% | 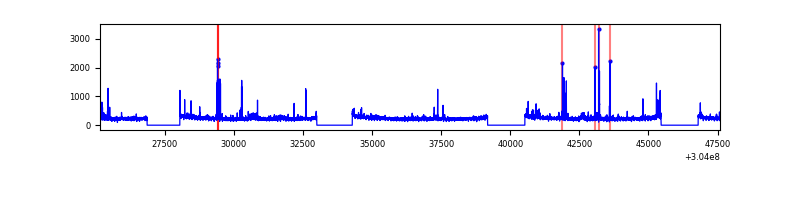 |
| C | 22434 | 17269 | 0 | 0 | 0.00% | 0.00% | 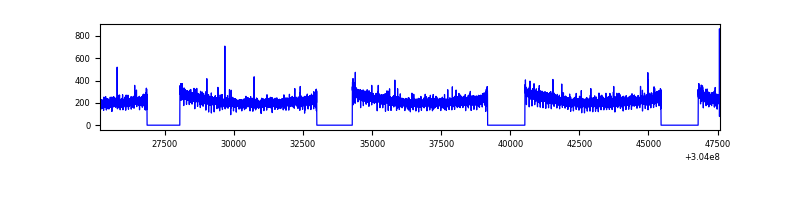 |
| D | 22434 | 17268 | 0 | 0 | 0.00% | 0.00% |  |
Top three noisy pixels from each quadrant. If the there are fewer than three noisy pixels in the level2.evt file, extra rows are filled as -1
| Pixel properties | Quadrant properties | ||||||
|---|---|---|---|---|---|---|---|
| Quadrant | DetID | PixID | Counts | Sigma | Mean | Median | Sigma |
| A | 0 | 29 | 1072 | 10.51 | 299 | 283 | 75.1 |
| A | 7 | 110 | 943 | 8.79 | 299 | 283 | 75.1 |
| A | 0 | 30 | 895 | 8.15 | 299 | 283 | 75.1 |
| B | 2 | 9 | 847 | 9.34 | 296 | 283 | 60.4 |
| B | 5 | 128 | 735 | 7.49 | 296 | 283 | 60.4 |
| B | 3 | 17 | 725 | 7.32 | 296 | 283 | 60.4 |
| C | 1 | 81 | 888 | 7.62 | 302 | 285 | 79.1 |
| C | 1 | 80 | 857 | 7.23 | 302 | 285 | 79.1 |
| C | 9 | 209 | 801 | 6.52 | 302 | 285 | 79.1 |
| D | 10 | 189 | 718 | 6.18 | 278 | 255 | 74.9 |
| D | 15 | 46 | 707 | 6.04 | 278 | 255 | 74.9 |
| D | 3 | 14 | 697 | 5.9 | 278 | 255 | 74.9 |
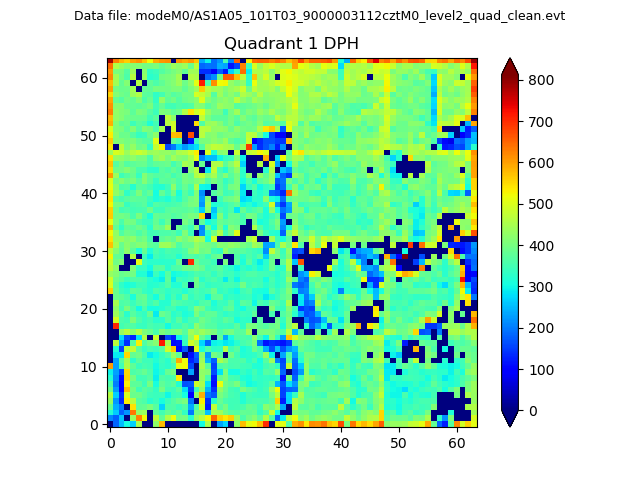
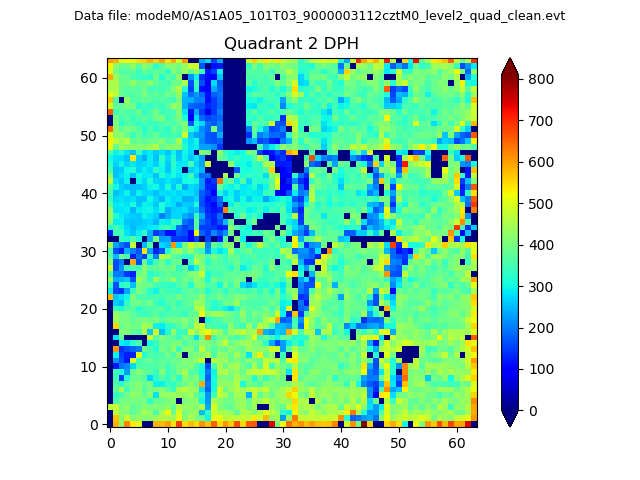
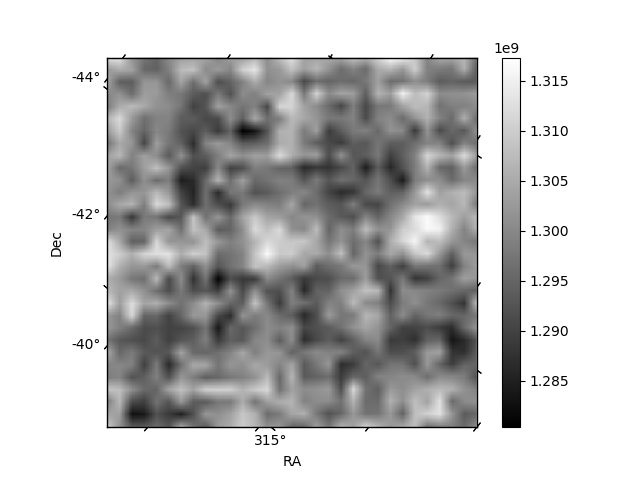
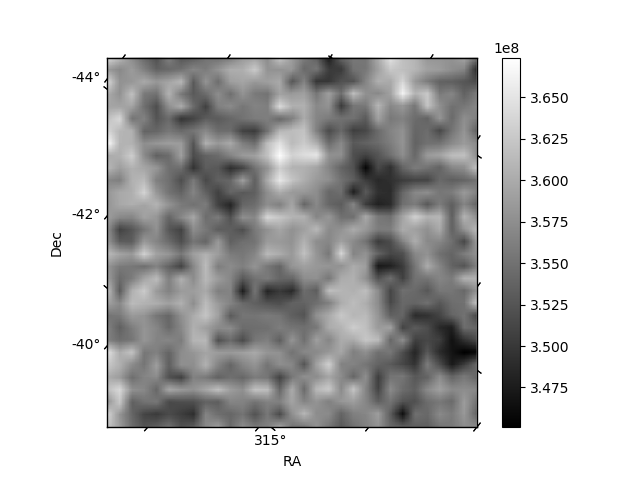
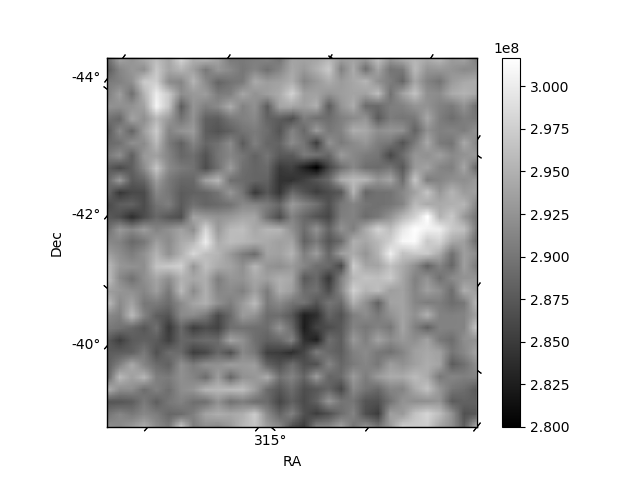
Histogram calculated using DETX and DETY for each event in the final _common_clean file
| Quadrant A | 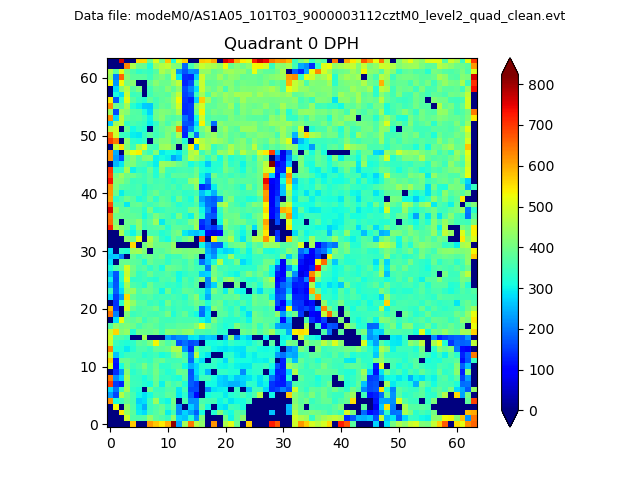 |
 |
Quadrant B |
|---|---|---|---|
| Quadrant D | 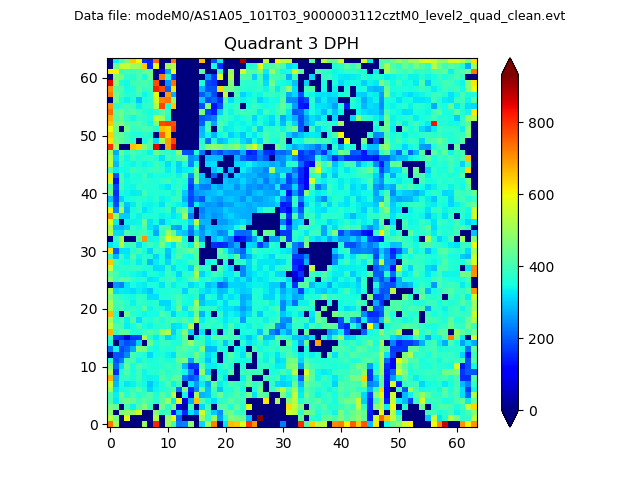 |
 |
Quadrant C |
| Plot type | Count rate plots | Images |
|---|---|---|
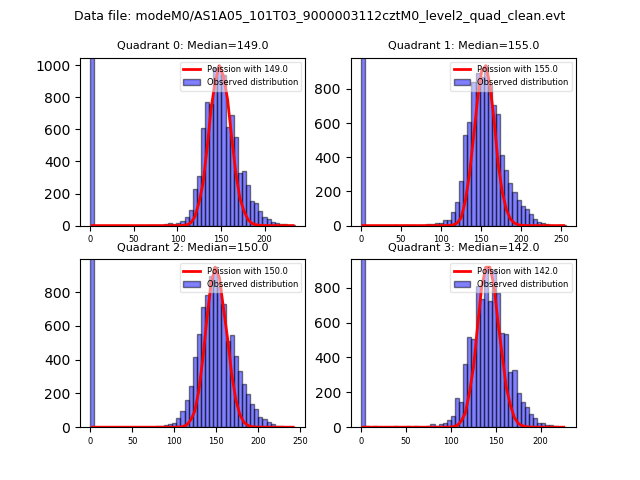
| Comparison with Poisson distribution Blue bars denote a histogram of data divided into 1 sec bins. Red curve is a Poisson curve with rate = median count rate of data. |
 |
 |
| Quadrant-wise count rates Data is divided into 100 sec bins |
 |
|
| Module-wise count rates for Quadrant A Data is divided into 100 sec bins |
 |
 |
| Module-wise count rates for Quadrant B Data is divided into 100 sec bins |
 |
 |
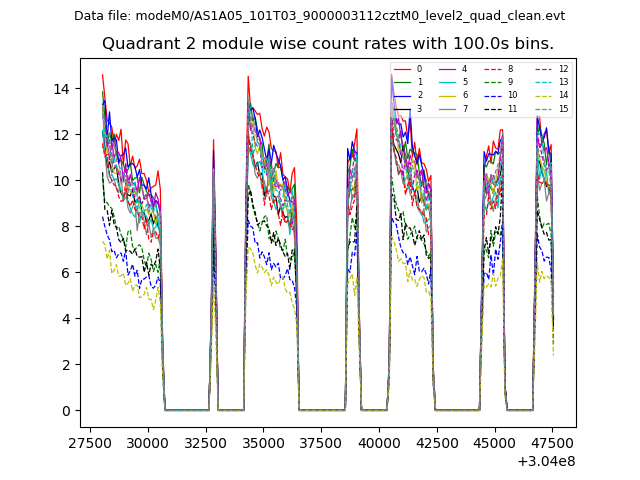
| Module-wise count rates for Quadrant C Data is divided into 100 sec bins |
 |
 |
| Module-wise count rates for Quadrant D Data is divided into 100 sec bins |
 |
 |
| Parameter | Plot |
|---|---|
| CZT HV Monitor |  |
| D_VDD | 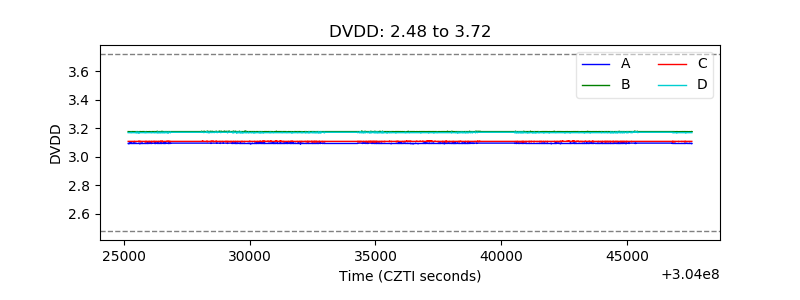 |
| Temperature 1 | 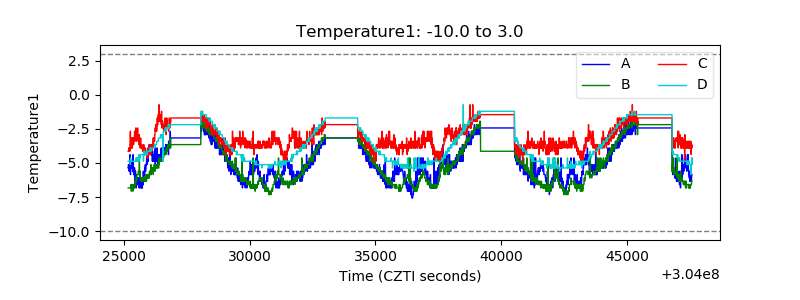 |
| Veto HV Monitor |  |
| Veto LLD | 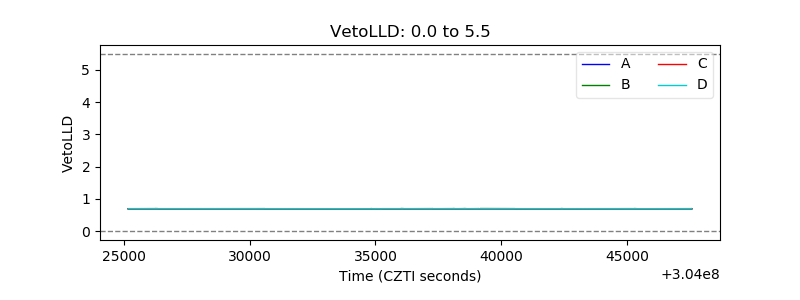 |
| Alpha Counter | 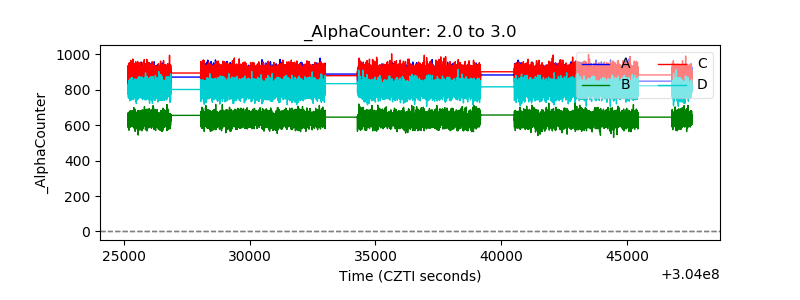 |
| _CPM_Rate | 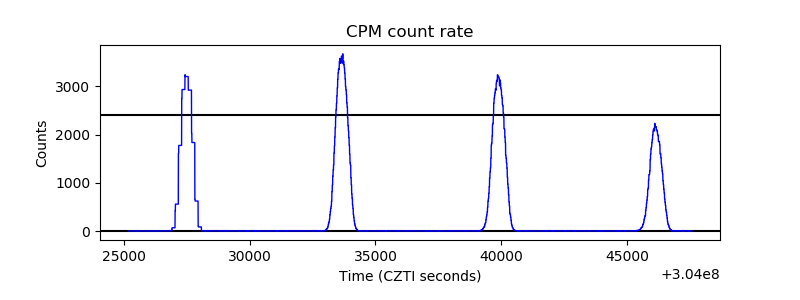 |
| CZT Counter |  |
| +2.5 Volts monitor |  |
| +5 Volts monitor |  |
| _ROLL_ROT |  |
| _Roll_DEC | 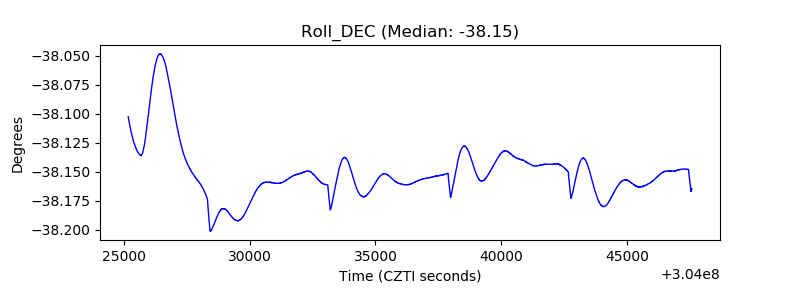 |
| _Roll_RA | 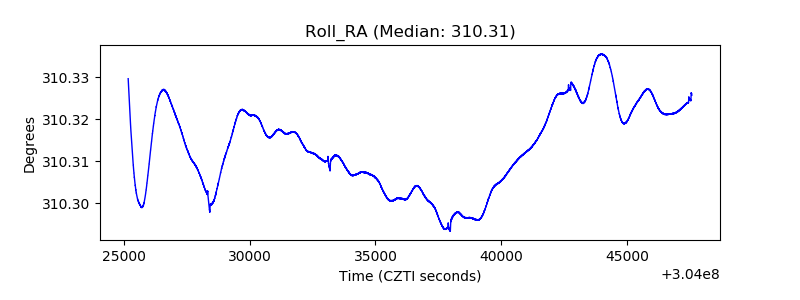 |
| Veto Counter | 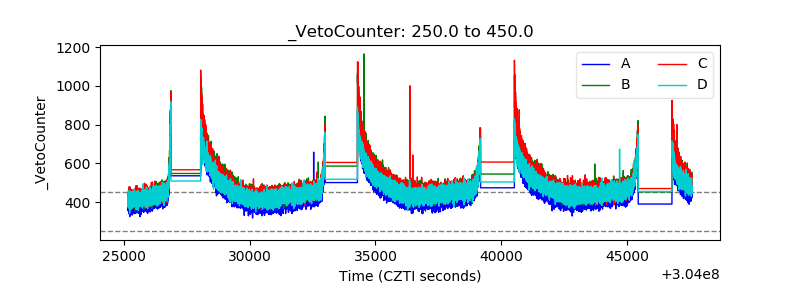 |