| Param | Original file | Final file |
|---|---|---|
| Filename | modeM0/AS1A05_101T03_9000003112_21058cztM0_level2.evt | modeM0/AS1A05_101T03_9000003112_21058cztM0_level2_quad_clean.evt |
| Size (bytes) | 236,053,440 | 38,376,000 |
| Size | 225.1 MB | 36.6 MB |
| Events in quadrant A | 1,652,544 | 234,218 |
| Events in quadrant B | 1,806,142 | 244,375 |
| Events in quadrant C | 1,674,630 | 233,647 |
| Events in quadrant D | 1,796,982 | 222,411 |
| Mode SS | |||
|---|---|---|---|
| Quadrant | BADHDUFLAG | Total packets | Discarded packets |
| A | 0 | 66 | 0 |
| B | 0 | 66 | 0 |
| C | 0 | 66 | 0 |
| D | 0 | 66 | 0 |
| Mode M0 | |||
|---|---|---|---|
| Quadrant | BADHDUFLAG | Total packets | Discarded packets |
| A | 0 | 6811 | 1 |
| B | 0 | 7258 | 1 |
| C | 0 | 6826 | 1 |
| D | 0 | 7361 | 1 |
| Mode M9 | |||
|---|---|---|---|
| Quadrant | BADHDUFLAG | Total packets | Discarded packets |
| A | 0 | 12 | 0 |
| B | 0 | 12 | 0 |
| C | 0 | 12 | 0 |
| D | 0 | 12 | 0 |
| Quadrant | Total seconds | Saturated seconds | Saturation percentage |
|---|---|---|---|
| A | 3191 | 41 | 1.284864% |
| B | 3191 | 67 | 2.099655% |
| C | 3191 | 54 | 1.692259% |
| D | 3191 | 40 | 1.253526% |
Noise dominated data is calculated using 1-second bins in cleaned event files. If a bin has >2000 counts, and if more than 50% of those come from <1% of pixels, then it is considered to be noise-dominated and hence unusable.
| Quadrant | # 1 sec bins | Bins with >0 counts | Bins with >2000 counts | High rate bins dominated by noise | Noise dominated (total time) | Noise dominated (detector-on time) | Marked lightcurve |
|---|---|---|---|---|---|---|---|
| A | 4376 | 3192 | 0 | 0 | 0.00% | 0.00% | 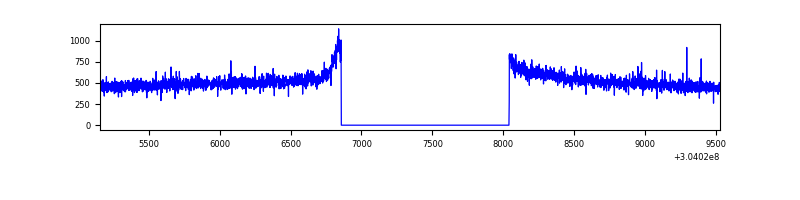 |
| B | 4376 | 3192 | 17 | 17 | 0.39% | 0.53% | 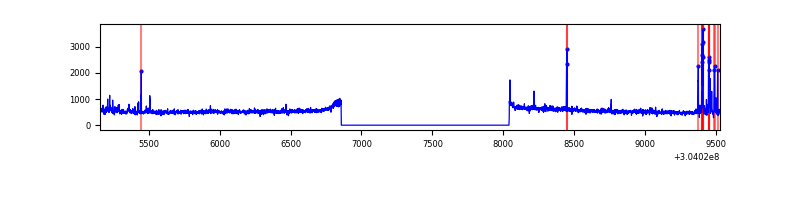 |
| C | 4376 | 3192 | 0 | 0 | 0.00% | 0.00% | 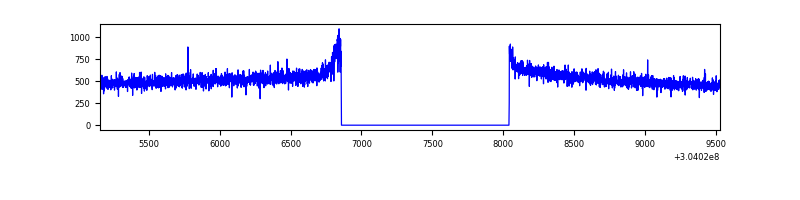 |
| D | 4376 | 3192 | 9 | 9 | 0.21% | 0.28% | 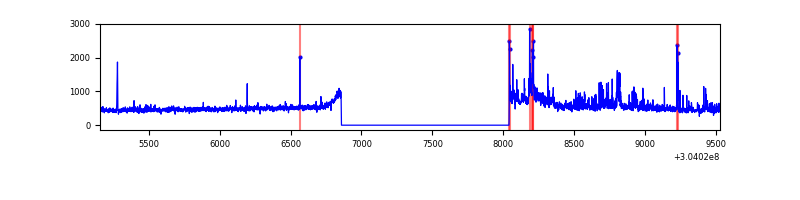 |
Top three noisy pixels from each quadrant. If the there are fewer than three noisy pixels in the level2.evt file, extra rows are filled as -1
| Pixel properties | Quadrant properties | ||||||
|---|---|---|---|---|---|---|---|
| Quadrant | DetID | PixID | Counts | Sigma | Mean | Median | Sigma |
| A | 13 | 254 | 4337 | 44.37 | 429 | 420 | 88.3 |
| A | 0 | 226 | 3757 | 37.8 | 429 | 420 | 88.3 |
| A | 3 | 137 | 3471 | 34.56 | 429 | 420 | 88.3 |
| B | 7 | 220 | 62668 | 753.44 | 431 | 421 | 82.6 |
| B | 0 | 219 | 28680 | 342.05 | 431 | 421 | 82.6 |
| B | 6 | 36 | 10934 | 127.25 | 431 | 421 | 82.6 |
| C | 14 | 238 | 65479 | 670.57 | 412 | 414 | 97.0 |
| C | 13 | 61 | 2955 | 26.19 | 412 | 414 | 97.0 |
| C | 3 | 9 | 1201 | 8.11 | 412 | 414 | 97.0 |
| D | 12 | 233 | 93123 | 910.2 | 415 | 403 | 101.9 |
| D | 1 | 52 | 50174 | 488.58 | 415 | 403 | 101.9 |
| D | 7 | 238 | 42229 | 410.59 | 415 | 403 | 101.9 |
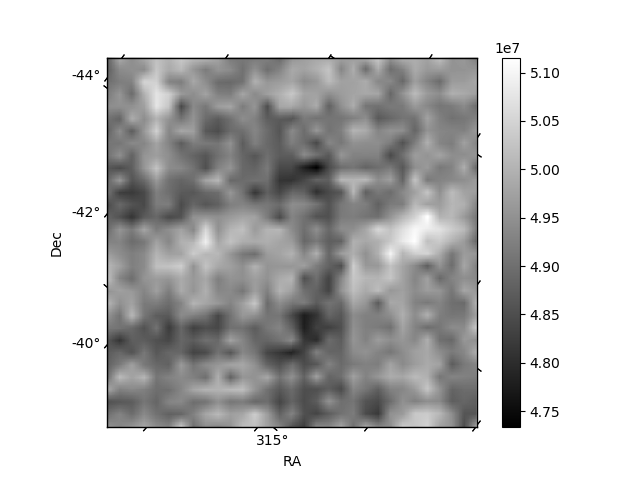
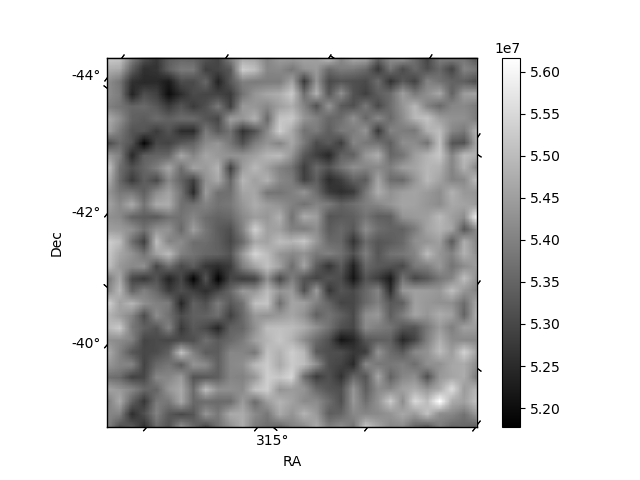
Histogram calculated using DETX and DETY for each event in the final _common_clean file
| Quadrant A | 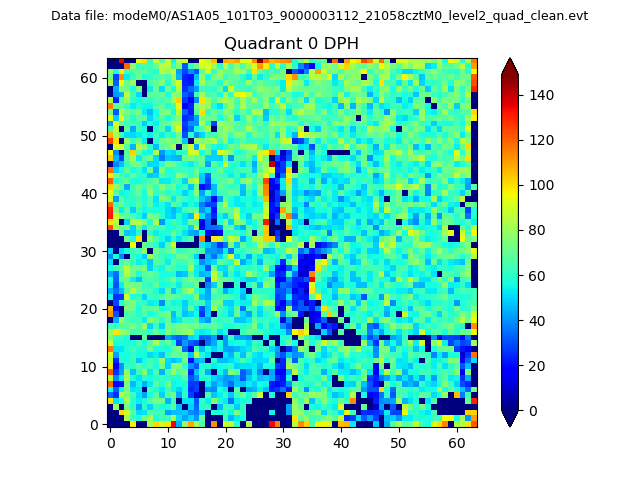 |
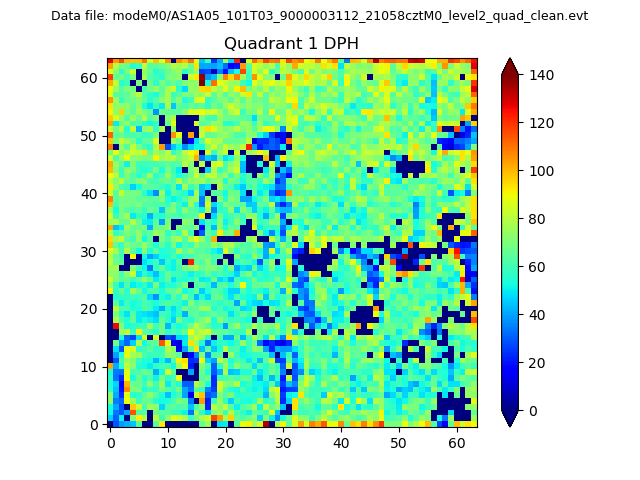 |
Quadrant B |
|---|---|---|---|
| Quadrant D | 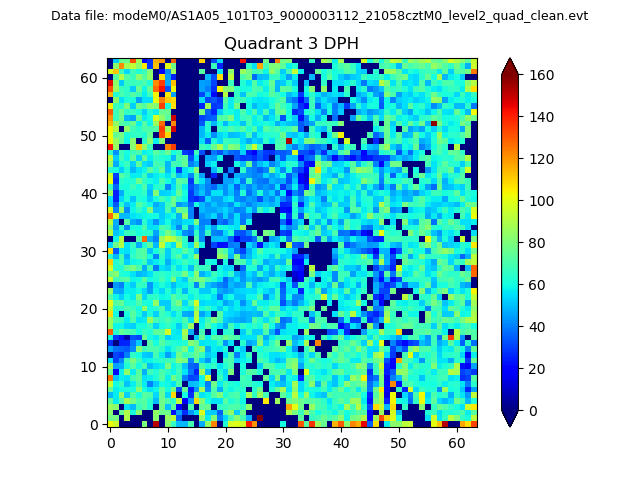 |
 |
Quadrant C |
| Plot type | Count rate plots | Images |
|---|---|---|
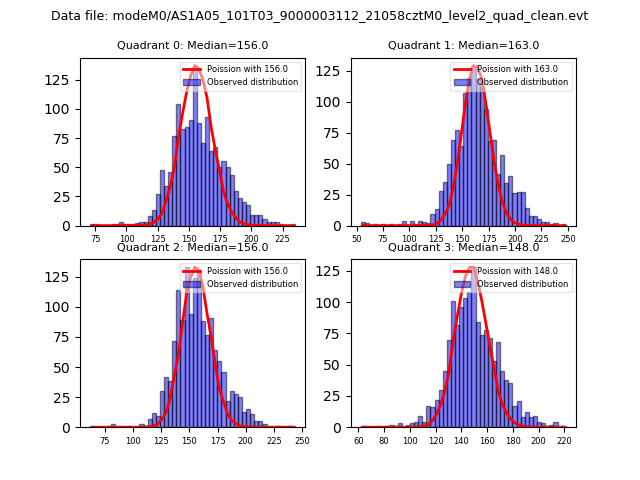
| Comparison with Poisson distribution Blue bars denote a histogram of data divided into 1 sec bins. Red curve is a Poisson curve with rate = median count rate of data. |
 |
 |
| Quadrant-wise count rates Data is divided into 100 sec bins |
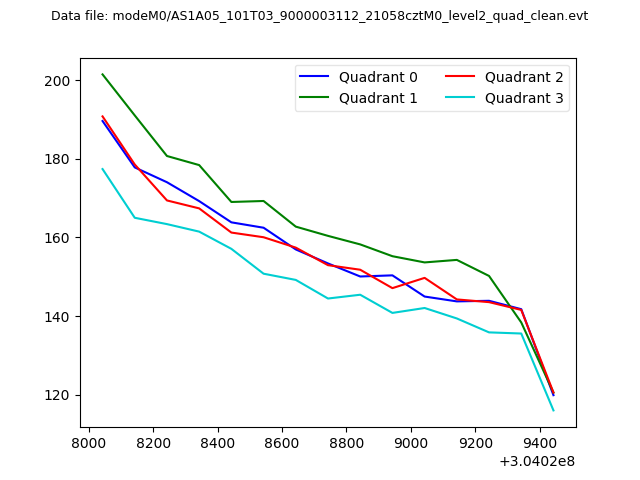 |
|
| Module-wise count rates for Quadrant A Data is divided into 100 sec bins |
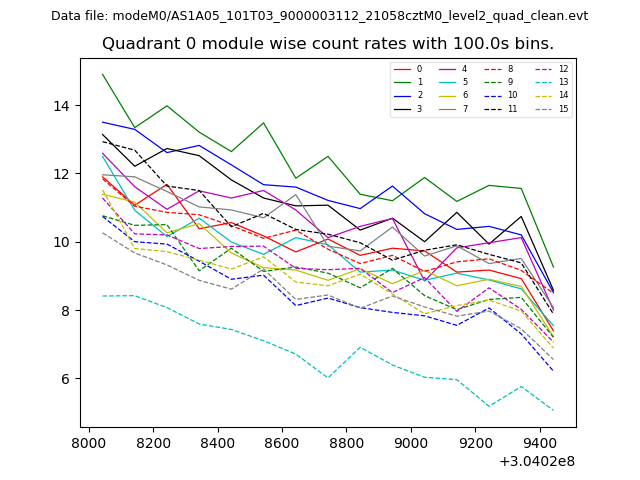 |
 |
| Module-wise count rates for Quadrant B Data is divided into 100 sec bins |
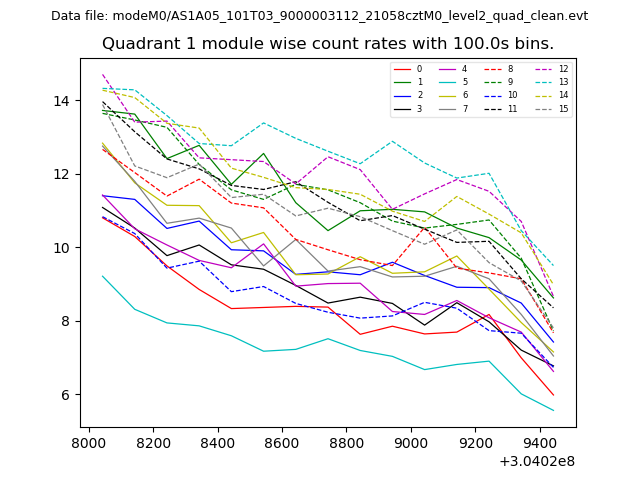 |
 |
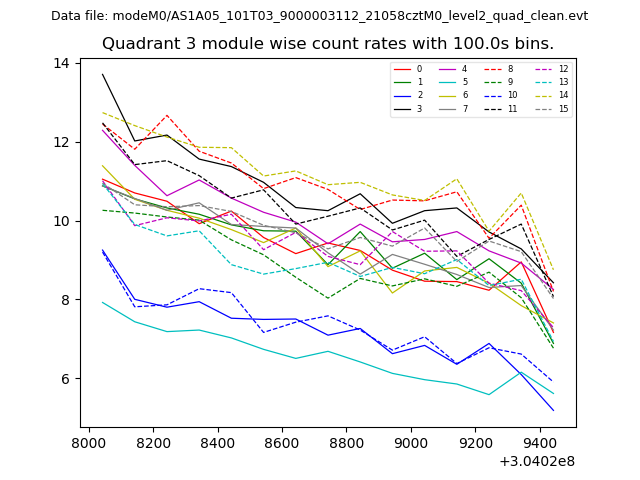
| Module-wise count rates for Quadrant C Data is divided into 100 sec bins |
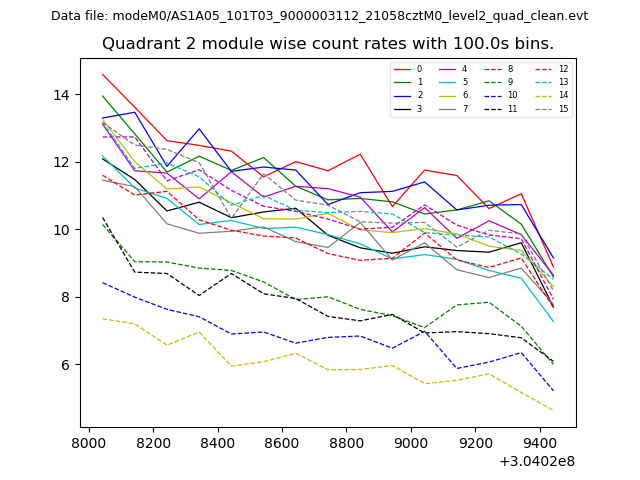 |
 |
| Module-wise count rates for Quadrant D Data is divided into 100 sec bins |
 |
 |
| Parameter | Plot |
|---|---|
| CZT HV Monitor | 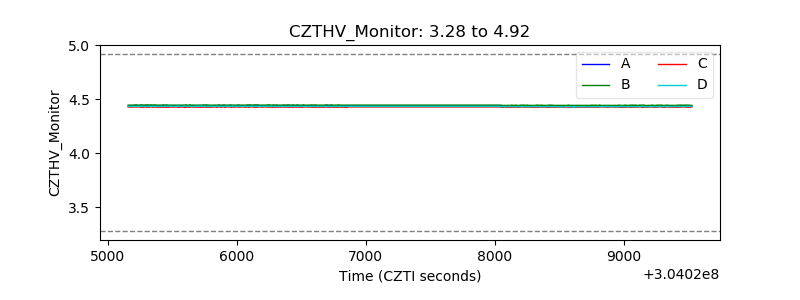 |
| D_VDD | 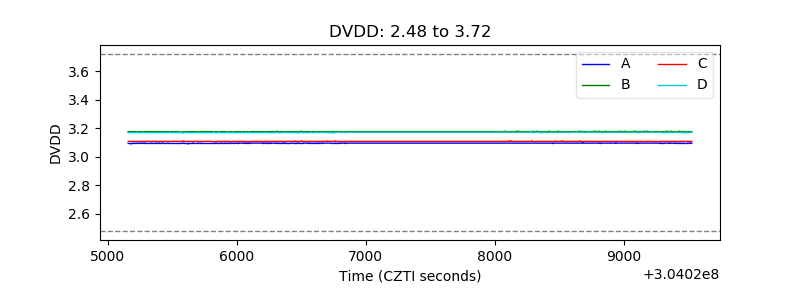 |
| Temperature 1 | 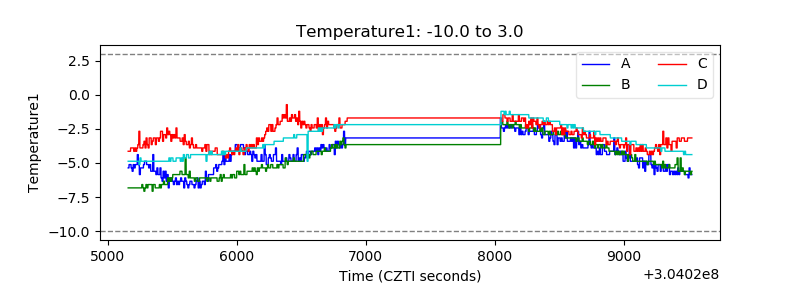 |
| Veto HV Monitor | 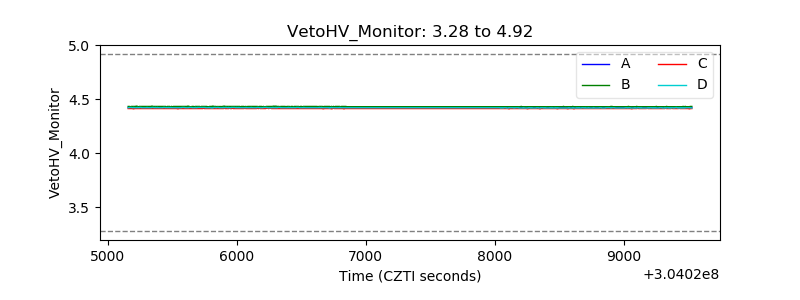 |
| Veto LLD | 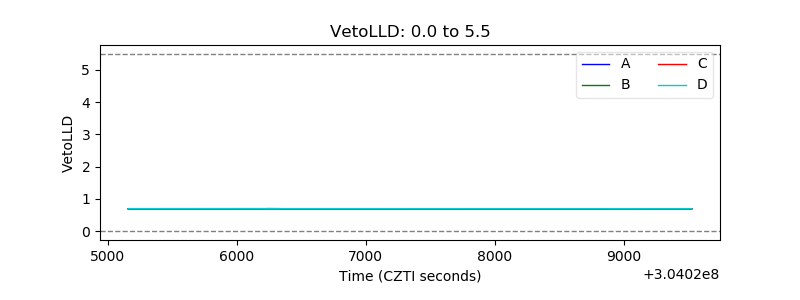 |
| Alpha Counter | 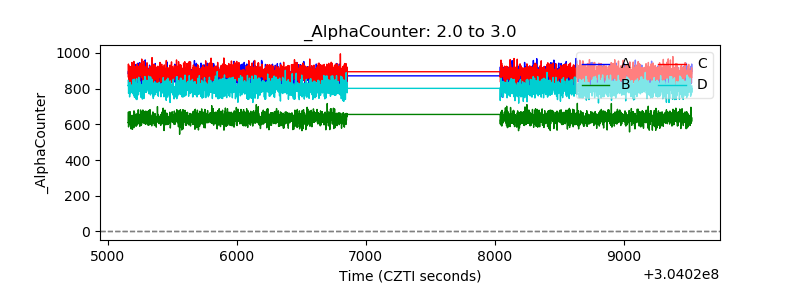 |
| _CPM_Rate | 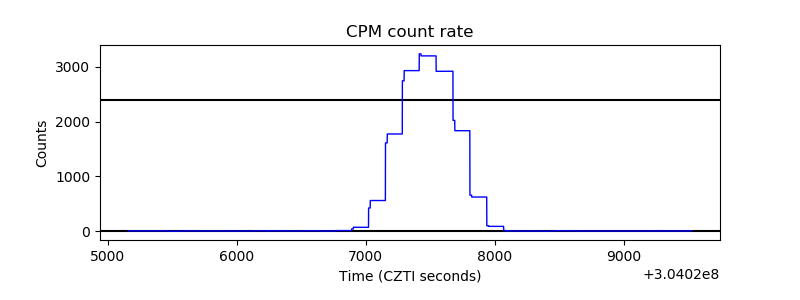 |
| CZT Counter |  |
| +2.5 Volts monitor |  |
| +5 Volts monitor | 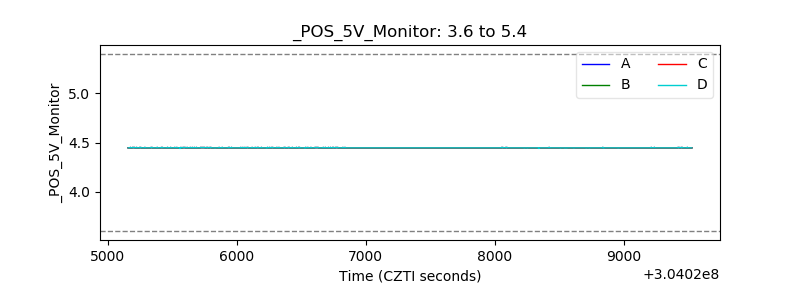 |
| _ROLL_ROT | 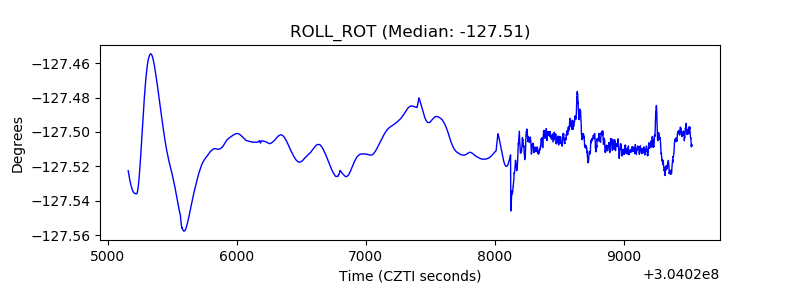 |
| _Roll_DEC | 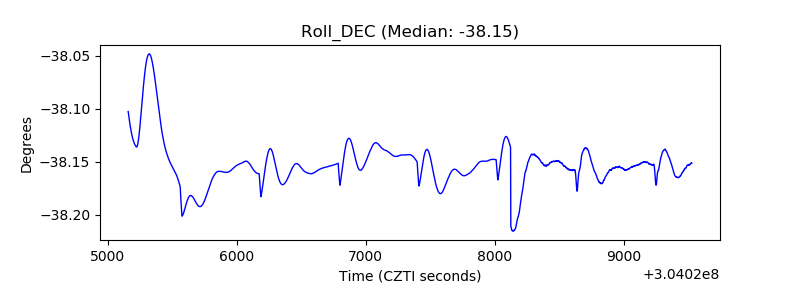 |
| _Roll_RA | 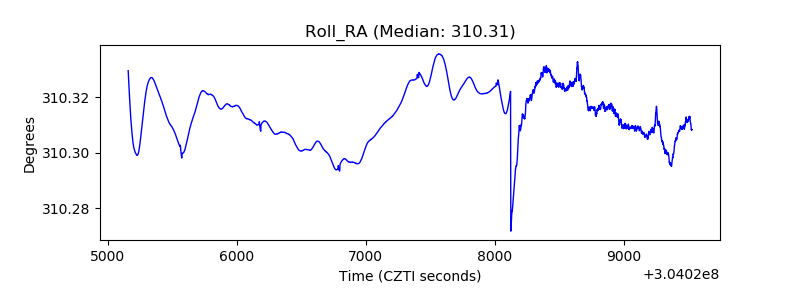 |
| Veto Counter | 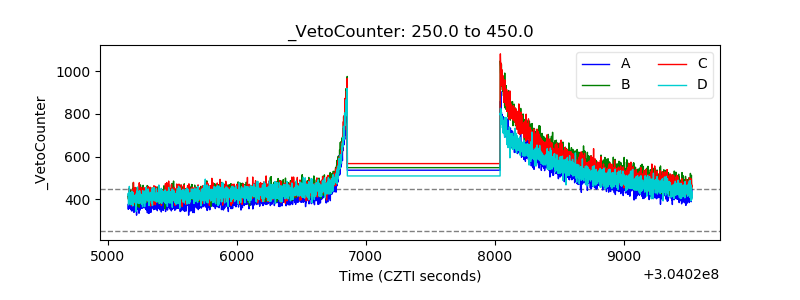 |