| Param | Original file | Final file |
|---|---|---|
| Filename | modeM0/AS1A05_101T03_9000003112_21059cztM0_level2.evt | modeM0/AS1A05_101T03_9000003112_21059cztM0_level2_quad_clean.evt |
| Size (bytes) | 457,560,000 | 95,405,760 |
| Size | 436.4 MB | 91.0 MB |
| Events in quadrant A | 3,079,405 | 618,066 |
| Events in quadrant B | 3,334,379 | 644,263 |
| Events in quadrant C | 3,136,428 | 615,156 |
| Events in quadrant D | 3,886,507 | 579,440 |
| Mode SS | |||
|---|---|---|---|
| Quadrant | BADHDUFLAG | Total packets | Discarded packets |
| A | 0 | 128 | 0 |
| B | 0 | 128 | 0 |
| C | 0 | 128 | 0 |
| D | 0 | 128 | 0 |
| Mode M0 | |||
|---|---|---|---|
| Quadrant | BADHDUFLAG | Total packets | Discarded packets |
| A | 0 | 13054 | 2 |
| B | 0 | 13678 | 2 |
| C | 0 | 13077 | 2 |
| D | 0 | 15678 | 2 |
| Mode M9 | |||
|---|---|---|---|
| Quadrant | BADHDUFLAG | Total packets | Discarded packets |
| A | 0 | 18 | 0 |
| B | 0 | 19 | 0 |
| C | 0 | 19 | 0 |
| D | 0 | 19 | 0 |
| Quadrant | Total seconds | Saturated seconds | Saturation percentage |
|---|---|---|---|
| A | 6185 | 24 | 0.388036% |
| B | 6185 | 67 | 1.083266% |
| C | 6185 | 46 | 0.743735% |
| D | 6185 | 117 | 1.891673% |
Noise dominated data is calculated using 1-second bins in cleaned event files. If a bin has >2000 counts, and if more than 50% of those come from <1% of pixels, then it is considered to be noise-dominated and hence unusable.
| Quadrant | # 1 sec bins | Bins with >0 counts | Bins with >2000 counts | High rate bins dominated by noise | Noise dominated (total time) | Noise dominated (detector-on time) | Marked lightcurve |
|---|---|---|---|---|---|---|---|
| A | 7470 | 6186 | 0 | 0 | 0.00% | 0.00% | 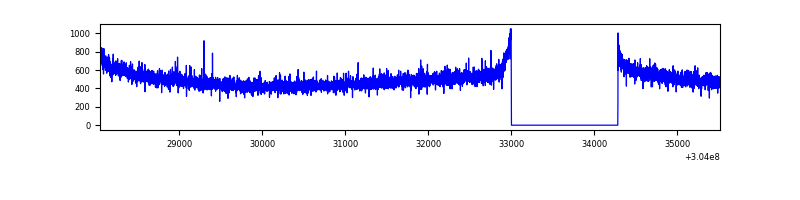 |
| B | 7470 | 6186 | 16 | 16 | 0.21% | 0.26% | 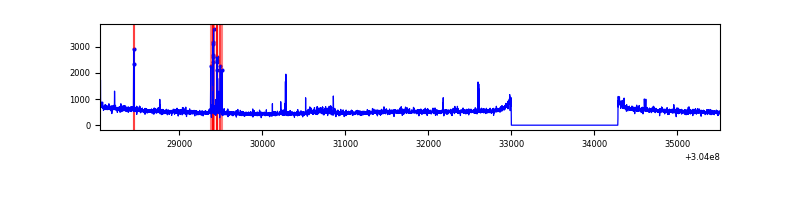 |
| C | 7470 | 6186 | 0 | 0 | 0.00% | 0.00% | 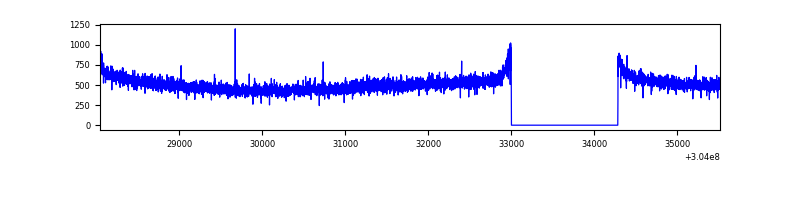 |
| D | 7470 | 6186 | 92 | 92 | 1.23% | 1.49% | 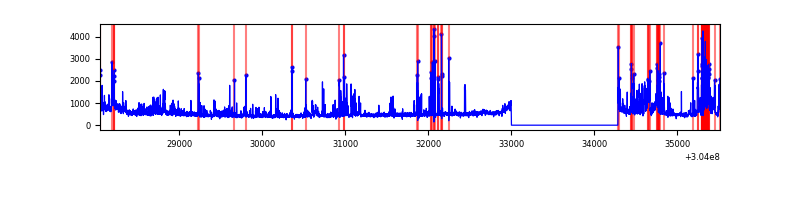 |
Top three noisy pixels from each quadrant. If the there are fewer than three noisy pixels in the level2.evt file, extra rows are filled as -1
| Pixel properties | Quadrant properties | ||||||
|---|---|---|---|---|---|---|---|
| Quadrant | DetID | PixID | Counts | Sigma | Mean | Median | Sigma |
| A | 13 | 254 | 8056 | 45.42 | 799 | 786 | 160.1 |
| A | 0 | 226 | 6976 | 38.68 | 799 | 786 | 160.1 |
| A | 3 | 137 | 6368 | 34.88 | 799 | 786 | 160.1 |
| B | 7 | 220 | 64419 | 422.46 | 808 | 791 | 150.6 |
| B | 0 | 219 | 55994 | 366.52 | 808 | 791 | 150.6 |
| B | 3 | 64 | 20365 | 129.96 | 808 | 791 | 150.6 |
| C | 14 | 238 | 124509 | 699.19 | 771 | 781 | 177.0 |
| C | 13 | 61 | 5371 | 25.94 | 771 | 781 | 177.0 |
| C | 3 | 9 | 2824 | 11.55 | 771 | 781 | 177.0 |
| D | 7 | 238 | 460516 | 2502.86 | 764 | 743 | 183.7 |
| D | 1 | 52 | 332626 | 1806.66 | 764 | 743 | 183.7 |
| D | 12 | 233 | 98917 | 534.43 | 764 | 743 | 183.7 |
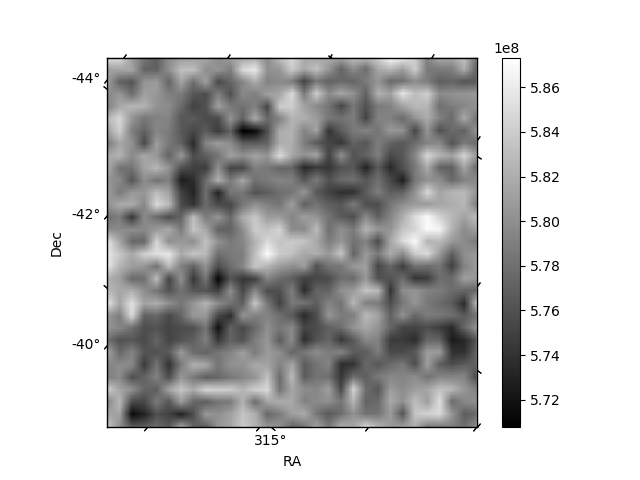
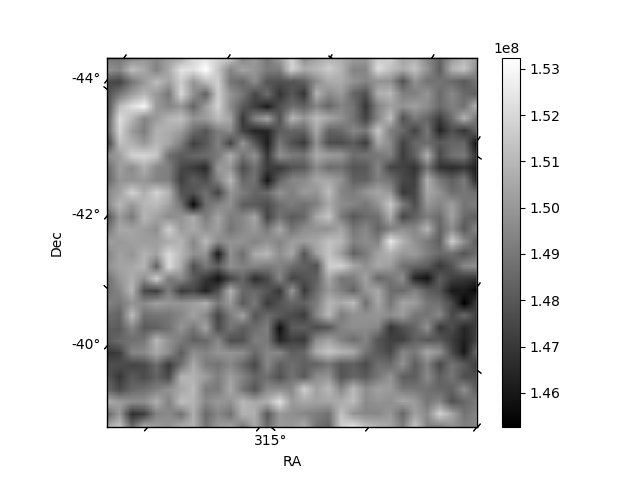
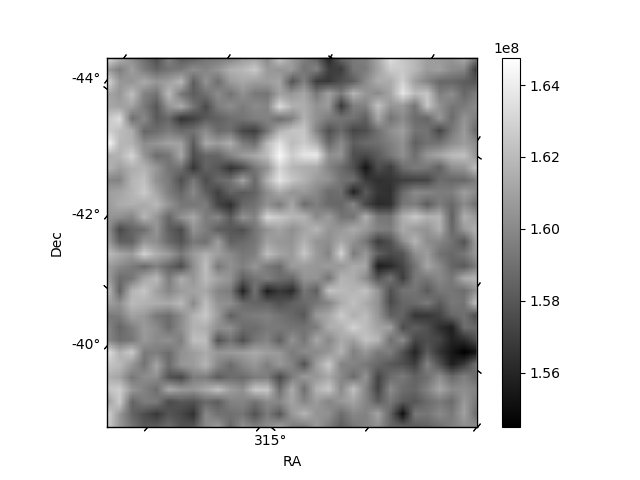
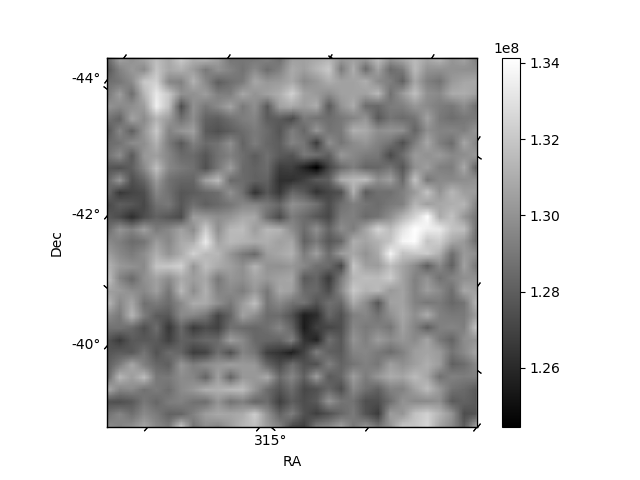
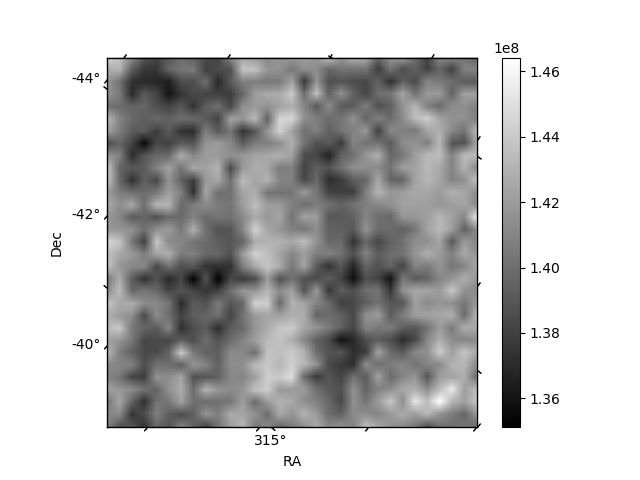
Histogram calculated using DETX and DETY for each event in the final _common_clean file
| Quadrant A |  |
 |
Quadrant B |
|---|---|---|---|
| Quadrant D |  |
 |
Quadrant C |
| Plot type | Count rate plots | Images |
|---|---|---|
| Comparison with Poisson distribution Blue bars denote a histogram of data divided into 1 sec bins. Red curve is a Poisson curve with rate = median count rate of data. |
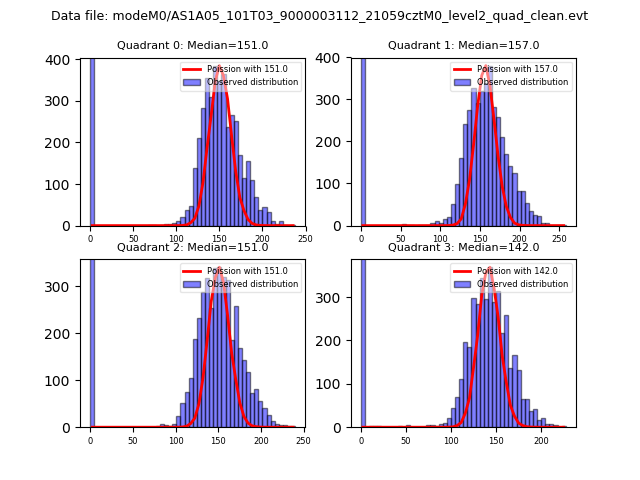 |
 |
| Quadrant-wise count rates Data is divided into 100 sec bins |
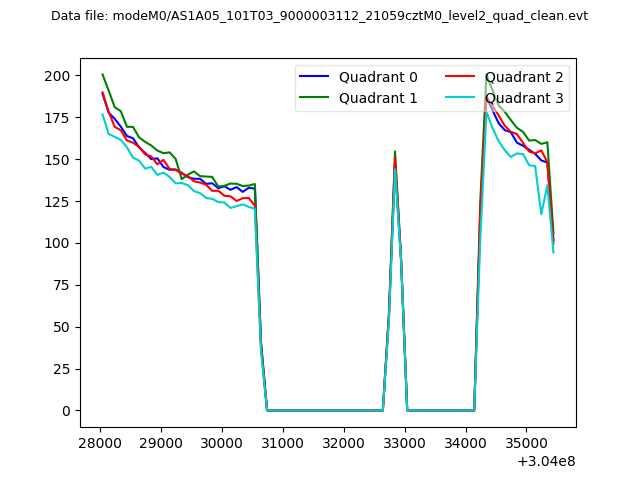 |
|
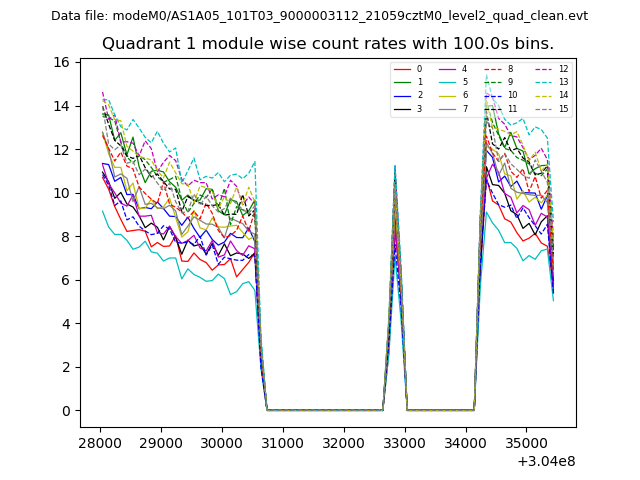
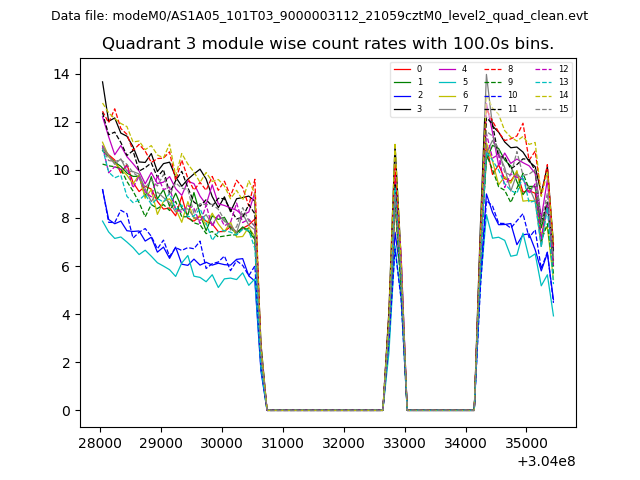
| Module-wise count rates for Quadrant A Data is divided into 100 sec bins |
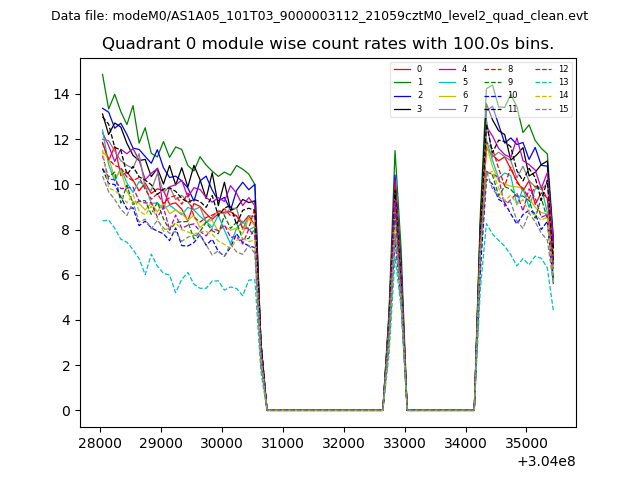 |
 |
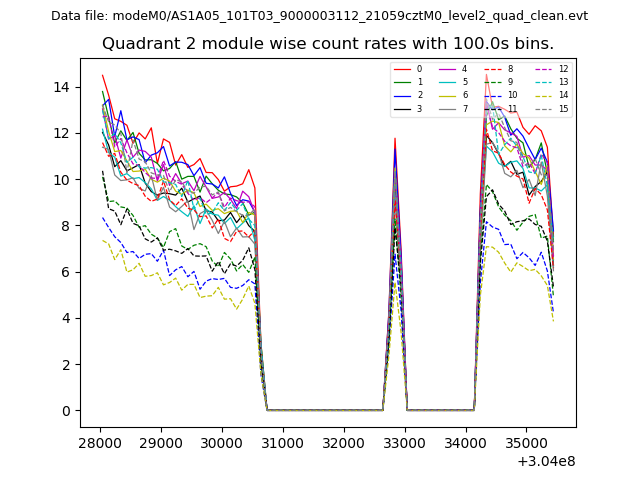
| Module-wise count rates for Quadrant B Data is divided into 100 sec bins |
 |
 |
| Module-wise count rates for Quadrant C Data is divided into 100 sec bins |
 |
 |
| Module-wise count rates for Quadrant D Data is divided into 100 sec bins |
 |
 |
| Parameter | Plot |
|---|---|
| CZT HV Monitor | 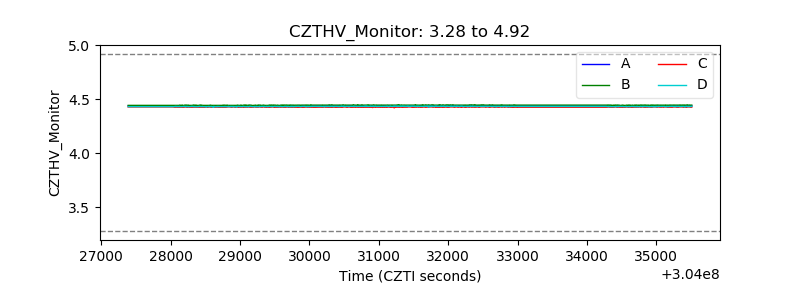 |
| D_VDD | 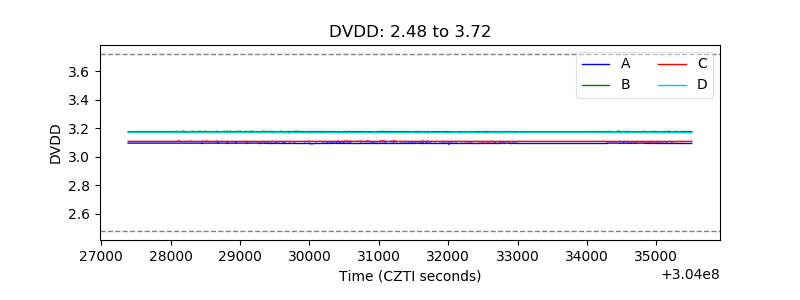 |
| Temperature 1 | 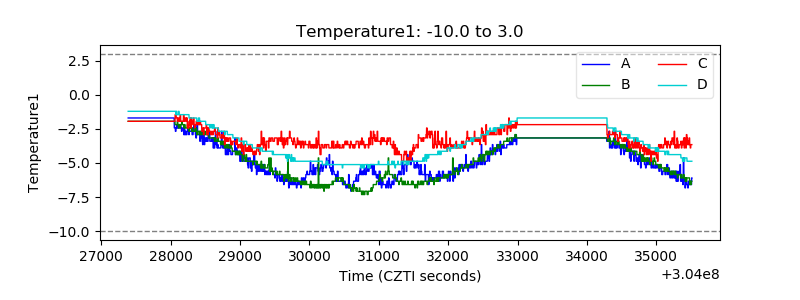 |
| Veto HV Monitor | 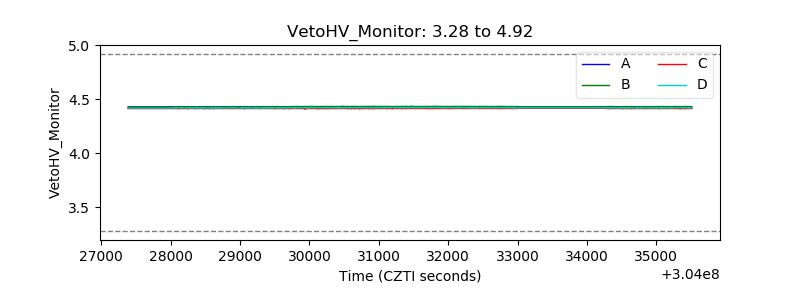 |
| Veto LLD |  |
| Alpha Counter | 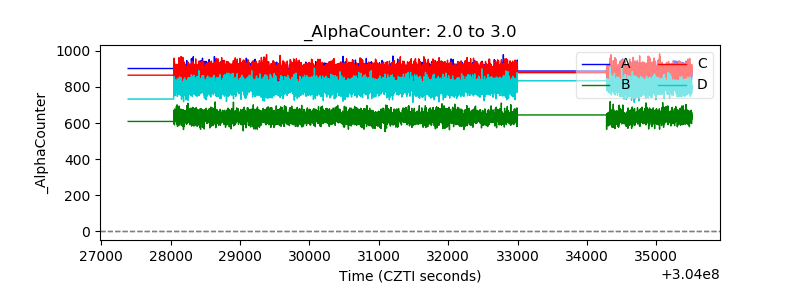 |
| _CPM_Rate | 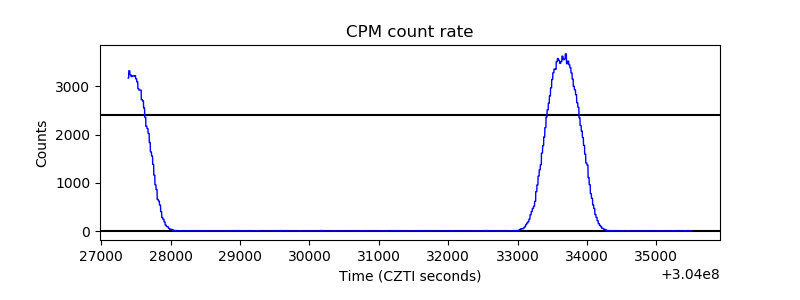 |
| CZT Counter | 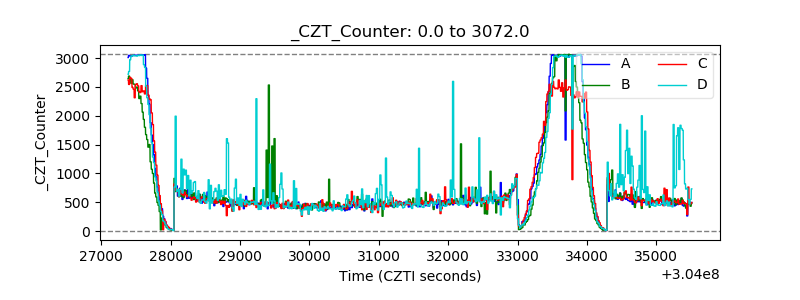 |
| +2.5 Volts monitor |  |
| +5 Volts monitor | 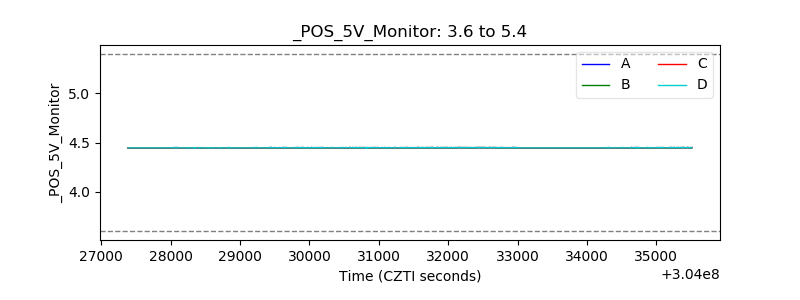 |
| _ROLL_ROT | 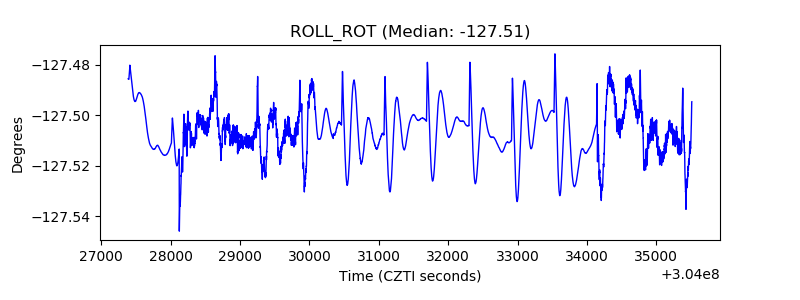 |
| _Roll_DEC | 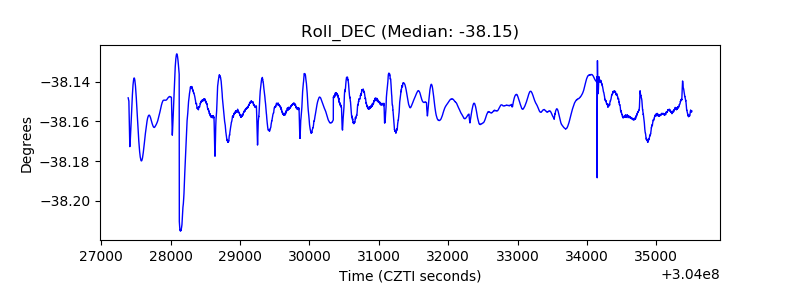 |
| _Roll_RA | 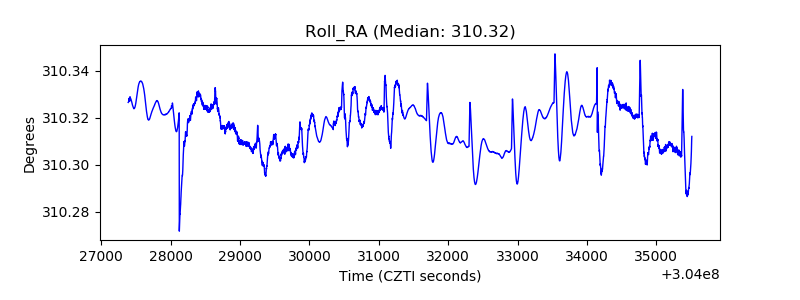 |
| Veto Counter | 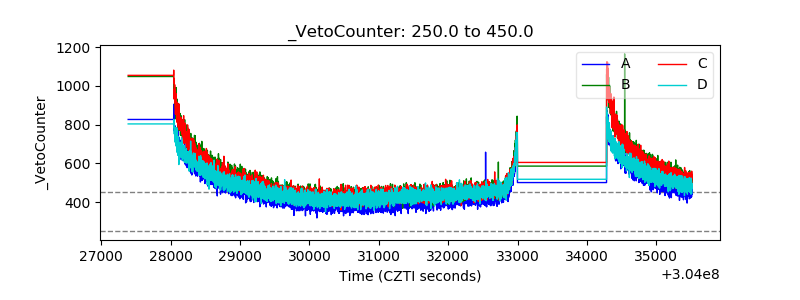 |