| Param | Original file | Final file |
|---|---|---|
| Filename | modeM0/AS1A05_101T03_9000003112_21062cztM0_level2.evt | modeM0/AS1A05_101T03_9000003112_21062cztM0_level2_quad_clean.evt |
| Size (bytes) | 1,079,421,120 | 200,825,280 |
| Size | 1.0 GB | 191.5 MB |
| Events in quadrant A | 7,314,211 | 1,266,886 |
| Events in quadrant B | 7,848,010 | 1,314,969 |
| Events in quadrant C | 7,520,909 | 1,271,658 |
| Events in quadrant D | 9,000,755 | 1,201,306 |
| Mode SS | |||
|---|---|---|---|
| Quadrant | BADHDUFLAG | Total packets | Discarded packets |
| A | 0 | 304 | 0 |
| B | 0 | 304 | 0 |
| C | 0 | 304 | 0 |
| D | 0 | 304 | 0 |
| Mode M0 | |||
|---|---|---|---|
| Quadrant | BADHDUFLAG | Total packets | Discarded packets |
| A | 0 | 31046 | 3 |
| B | 0 | 32196 | 3 |
| C | 0 | 31138 | 3 |
| D | 0 | 36414 | 3 |
| Mode M9 | |||
|---|---|---|---|
| Quadrant | BADHDUFLAG | Total packets | Discarded packets |
| A | 0 | 40 | 0 |
| B | 0 | 40 | 0 |
| C | 0 | 40 | 0 |
| D | 0 | 40 | 0 |
| Quadrant | Total seconds | Saturated seconds | Saturation percentage |
|---|---|---|---|
| A | 14889 | 67 | 0.449997% |
| B | 14890 | 166 | 1.114842% |
| C | 14890 | 144 | 0.967092% |
| D | 14890 | 272 | 1.826729% |
Noise dominated data is calculated using 1-second bins in cleaned event files. If a bin has >2000 counts, and if more than 50% of those come from <1% of pixels, then it is considered to be noise-dominated and hence unusable.
| Quadrant | # 1 sec bins | Bins with >0 counts | Bins with >2000 counts | High rate bins dominated by noise | Noise dominated (total time) | Noise dominated (detector-on time) | Marked lightcurve |
|---|---|---|---|---|---|---|---|
| A | 18869 | 14892 | 1 | 1 | 0.01% | 0.01% | 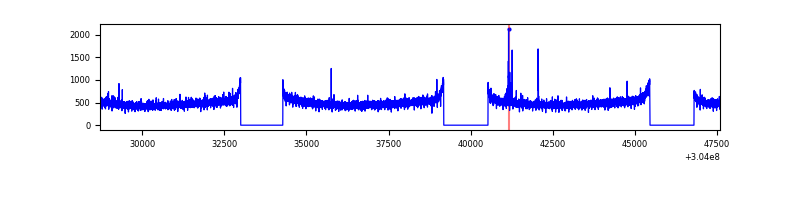 |
| B | 18870 | 14893 | 29 | 29 | 0.15% | 0.19% | 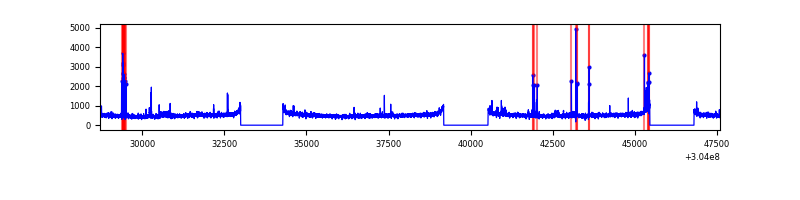 |
| C | 18870 | 14893 | 0 | 0 | 0.00% | 0.00% | 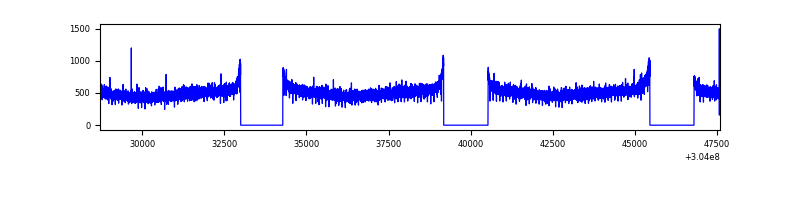 |
| D | 18870 | 14893 | 255 | 255 | 1.35% | 1.71% | 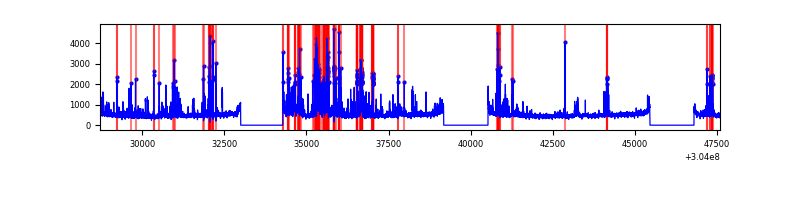 |
Top three noisy pixels from each quadrant. If the there are fewer than three noisy pixels in the level2.evt file, extra rows are filled as -1
| Pixel properties | Quadrant properties | ||||||
|---|---|---|---|---|---|---|---|
| Quadrant | DetID | PixID | Counts | Sigma | Mean | Median | Sigma |
| A | 12 | 96 | 30317 | 76.39 | 1891 | 1856 | 372.6 |
| A | 13 | 254 | 19792 | 48.14 | 1891 | 1856 | 372.6 |
| A | 0 | 226 | 16191 | 38.48 | 1891 | 1856 | 372.6 |
| B | 7 | 220 | 115987 | 323.79 | 1913 | 1869 | 352.4 |
| B | 0 | 219 | 115075 | 321.2 | 1913 | 1869 | 352.4 |
| B | 3 | 64 | 73540 | 203.35 | 1913 | 1869 | 352.4 |
| C | 14 | 238 | 294845 | 682.38 | 1852 | 1866 | 429.3 |
| C | 13 | 61 | 12780 | 25.42 | 1852 | 1866 | 429.3 |
| C | 3 | 9 | 9952 | 18.83 | 1852 | 1866 | 429.3 |
| D | 7 | 238 | 790278 | 1788.35 | 1832 | 1785 | 440.9 |
| D | 1 | 52 | 659119 | 1490.87 | 1832 | 1785 | 440.9 |
| D | 9 | 1 | 468896 | 1059.43 | 1832 | 1785 | 440.9 |
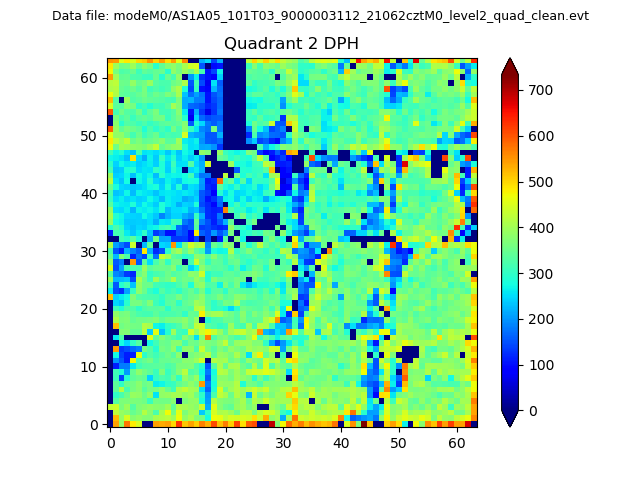
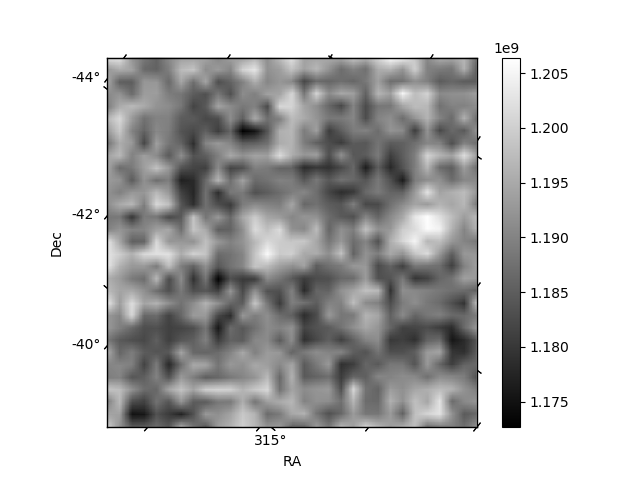
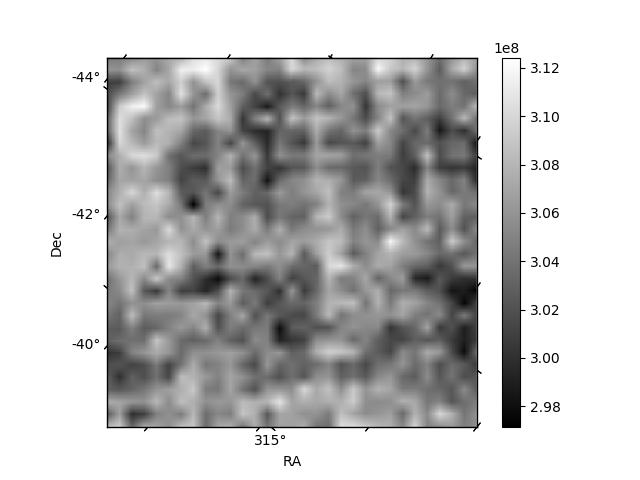
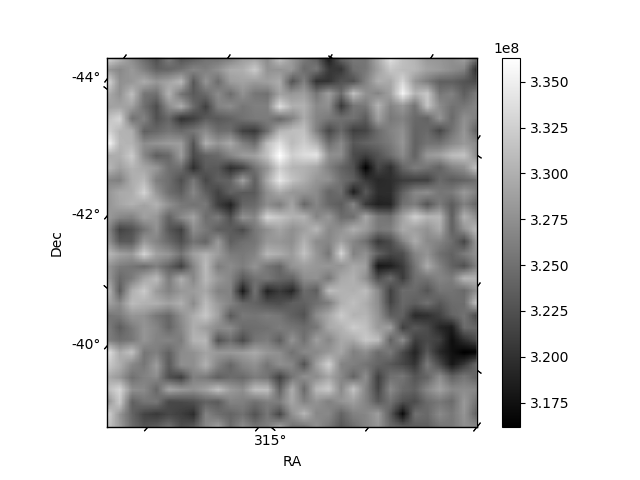
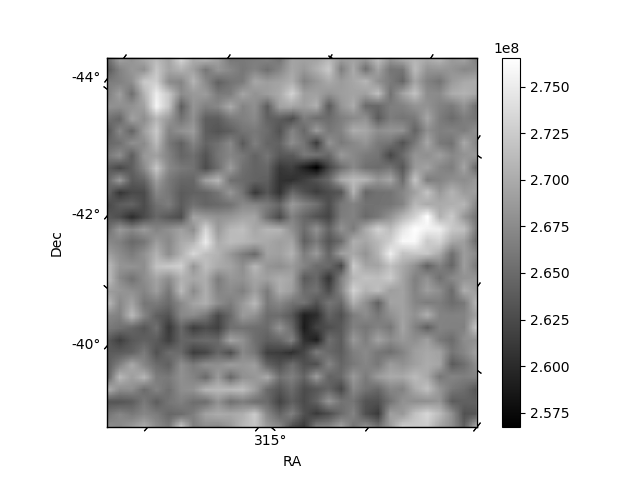
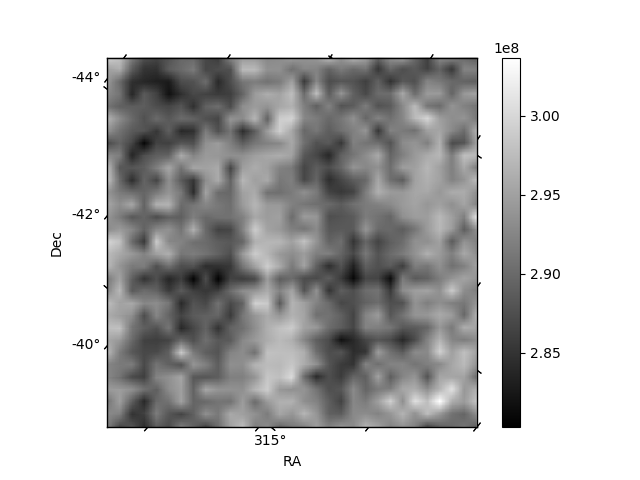
Histogram calculated using DETX and DETY for each event in the final _common_clean file
| Quadrant A | 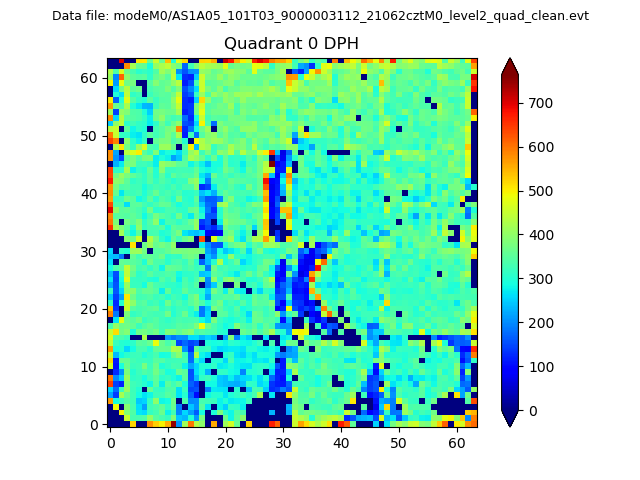 |
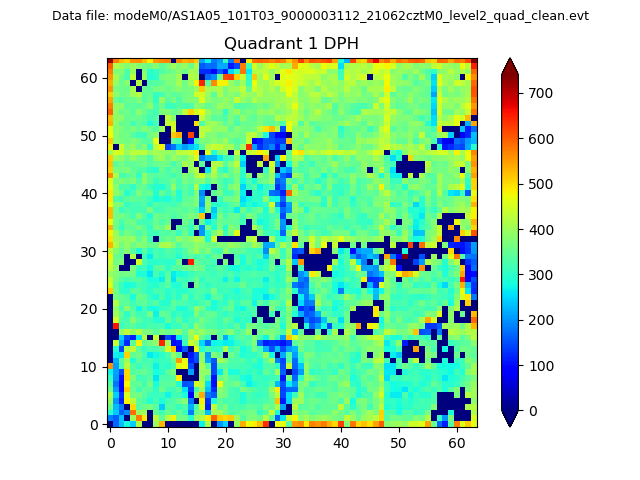 |
Quadrant B |
|---|---|---|---|
| Quadrant D | 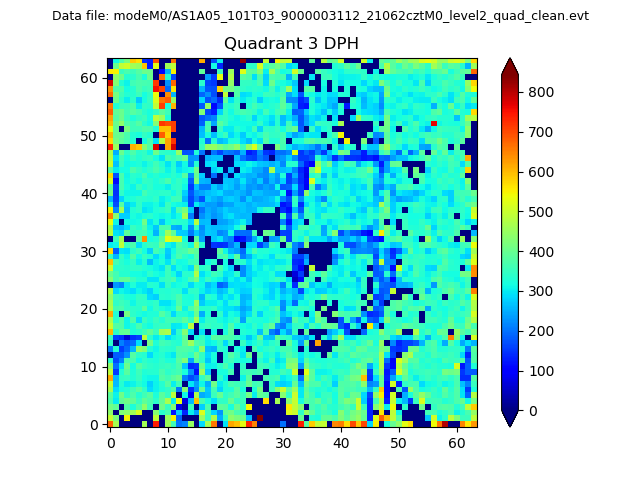 |
 |
Quadrant C |
| Plot type | Count rate plots | Images |
|---|---|---|
| Comparison with Poisson distribution Blue bars denote a histogram of data divided into 1 sec bins. Red curve is a Poisson curve with rate = median count rate of data. |
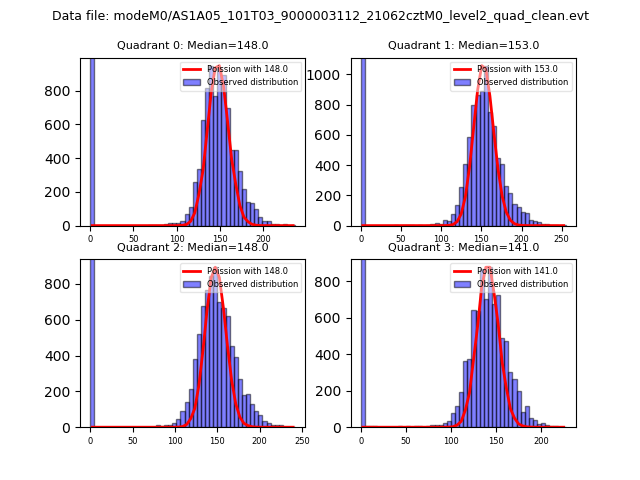 |
 |
| Quadrant-wise count rates Data is divided into 100 sec bins |
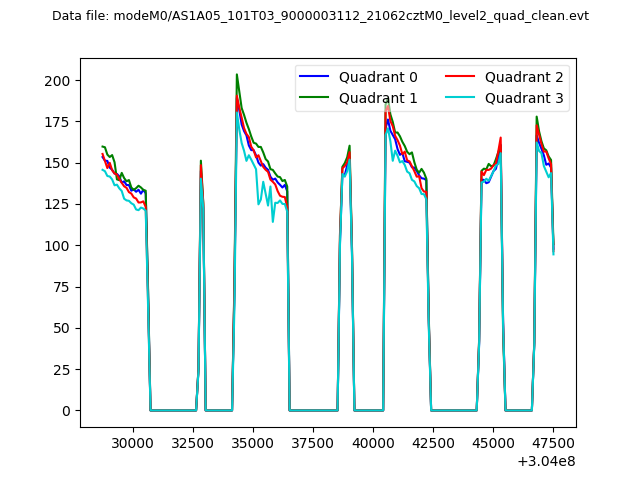 |
|
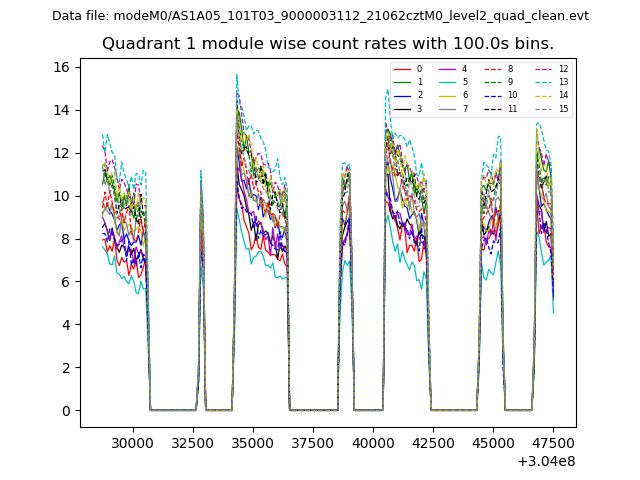
| Module-wise count rates for Quadrant A Data is divided into 100 sec bins |
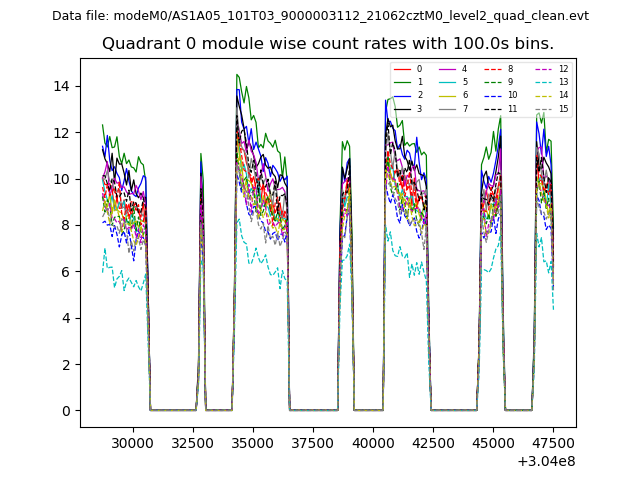 |
 |
| Module-wise count rates for Quadrant B Data is divided into 100 sec bins |
 |
 |
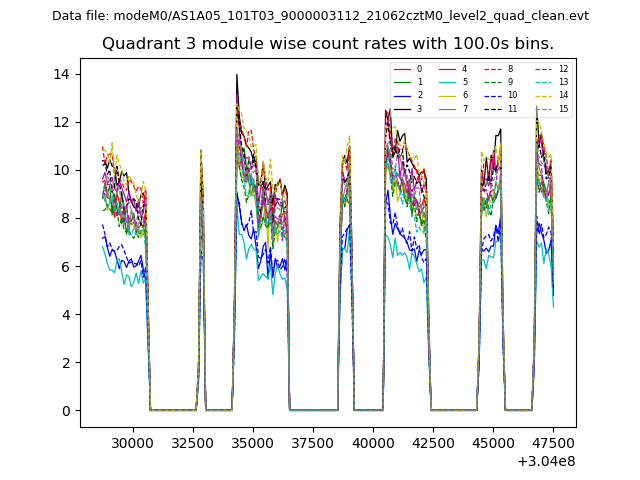
| Module-wise count rates for Quadrant C Data is divided into 100 sec bins |
 |
 |
| Module-wise count rates for Quadrant D Data is divided into 100 sec bins |
 |
 |
| Parameter | Plot |
|---|---|
| CZT HV Monitor | 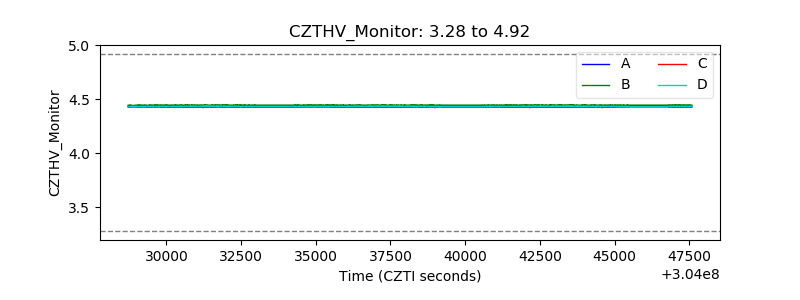 |
| D_VDD |  |
| Temperature 1 | 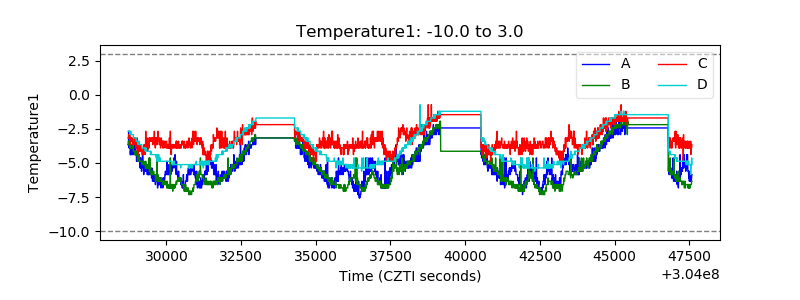 |
| Veto HV Monitor | 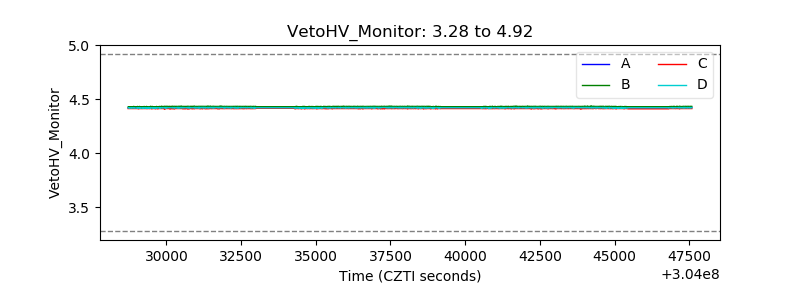 |
| Veto LLD |  |
| Alpha Counter | 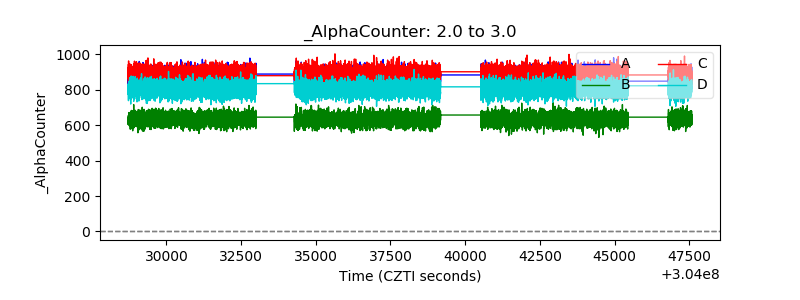 |
| _CPM_Rate | 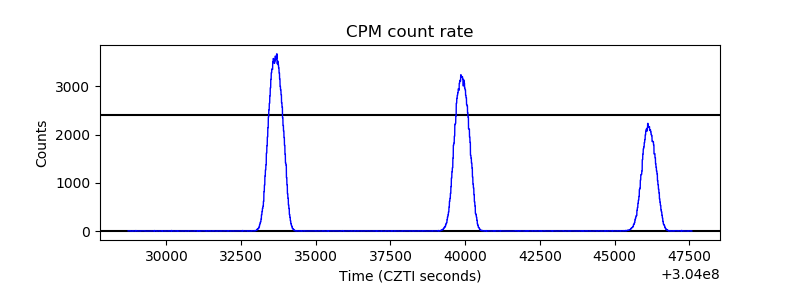 |
| CZT Counter | 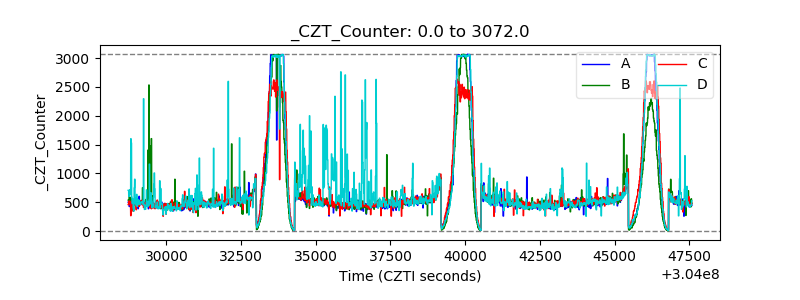 |
| +2.5 Volts monitor |  |
| +5 Volts monitor |  |
| _ROLL_ROT |  |
| _Roll_DEC | 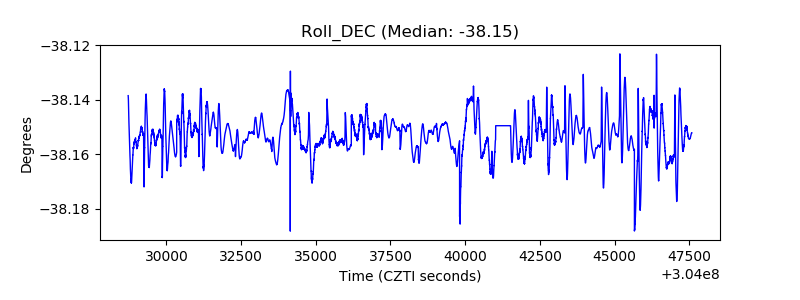 |
| _Roll_RA | 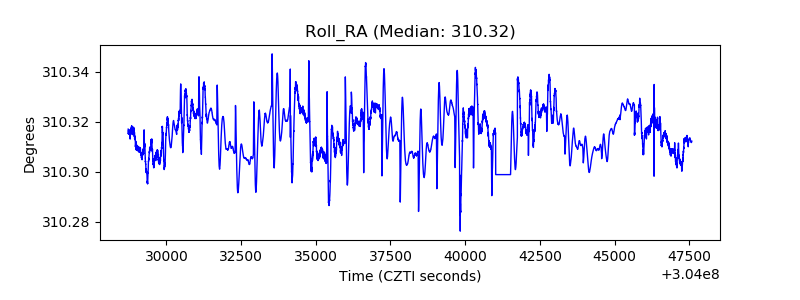 |
| Veto Counter | 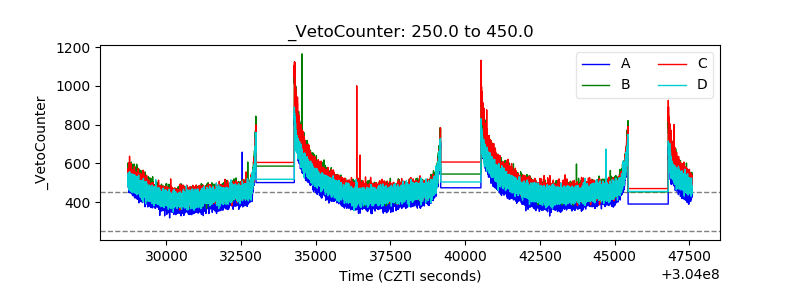 |