| Param | Original file | Final file |
|---|---|---|
| Filename | modeM0/AS1A05_075T05_9000003116cztM0_level2.fits | modeM0/AS1A05_075T05_9000003116cztM0_level2_quad_clean.evt |
| Size (bytes) | 665,118,720 | 636,923,520 |
| Size | 634.3 MB | 607.4 MB |
| Events in quadrant A | 4,154,132 | 3,914,412 |
| Events in quadrant B | 3,991,256 | 3,896,112 |
| Events in quadrant C | 4,080,092 | 3,703,626 |
| Events in quadrant D | 3,127,684 | 2,990,230 |
| Mode SS | |||
|---|---|---|---|
| Quadrant | BADHDUFLAG | Total packets | Discarded packets |
| A | 0 | 1418 | 0 |
| B | 0 | 1418 | 0 |
| C | 0 | 1418 | 0 |
| D | 0 | 1418 | 0 |
| Mode M0 | |||
|---|---|---|---|
| Quadrant | BADHDUFLAG | Total packets | Discarded packets |
| A | 0 | 145758 | 0 |
| B | 0 | 154022 | 0 |
| C | 0 | 144221 | 0 |
| D | 0 | 258548 | 0 |
| Mode M9 | |||
|---|---|---|---|
| Quadrant | BADHDUFLAG | Total packets | Discarded packets |
| A | 0 | 119 | 0 |
| B | 0 | 119 | 0 |
| C | 0 | 119 | 0 |
| D | 0 | 119 | 0 |
| Quadrant | Total seconds | Saturated seconds | Saturation percentage |
|---|---|---|---|
| A | 69784 | 702 | 1.005961% |
| B | 69784 | 1177 | 1.686633% |
| C | 69784 | 883 | 1.265333% |
| D | 69784 | 12093 | 17.329187% |
Noise dominated data is calculated using 1-second bins in cleaned event files. If a bin has >2000 counts, and if more than 50% of those come from <1% of pixels, then it is considered to be noise-dominated and hence unusable.
| Quadrant | # 1 sec bins | Bins with >0 counts | Bins with >2000 counts | High rate bins dominated by noise | Noise dominated (total time) | Noise dominated (detector-on time) | Marked lightcurve |
|---|---|---|---|---|---|---|---|
| A | 81455 | 69786 | 0 | 0 | 0.00% | 0.00% |  |
| B | 81455 | 69772 | 0 | 0 | 0.00% | 0.00% | 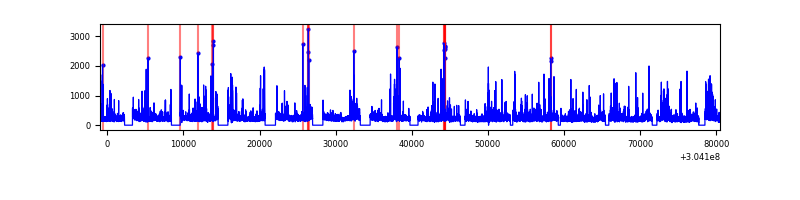 |
| C | 81455 | 69785 | 0 | 0 | 0.00% | 0.00% |  |
| D | 81455 | 69457 | 0 | 0 | 0.00% | 0.00% |  |
Top three noisy pixels from each quadrant. If the there are fewer than three noisy pixels in the level2.evt file, extra rows are filled as -1
| Pixel properties | Quadrant properties | ||||||
|---|---|---|---|---|---|---|---|
| Quadrant | DetID | PixID | Counts | Sigma | Mean | Median | Sigma |
| A | 0 | 29 | 4065 | 11.57 | 1082 | 1017 | 263.4 |
| A | 7 | 110 | 3495 | 9.41 | 1082 | 1017 | 263.4 |
| A | 0 | 30 | 3210 | 8.33 | 1082 | 1017 | 263.4 |
| B | 2 | 9 | 3270 | 11.01 | 1058 | 1014 | 204.8 |
| B | 2 | 8 | 2817 | 8.8 | 1058 | 1014 | 204.8 |
| B | 5 | 128 | 2632 | 7.9 | 1058 | 1014 | 204.8 |
| C | 3 | 234 | 2911 | 6.87 | 1076 | 1009 | 276.7 |
| C | 2 | 191 | 2799 | 6.47 | 1076 | 1009 | 276.7 |
| C | 3 | 126 | 2794 | 6.45 | 1076 | 1009 | 276.7 |
| D | 3 | 14 | 2387 | 6.58 | 894 | 814 | 238.9 |
| D | 6 | 231 | 2213 | 5.86 | 894 | 814 | 238.9 |
| D | 7 | 3 | 2186 | 5.74 | 894 | 814 | 238.9 |
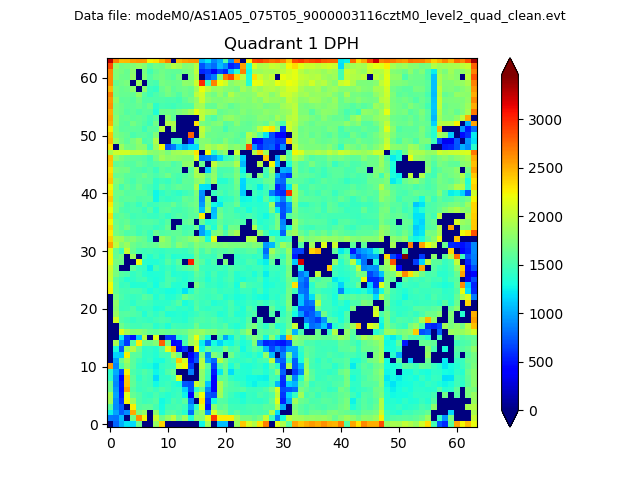
Histogram calculated using DETX and DETY for each event in the final _common_clean file
| Quadrant A |  |
 |
Quadrant B |
|---|---|---|---|
| Quadrant D |  |
 |
Quadrant C |
| Plot type | Count rate plots | Images |
|---|---|---|
| Comparison with Poisson distribution Blue bars denote a histogram of data divided into 1 sec bins. Red curve is a Poisson curve with rate = median count rate of data. |
 |
 |
| Quadrant-wise count rates Data is divided into 100 sec bins |
 |
|
| Module-wise count rates for Quadrant A Data is divided into 100 sec bins |
 |
 |
| Module-wise count rates for Quadrant B Data is divided into 100 sec bins |
 |
 |
| Module-wise count rates for Quadrant C Data is divided into 100 sec bins |
 |
 |
| Module-wise count rates for Quadrant D Data is divided into 100 sec bins |
 |
 |
| Parameter | Plot |
|---|---|
| CZT HV Monitor |  |
| D_VDD | 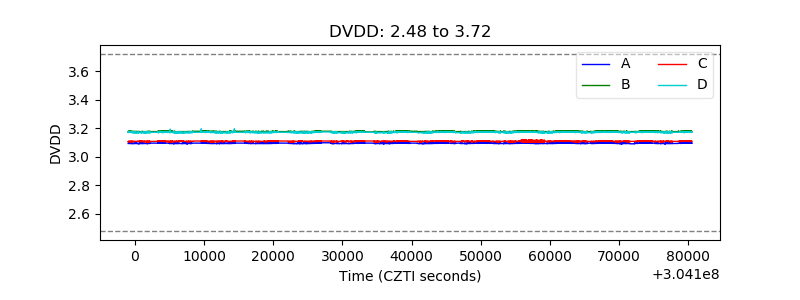 |
| Temperature 1 |  |
| Veto HV Monitor |  |
| Veto LLD |  |
| Alpha Counter |  |
| _CPM_Rate |  |
| CZT Counter |  |
| +2.5 Volts monitor |  |
| +5 Volts monitor |  |
| _ROLL_ROT | 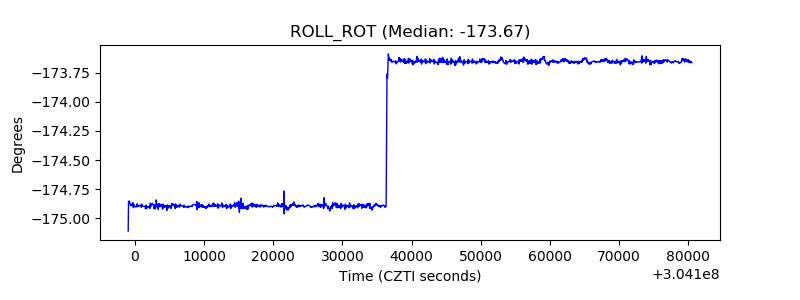 |
| _Roll_DEC |  |
| _Roll_RA |  |
| Veto Counter |  |