| Param | Original file | Final file |
|---|---|---|
| Filename | modeM0/AS1A05_075T05_9000003116_21070cztM0_level2.evt | modeM0/AS1A05_075T05_9000003116_21070cztM0_level2_quad_clean.evt |
| Size (bytes) | 557,876,160 | 50,135,040 |
| Size | 532.0 MB | 47.8 MB |
| Events in quadrant A | 2,163,337 | 351,377 |
| Events in quadrant B | 2,339,998 | 357,282 |
| Events in quadrant C | 2,123,472 | 341,751 |
| Events in quadrant D | 9,963,307 | 150,566 |
| Mode SS | |||
|---|---|---|---|
| Quadrant | BADHDUFLAG | Total packets | Discarded packets |
| A | 0 | 90 | 0 |
| B | 0 | 90 | 0 |
| C | 0 | 90 | 0 |
| D | 0 | 90 | 0 |
| Mode M0 | |||
|---|---|---|---|
| Quadrant | BADHDUFLAG | Total packets | Discarded packets |
| A | 0 | 9483 | 1 |
| B | 0 | 9838 | 1 |
| C | 0 | 9229 | 1 |
| D | 0 | 32576 | 3 |
| Mode M9 | |||
|---|---|---|---|
| Quadrant | BADHDUFLAG | Total packets | Discarded packets |
| A | 0 | 11 | 0 |
| B | 0 | 11 | 0 |
| C | 0 | 11 | 0 |
| D | 0 | 11 | 0 |
| Quadrant | Total seconds | Saturated seconds | Saturation percentage |
|---|---|---|---|
| A | 4500 | 32 | 0.711111% |
| B | 4500 | 33 | 0.733333% |
| C | 4500 | 36 | 0.800000% |
| D | 4499 | 3375 | 75.016670% |
Noise dominated data is calculated using 1-second bins in cleaned event files. If a bin has >2000 counts, and if more than 50% of those come from <1% of pixels, then it is considered to be noise-dominated and hence unusable.
| Quadrant | # 1 sec bins | Bins with >0 counts | Bins with >2000 counts | High rate bins dominated by noise | Noise dominated (total time) | Noise dominated (detector-on time) | Marked lightcurve |
|---|---|---|---|---|---|---|---|
| A | 5550 | 4501 | 3 | 3 | 0.05% | 0.07% | 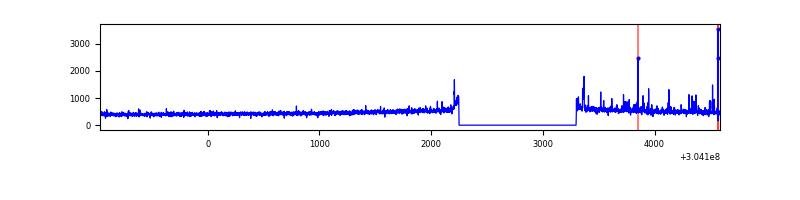 |
| B | 5550 | 4501 | 5 | 5 | 0.09% | 0.11% |  |
| C | 5550 | 4501 | 0 | 0 | 0.00% | 0.00% | 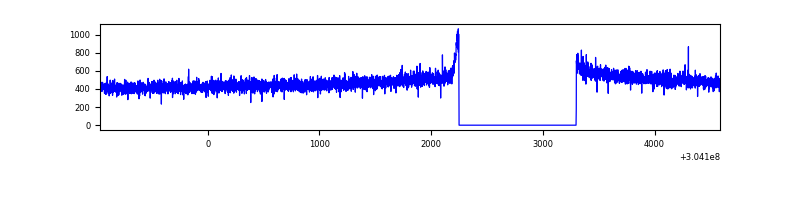 |
| D | 5548 | 4498 | 3162 | 3162 | 56.99% | 70.30% | 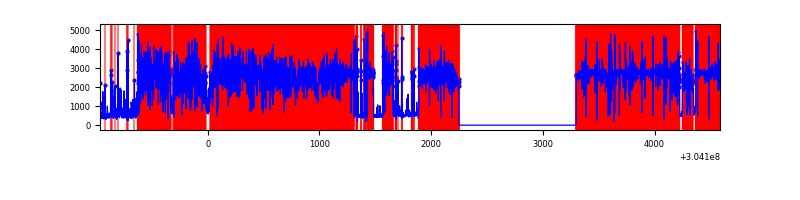 |
Top three noisy pixels from each quadrant. If the there are fewer than three noisy pixels in the level2.evt file, extra rows are filled as -1
| Pixel properties | Quadrant properties | ||||||
|---|---|---|---|---|---|---|---|
| Quadrant | DetID | PixID | Counts | Sigma | Mean | Median | Sigma |
| A | 12 | 96 | 78946 | 706.21 | 540 | 528 | 111.0 |
| A | 13 | 254 | 6776 | 56.27 | 540 | 528 | 111.0 |
| A | 0 | 226 | 4760 | 38.11 | 540 | 528 | 111.0 |
| B | 0 | 219 | 87443 | 843.57 | 541 | 527 | 103.0 |
| B | 3 | 64 | 46619 | 447.35 | 541 | 527 | 103.0 |
| B | 7 | 220 | 24673 | 234.35 | 541 | 527 | 103.0 |
| C | 14 | 238 | 80710 | 645.83 | 524 | 526 | 124.2 |
| C | 13 | 61 | 3594 | 24.71 | 524 | 526 | 124.2 |
| C | 14 | 111 | 1328 | 6.46 | 524 | 526 | 124.2 |
| D | 1 | 239 | 8490193 | 119466.16 | 286 | 279 | 71.1 |
| D | 13 | 153 | 126745 | 1779.57 | 286 | 279 | 71.1 |
| D | 1 | 52 | 84580 | 1186.24 | 286 | 279 | 71.1 |
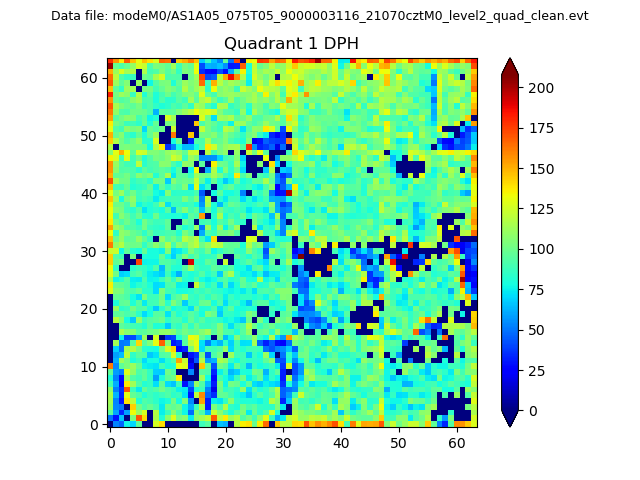
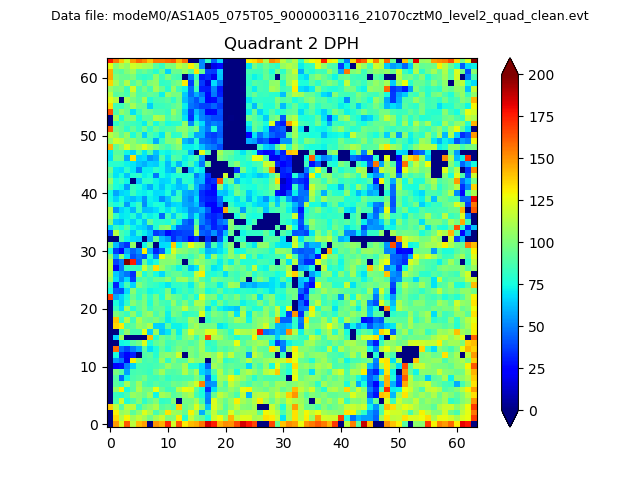
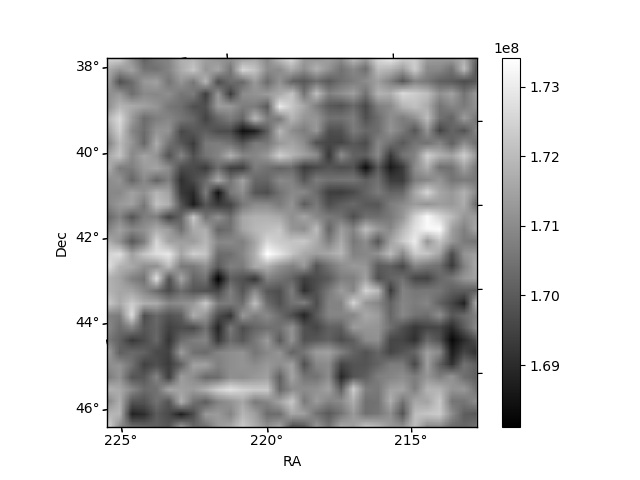
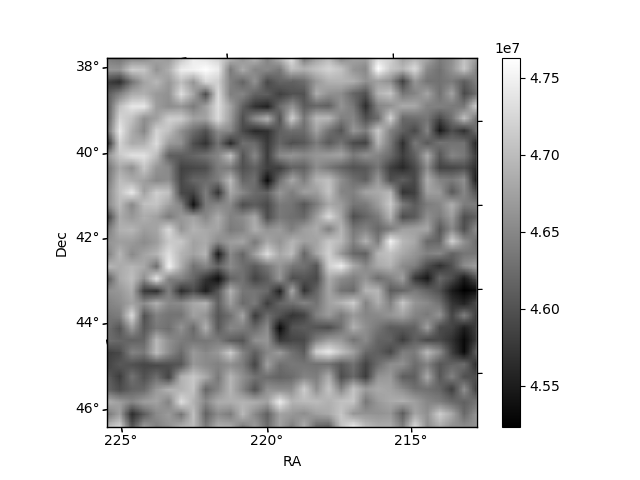
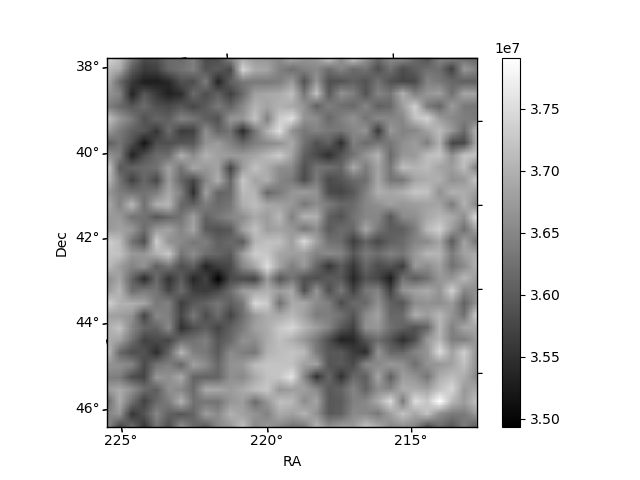
Histogram calculated using DETX and DETY for each event in the final _common_clean file
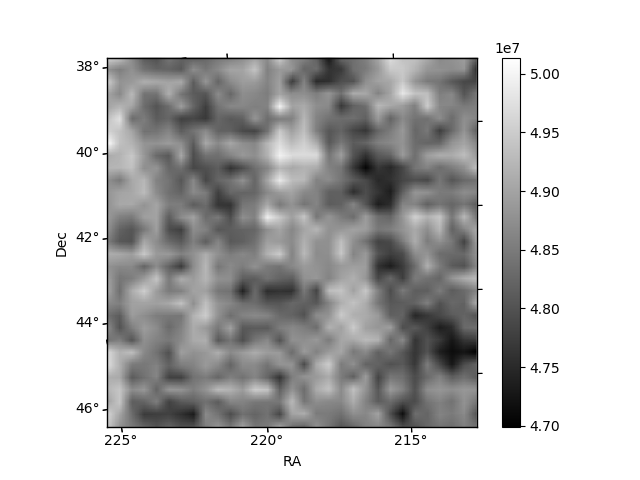
| Quadrant A | 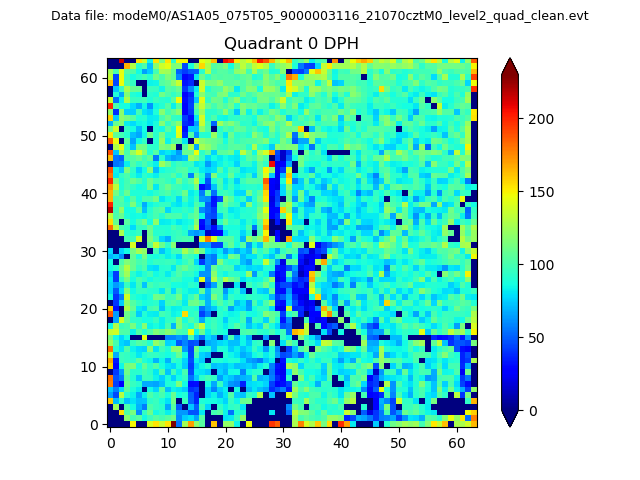 |
 |
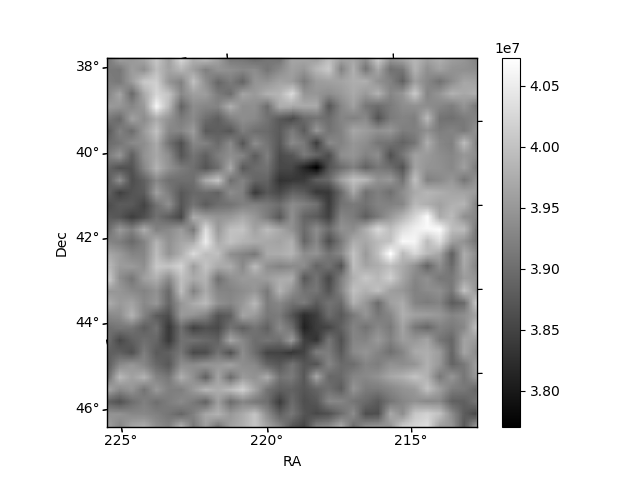
Quadrant B |
|---|---|---|---|
| Quadrant D | 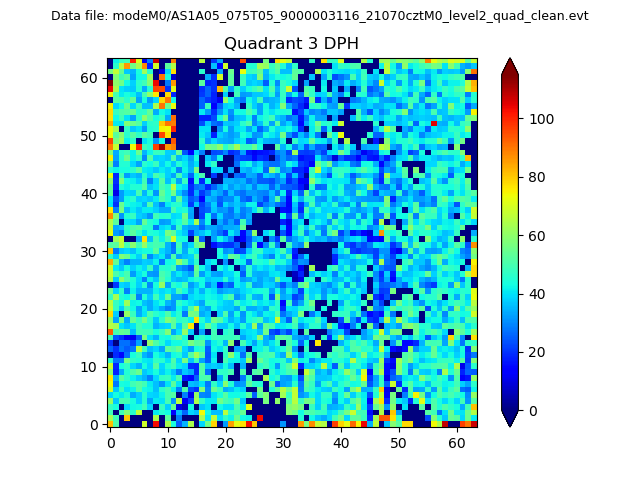 |
 |
Quadrant C |
| Plot type | Count rate plots | Images |
|---|---|---|
| Comparison with Poisson distribution Blue bars denote a histogram of data divided into 1 sec bins. Red curve is a Poisson curve with rate = median count rate of data. |
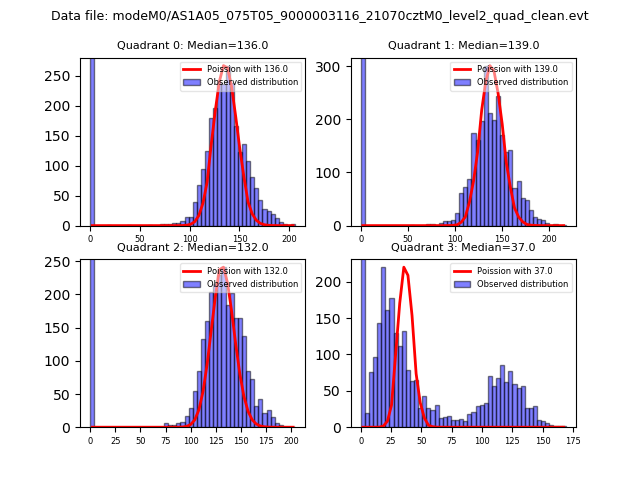 |
 |
| Quadrant-wise count rates Data is divided into 100 sec bins |
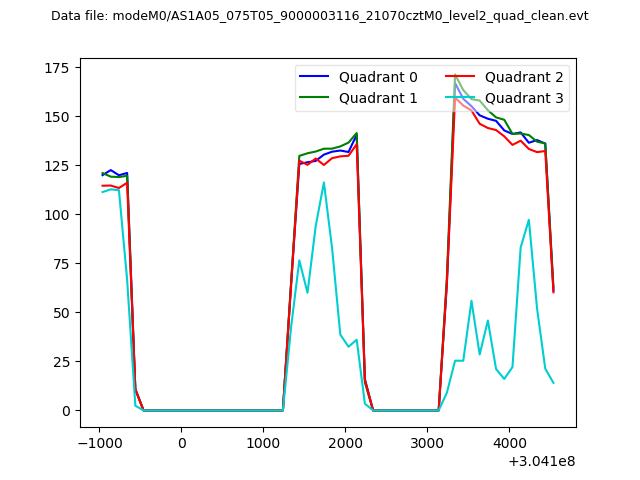 |
|
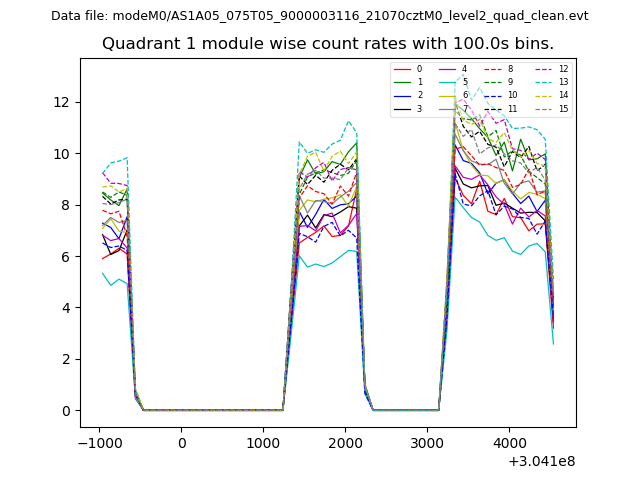
| Module-wise count rates for Quadrant A Data is divided into 100 sec bins |
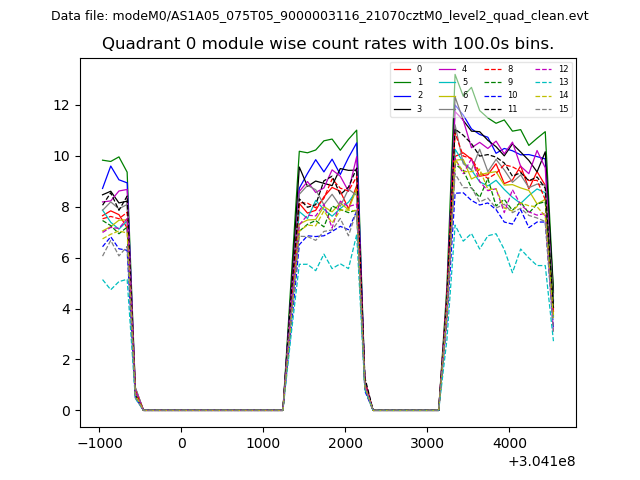 |
 |
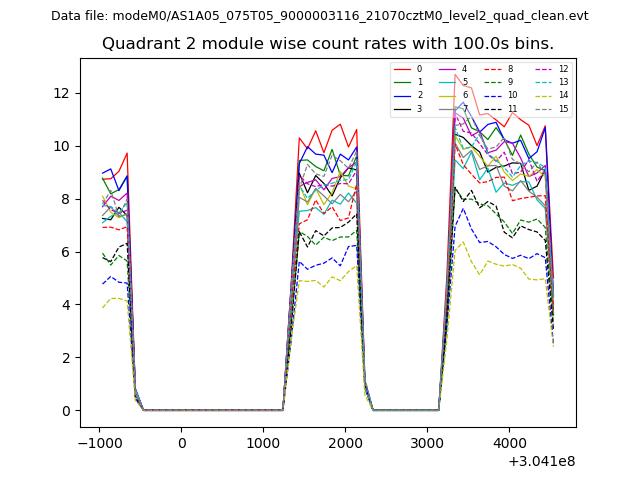
| Module-wise count rates for Quadrant B Data is divided into 100 sec bins |
 |
 |
| Module-wise count rates for Quadrant C Data is divided into 100 sec bins |
 |
 |
| Module-wise count rates for Quadrant D Data is divided into 100 sec bins |
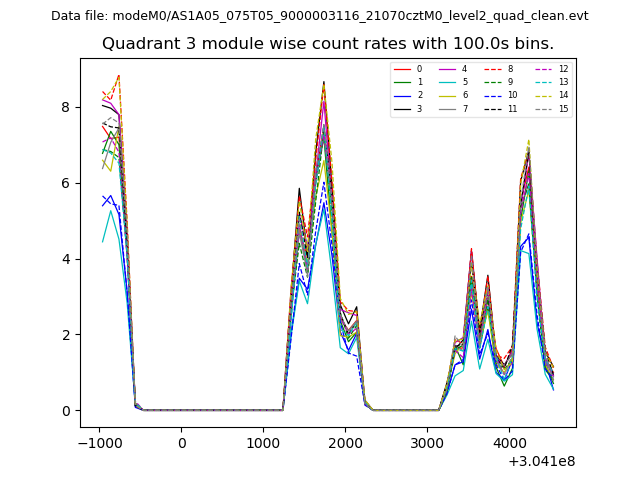 |
 |
| Parameter | Plot |
|---|---|
| CZT HV Monitor | 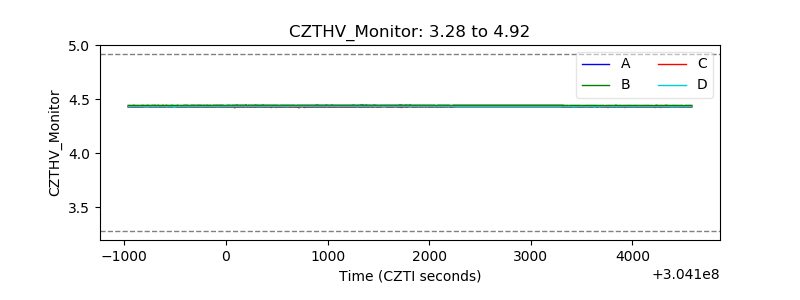 |
| D_VDD | 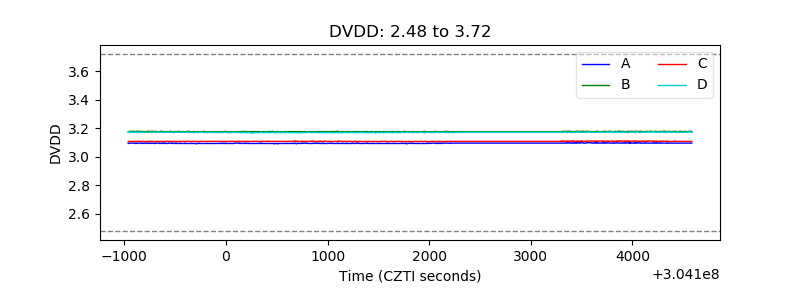 |
| Temperature 1 |  |
| Veto HV Monitor | 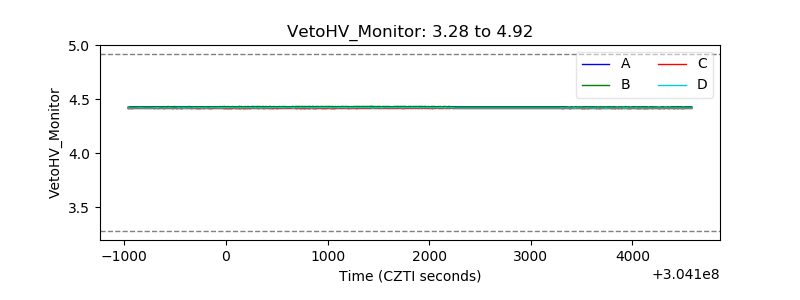 |
| Veto LLD | 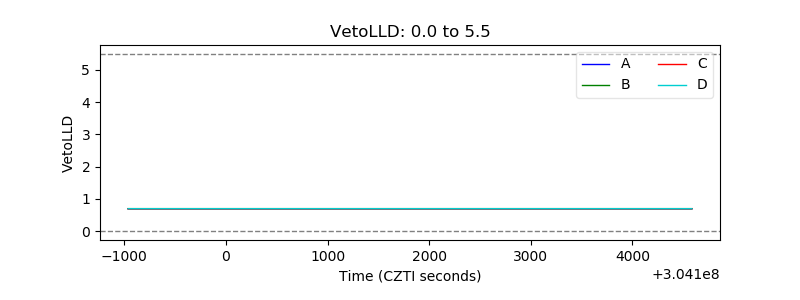 |
| Alpha Counter | 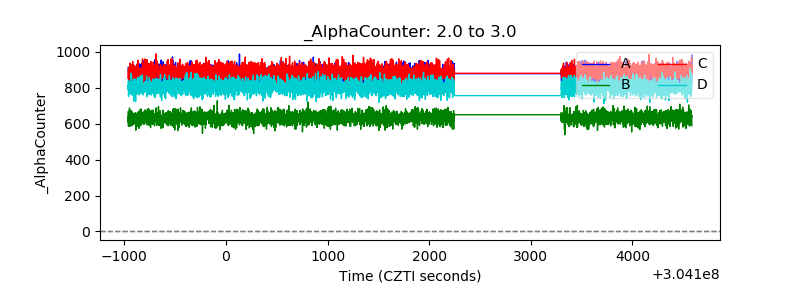 |
| _CPM_Rate | 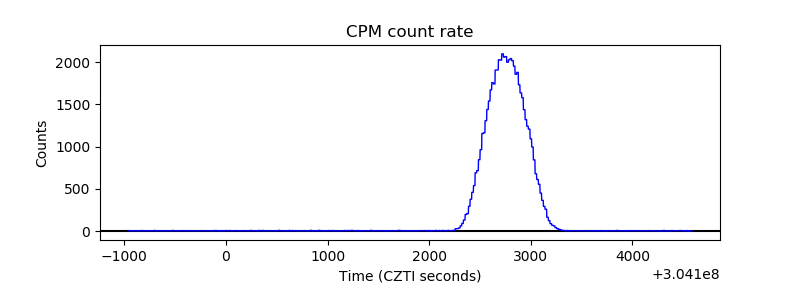 |
| CZT Counter | 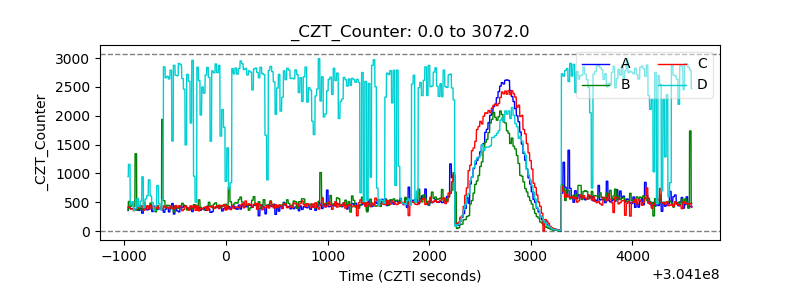 |
| +2.5 Volts monitor |  |
| +5 Volts monitor |  |
| _ROLL_ROT | 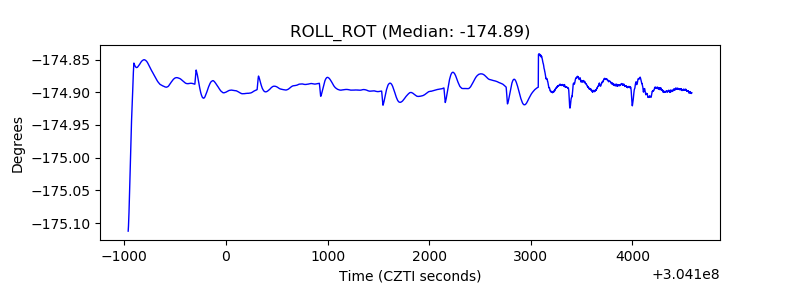 |
| _Roll_DEC | 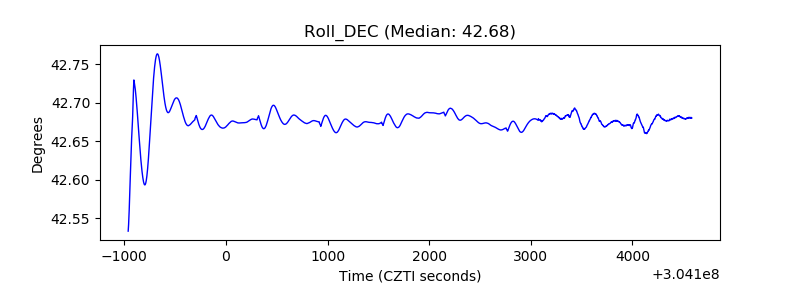 |
| _Roll_RA | 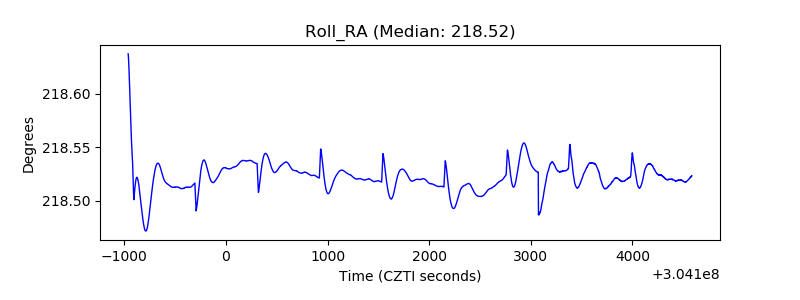 |
| Veto Counter | 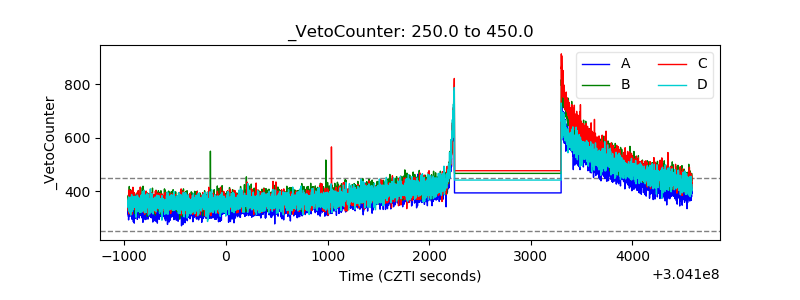 |