| Param | Original file | Final file |
|---|---|---|
| Filename | modeM0/AS1A05_075T05_9000003116_21072cztM0_level2.evt | modeM0/AS1A05_075T05_9000003116_21072cztM0_level2_quad_clean.evt |
| Size (bytes) | 793,212,480 | 84,162,240 |
| Size | 756.5 MB | 80.3 MB |
| Events in quadrant A | 3,055,952 | 613,714 |
| Events in quadrant B | 3,263,925 | 627,898 |
| Events in quadrant C | 3,033,440 | 598,988 |
| Events in quadrant D | 14,243,642 | 267,627 |
| Mode SS | |||
|---|---|---|---|
| Quadrant | BADHDUFLAG | Total packets | Discarded packets |
| A | 0 | 130 | 0 |
| B | 0 | 130 | 0 |
| C | 0 | 130 | 0 |
| D | 0 | 130 | 0 |
| Mode M0 | |||
|---|---|---|---|
| Quadrant | BADHDUFLAG | Total packets | Discarded packets |
| A | 0 | 13168 | 1 |
| B | 0 | 13639 | 1 |
| C | 0 | 13008 | 1 |
| D | 0 | 46496 | 1 |
| Mode M9 | |||
|---|---|---|---|
| Quadrant | BADHDUFLAG | Total packets | Discarded packets |
| A | 0 | 11 | 0 |
| B | 0 | 11 | 0 |
| C | 0 | 11 | 0 |
| D | 0 | 11 | 0 |
| Quadrant | Total seconds | Saturated seconds | Saturation percentage |
|---|---|---|---|
| A | 6279 | 38 | 0.605192% |
| B | 6280 | 60 | 0.955414% |
| C | 6280 | 63 | 1.003185% |
| D | 6279 | 4739 | 75.473802% |
Noise dominated data is calculated using 1-second bins in cleaned event files. If a bin has >2000 counts, and if more than 50% of those come from <1% of pixels, then it is considered to be noise-dominated and hence unusable.
| Quadrant | # 1 sec bins | Bins with >0 counts | Bins with >2000 counts | High rate bins dominated by noise | Noise dominated (total time) | Noise dominated (detector-on time) | Marked lightcurve |
|---|---|---|---|---|---|---|---|
| A | 7444 | 6280 | 3 | 3 | 0.04% | 0.05% | 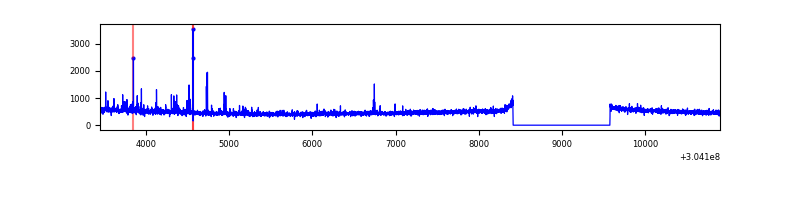 |
| B | 7445 | 6281 | 7 | 7 | 0.09% | 0.11% | 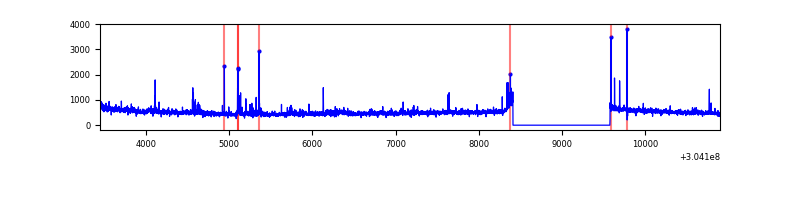 |
| C | 7445 | 6281 | 0 | 0 | 0.00% | 0.00% | 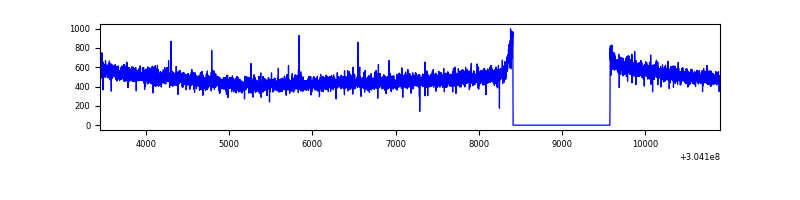 |
| D | 7444 | 6279 | 4487 | 4487 | 60.28% | 71.46% | 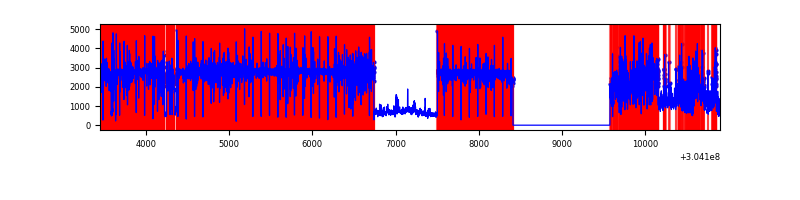 |
Top three noisy pixels from each quadrant. If the there are fewer than three noisy pixels in the level2.evt file, extra rows are filled as -1
| Pixel properties | Quadrant properties | ||||||
|---|---|---|---|---|---|---|---|
| Quadrant | DetID | PixID | Counts | Sigma | Mean | Median | Sigma |
| A | 12 | 96 | 94061 | 605.7 | 767 | 751 | 154.1 |
| A | 13 | 254 | 9467 | 56.58 | 767 | 751 | 154.1 |
| A | 0 | 226 | 6767 | 39.05 | 767 | 751 | 154.1 |
| B | 0 | 219 | 81267 | 553.12 | 772 | 752 | 145.6 |
| B | 3 | 64 | 41825 | 282.16 | 772 | 752 | 145.6 |
| B | 0 | 244 | 32643 | 219.09 | 772 | 752 | 145.6 |
| C | 14 | 238 | 117917 | 670.35 | 747 | 753 | 174.8 |
| C | 13 | 61 | 5191 | 25.39 | 747 | 753 | 174.8 |
| C | 10 | 91 | 3007 | 12.9 | 747 | 753 | 174.8 |
| D | 1 | 239 | 12183846 | 132684.03 | 384 | 373 | 91.8 |
| D | 2 | 14 | 276203 | 3003.92 | 384 | 373 | 91.8 |
| D | 14 | 35 | 124965 | 1356.87 | 384 | 373 | 91.8 |
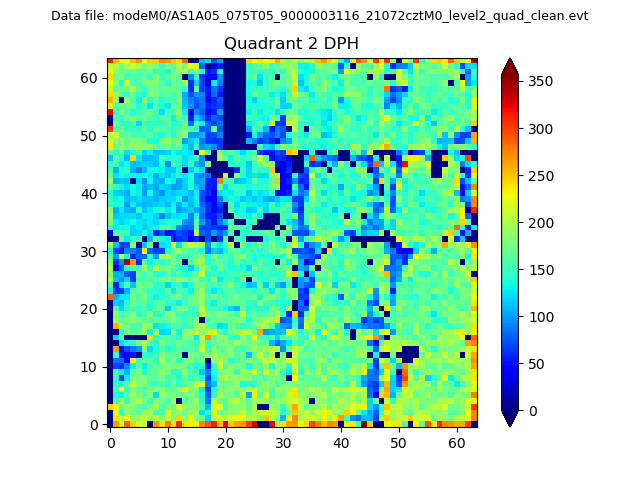
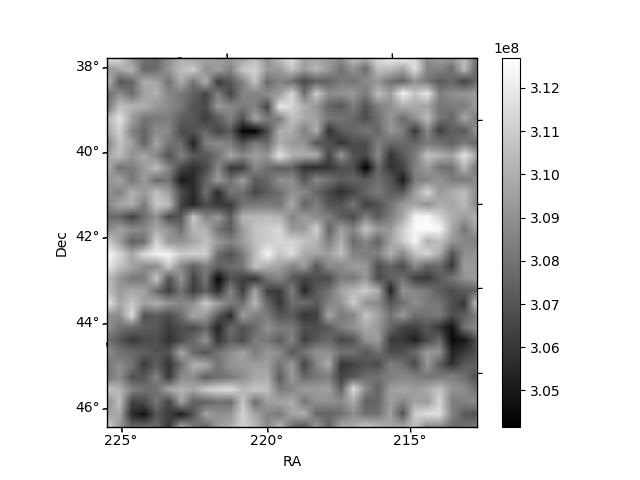
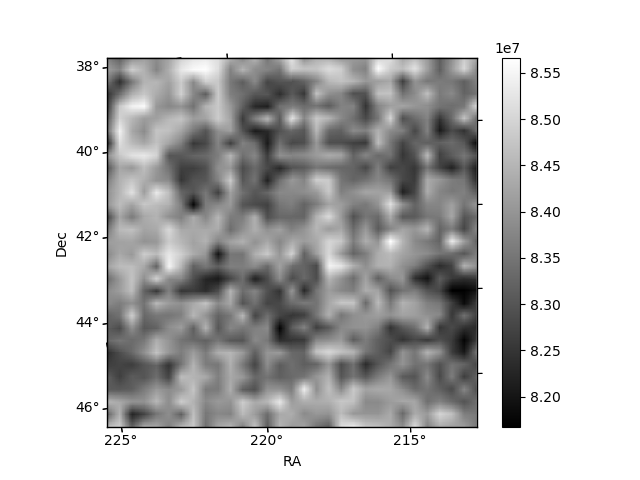
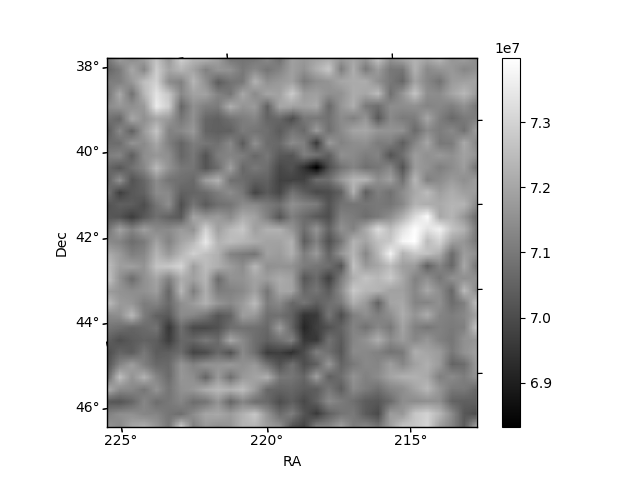
Histogram calculated using DETX and DETY for each event in the final _common_clean file
| Quadrant A | 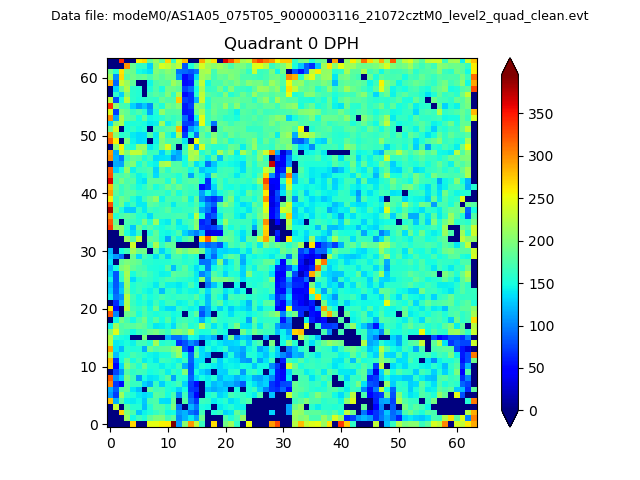 |
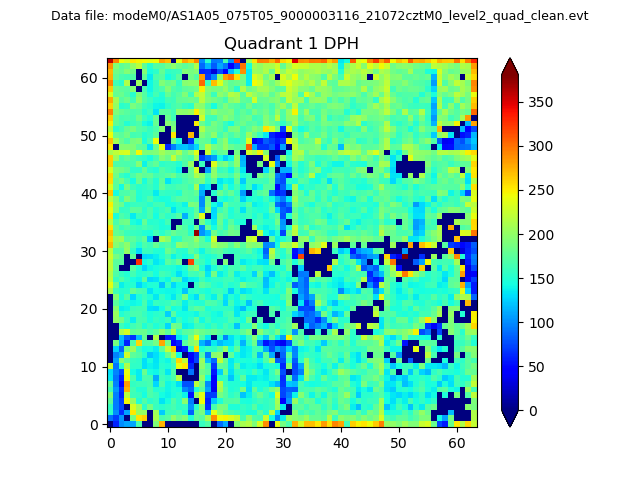 |
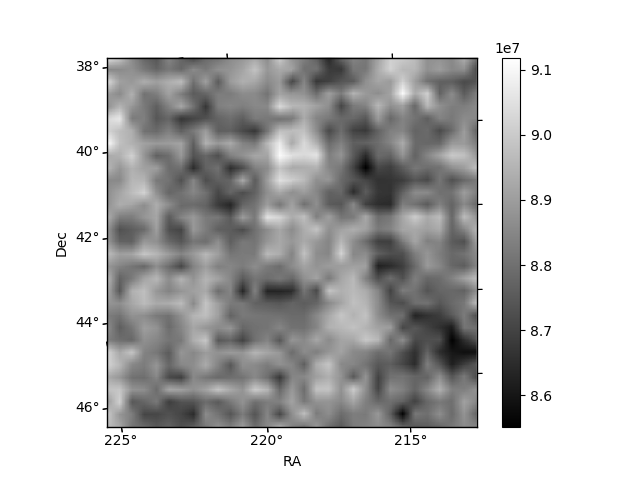
Quadrant B |
|---|---|---|---|
| Quadrant D | 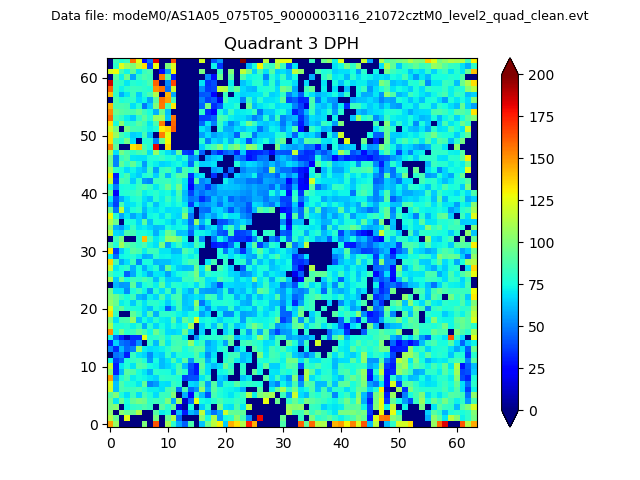 |
 |
Quadrant C |
| Plot type | Count rate plots | Images |
|---|---|---|
| Comparison with Poisson distribution Blue bars denote a histogram of data divided into 1 sec bins. Red curve is a Poisson curve with rate = median count rate of data. |
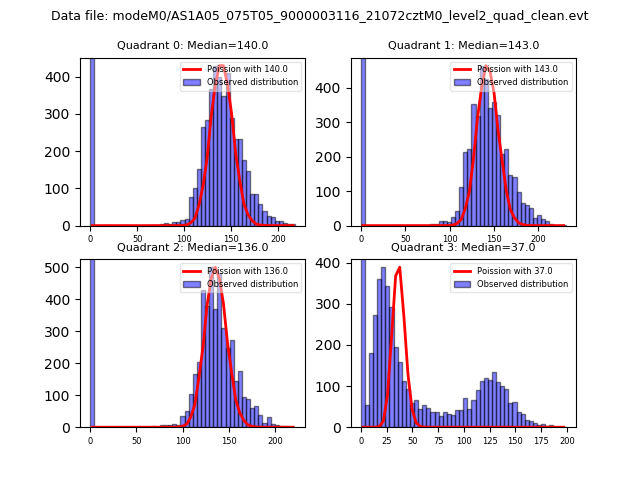 |
 |
| Quadrant-wise count rates Data is divided into 100 sec bins |
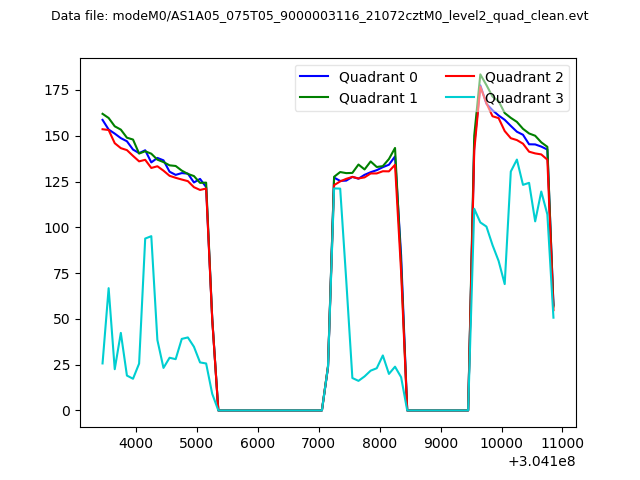 |
|
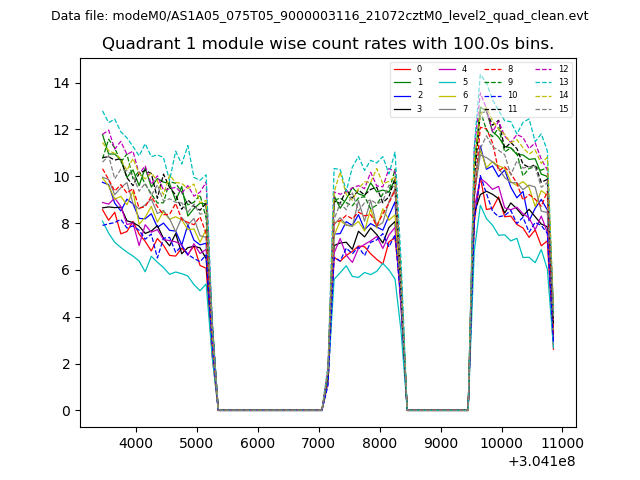
| Module-wise count rates for Quadrant A Data is divided into 100 sec bins |
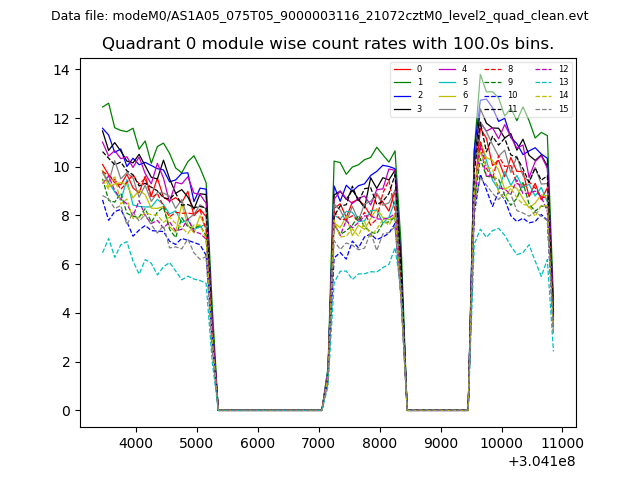 |
 |
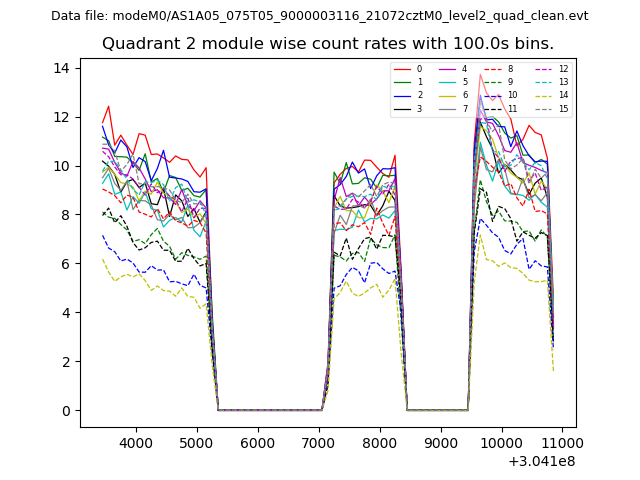
| Module-wise count rates for Quadrant B Data is divided into 100 sec bins |
 |
 |
| Module-wise count rates for Quadrant C Data is divided into 100 sec bins |
 |
 |
| Module-wise count rates for Quadrant D Data is divided into 100 sec bins |
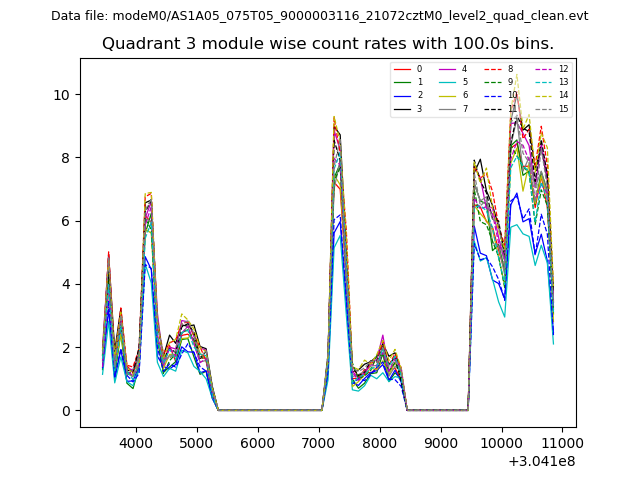 |
 |
| Parameter | Plot |
|---|---|
| CZT HV Monitor | 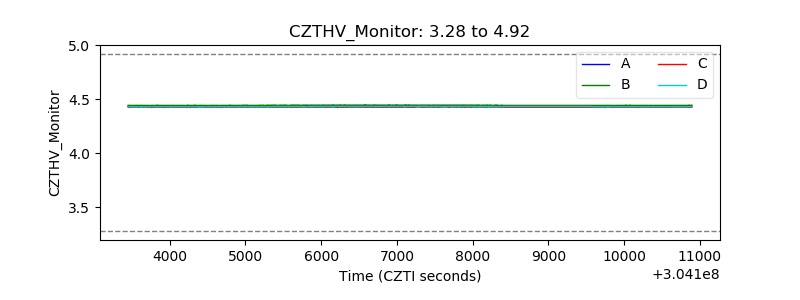 |
| D_VDD | 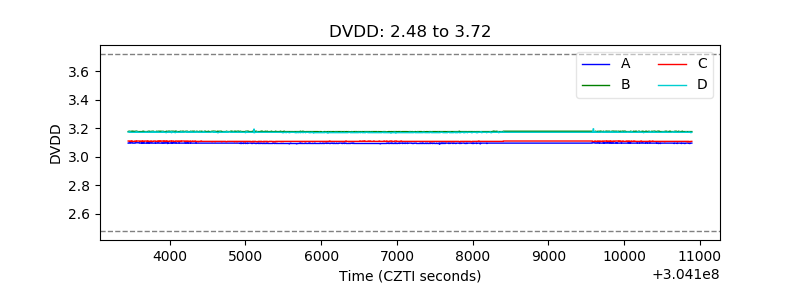 |
| Temperature 1 | 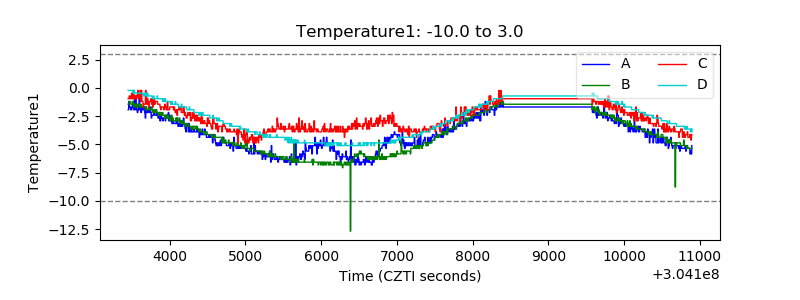 |
| Veto HV Monitor |  |
| Veto LLD | 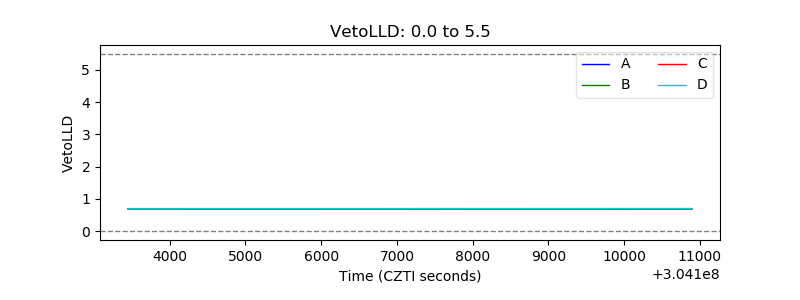 |
| Alpha Counter | 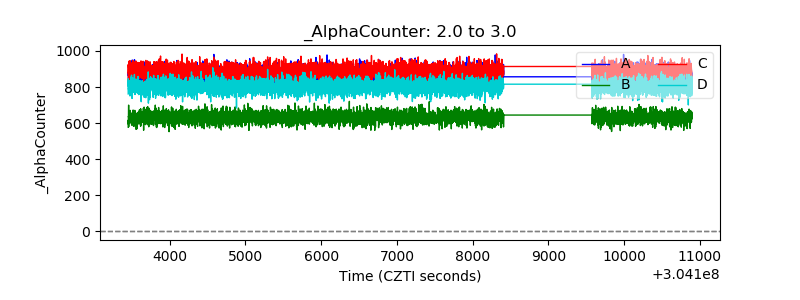 |
| _CPM_Rate | 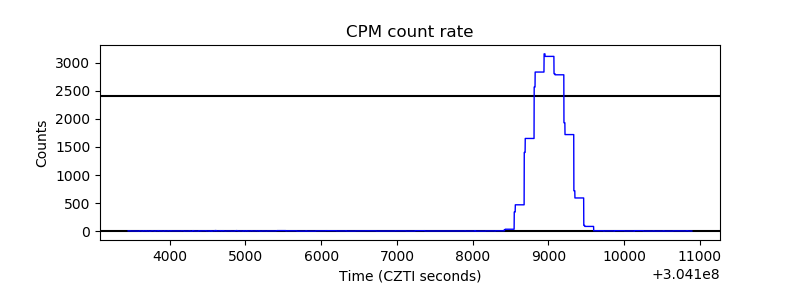 |
| CZT Counter | 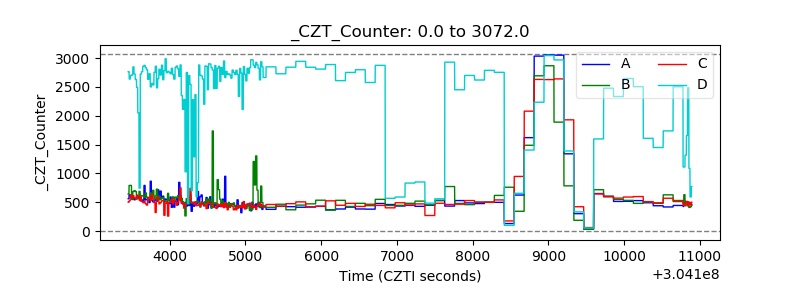 |
| +2.5 Volts monitor |  |
| +5 Volts monitor |  |
| _ROLL_ROT | 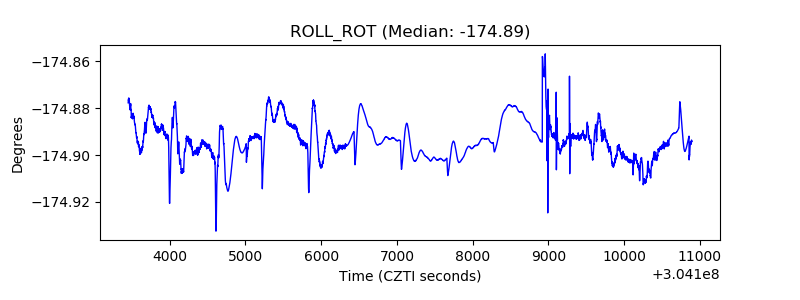 |
| _Roll_DEC | 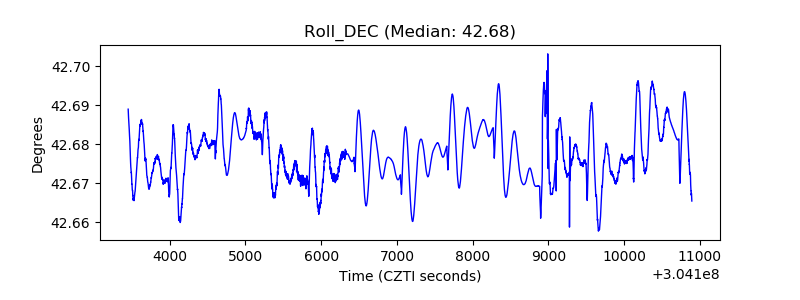 |
| _Roll_RA | 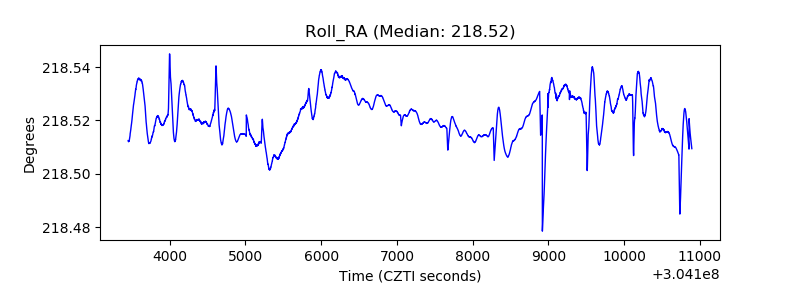 |
| Veto Counter | 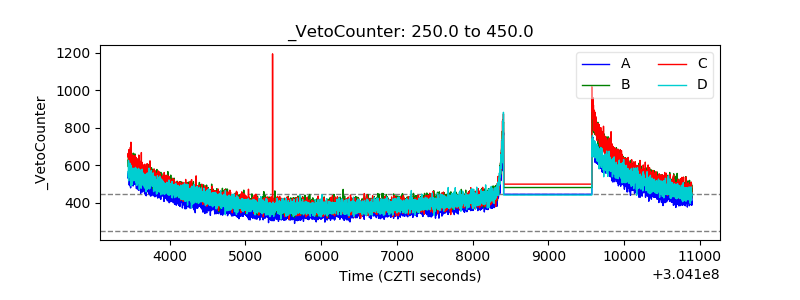 |