| Param | Original file | Final file |
|---|---|---|
| Filename | modeM0/AS1A05_075T05_9000003116_21074cztM0_level2.evt | modeM0/AS1A05_075T05_9000003116_21074cztM0_level2_quad_clean.evt |
| Size (bytes) | 462,072,960 | 87,906,240 |
| Size | 440.7 MB | 83.8 MB |
| Events in quadrant A | 3,084,711 | 567,547 |
| Events in quadrant B | 3,498,171 | 579,071 |
| Events in quadrant C | 3,144,309 | 553,449 |
| Events in quadrant D | 3,846,080 | 529,547 |
| Mode SS | |||
|---|---|---|---|
| Quadrant | BADHDUFLAG | Total packets | Discarded packets |
| A | 0 | 126 | 0 |
| B | 0 | 126 | 0 |
| C | 0 | 126 | 0 |
| D | 0 | 126 | 0 |
| Mode M0 | |||
|---|---|---|---|
| Quadrant | BADHDUFLAG | Total packets | Discarded packets |
| A | 0 | 13010 | 2 |
| B | 0 | 14179 | 2 |
| C | 0 | 13128 | 2 |
| D | 0 | 15547 | 2 |
| Mode M9 | |||
|---|---|---|---|
| Quadrant | BADHDUFLAG | Total packets | Discarded packets |
| A | 0 | 15 | 0 |
| B | 0 | 16 | 0 |
| C | 0 | 16 | 0 |
| D | 0 | 16 | 0 |
| Quadrant | Total seconds | Saturated seconds | Saturation percentage |
|---|---|---|---|
| A | 6195 | 22 | 0.355125% |
| B | 6195 | 135 | 2.179177% |
| C | 6195 | 46 | 0.742534% |
| D | 6195 | 85 | 1.372074% |
Noise dominated data is calculated using 1-second bins in cleaned event files. If a bin has >2000 counts, and if more than 50% of those come from <1% of pixels, then it is considered to be noise-dominated and hence unusable.
| Quadrant | # 1 sec bins | Bins with >0 counts | Bins with >2000 counts | High rate bins dominated by noise | Noise dominated (total time) | Noise dominated (detector-on time) | Marked lightcurve |
|---|---|---|---|---|---|---|---|
| A | 7560 | 6196 | 0 | 0 | 0.00% | 0.00% | 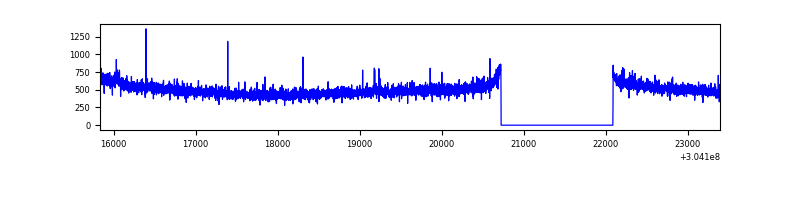 |
| B | 7560 | 6196 | 61 | 61 | 0.81% | 0.98% | 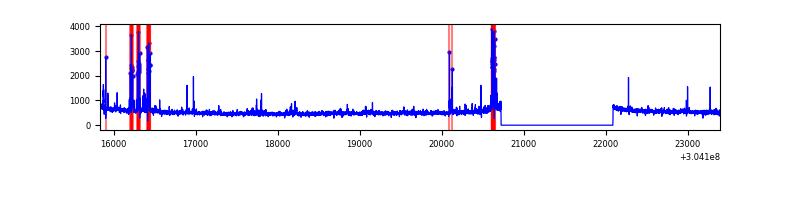 |
| C | 7560 | 6196 | 0 | 0 | 0.00% | 0.00% | 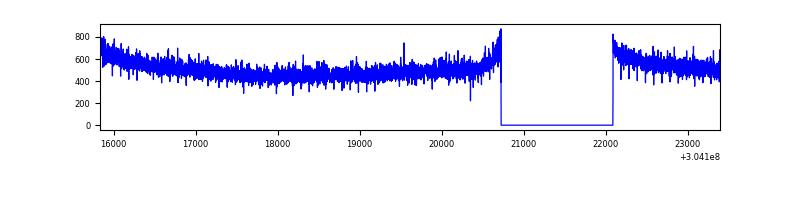 |
| D | 7560 | 6196 | 58 | 58 | 0.77% | 0.94% | 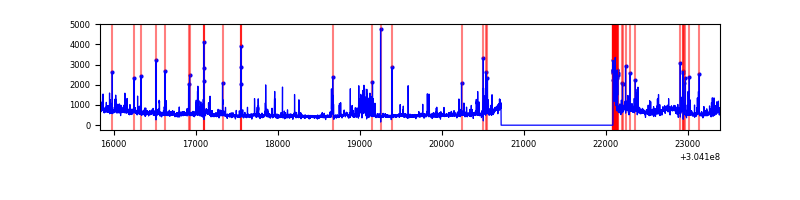 |
Top three noisy pixels from each quadrant. If the there are fewer than three noisy pixels in the level2.evt file, extra rows are filled as -1
| Pixel properties | Quadrant properties | ||||||
|---|---|---|---|---|---|---|---|
| Quadrant | DetID | PixID | Counts | Sigma | Mean | Median | Sigma |
| A | 13 | 254 | 10015 | 58.57 | 795 | 783 | 157.6 |
| A | 0 | 226 | 6901 | 38.81 | 795 | 783 | 157.6 |
| A | 3 | 137 | 6102 | 33.74 | 795 | 783 | 157.6 |
| B | 7 | 220 | 152401 | 1024.38 | 798 | 781 | 148.0 |
| B | 0 | 228 | 78942 | 528.08 | 798 | 781 | 148.0 |
| B | 0 | 219 | 69196 | 462.23 | 798 | 781 | 148.0 |
| C | 14 | 238 | 123649 | 682.89 | 774 | 782 | 179.9 |
| C | 13 | 61 | 5393 | 25.63 | 774 | 782 | 179.9 |
| C | 10 | 91 | 2865 | 11.58 | 774 | 782 | 179.9 |
| D | 1 | 52 | 319424 | 1702.96 | 770 | 749 | 187.1 |
| D | 13 | 153 | 133594 | 709.91 | 770 | 749 | 187.1 |
| D | 7 | 223 | 122549 | 650.88 | 770 | 749 | 187.1 |
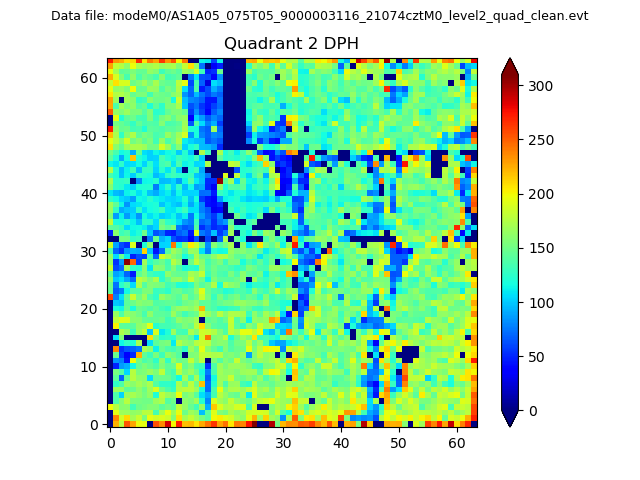
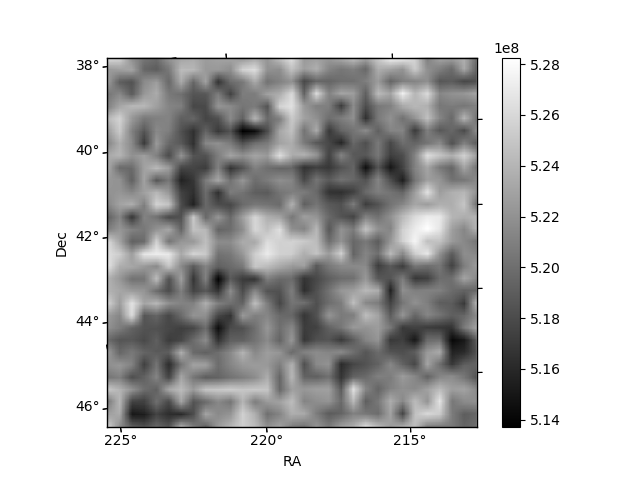
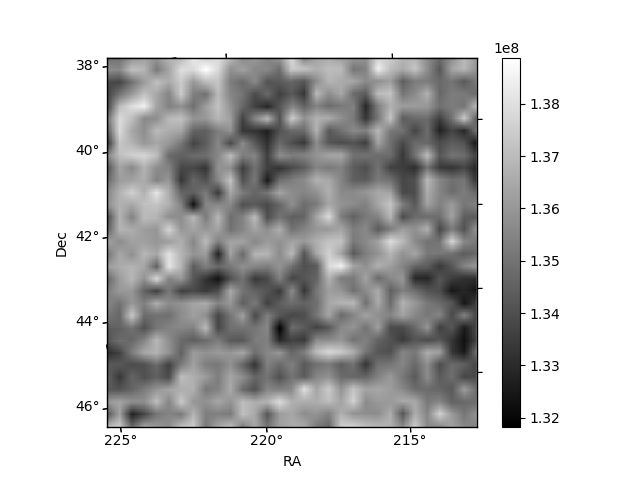
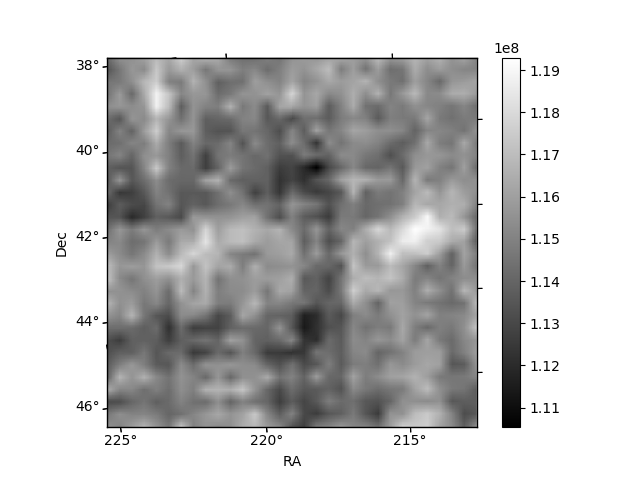
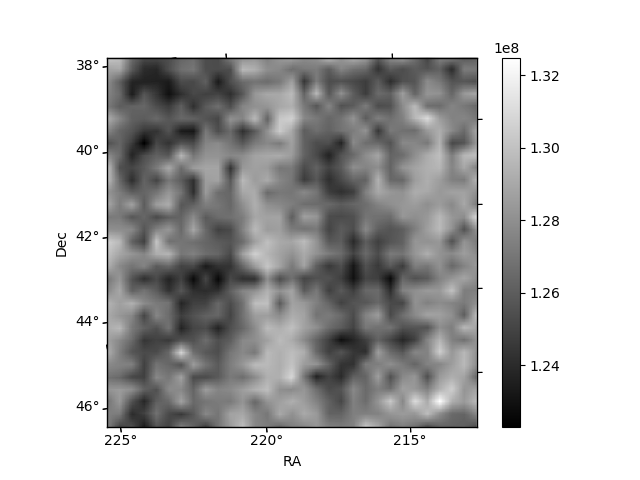
Histogram calculated using DETX and DETY for each event in the final _common_clean file
| Quadrant A | 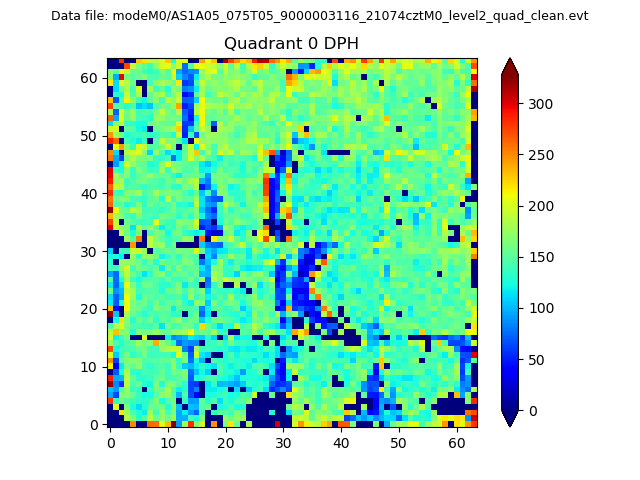 |
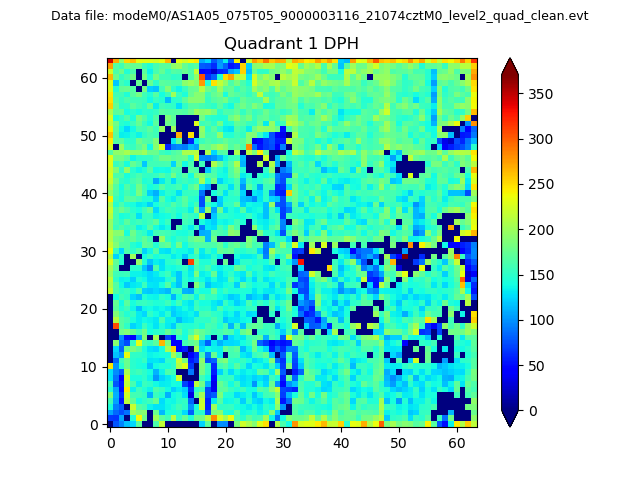 |
Quadrant B |
|---|---|---|---|
| Quadrant D | 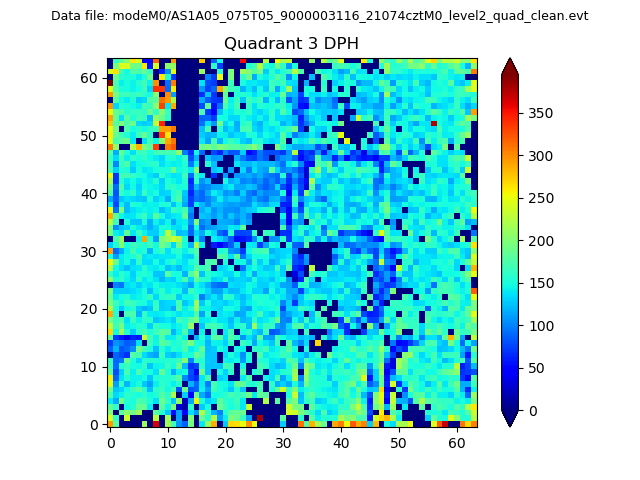 |
 |
Quadrant C |
| Plot type | Count rate plots | Images |
|---|---|---|
| Comparison with Poisson distribution Blue bars denote a histogram of data divided into 1 sec bins. Red curve is a Poisson curve with rate = median count rate of data. |
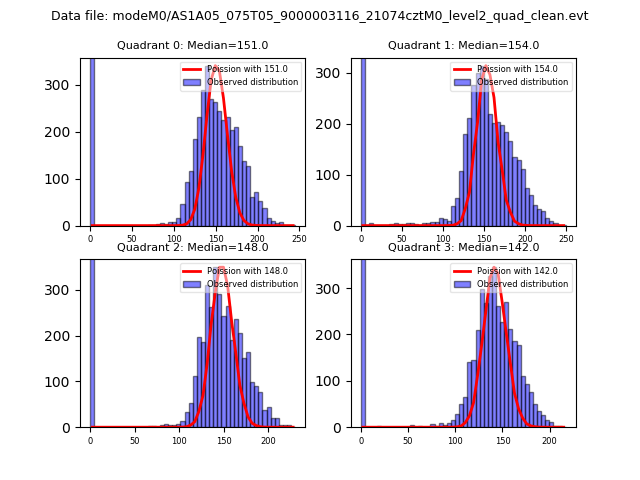 |
 |
| Quadrant-wise count rates Data is divided into 100 sec bins |
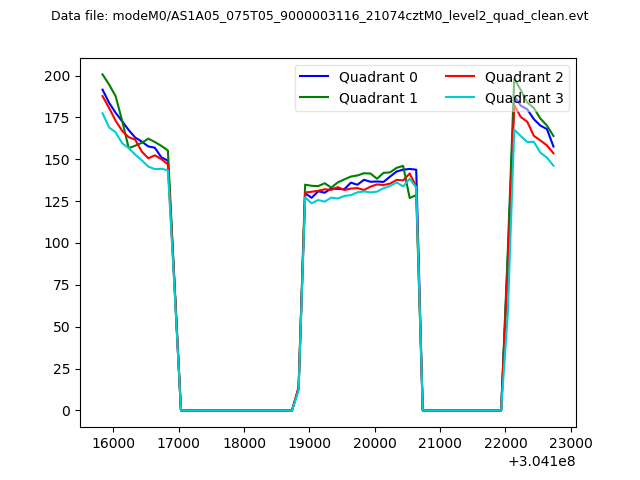 |
|
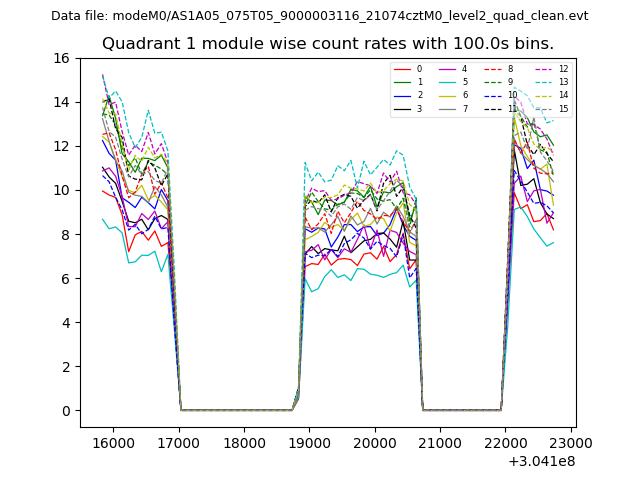
| Module-wise count rates for Quadrant A Data is divided into 100 sec bins |
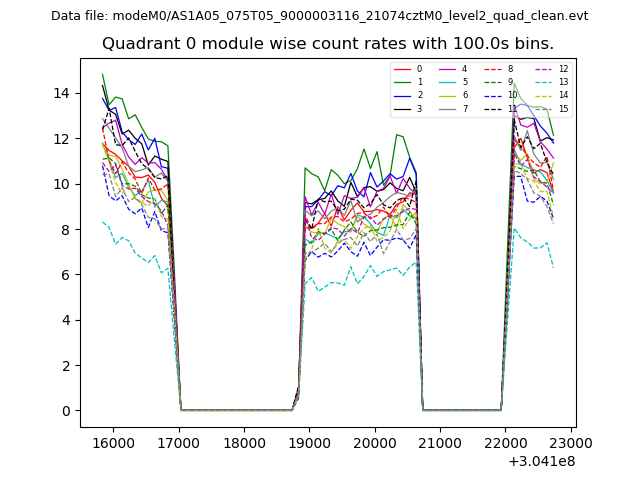 |
 |
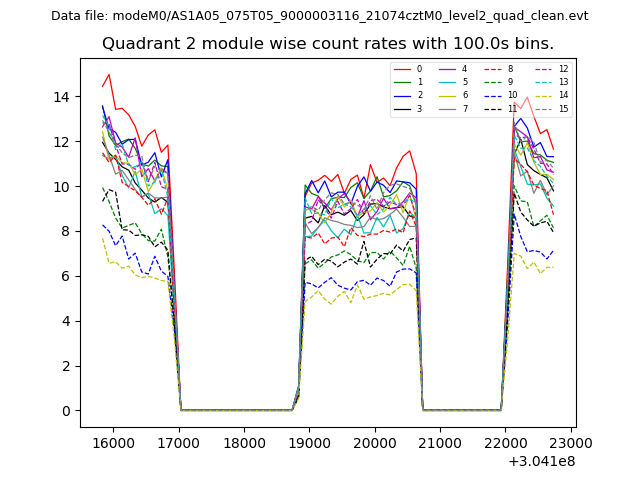
| Module-wise count rates for Quadrant B Data is divided into 100 sec bins |
 |
 |
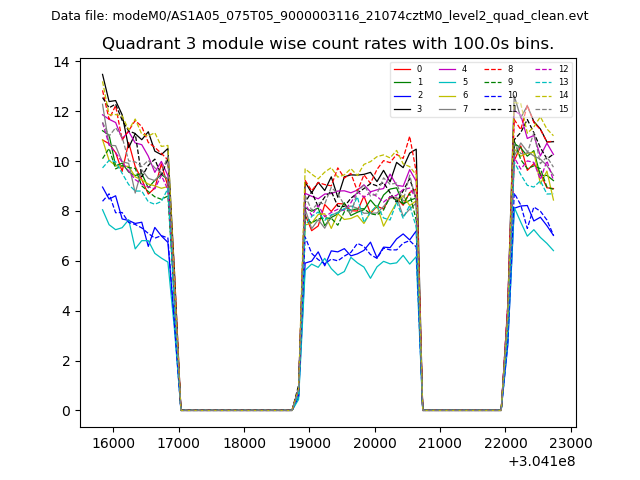
| Module-wise count rates for Quadrant C Data is divided into 100 sec bins |
 |
 |
| Module-wise count rates for Quadrant D Data is divided into 100 sec bins |
 |
 |
| Parameter | Plot |
|---|---|
| CZT HV Monitor | 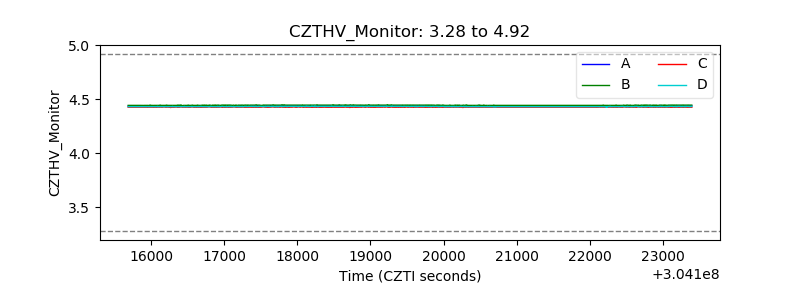 |
| D_VDD | 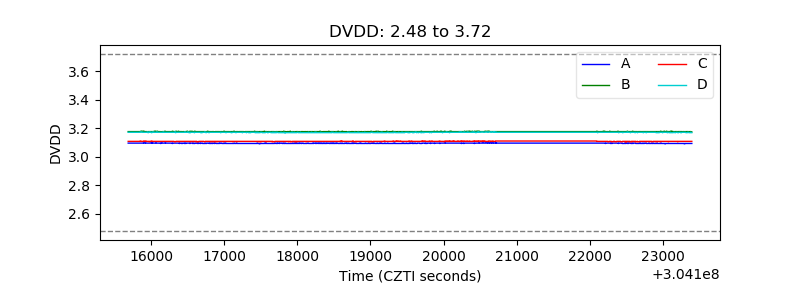 |
| Temperature 1 | 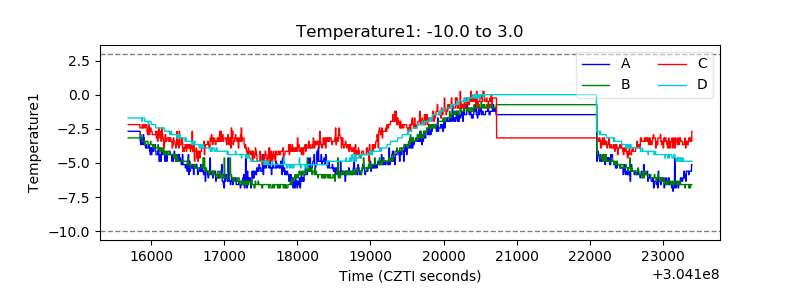 |
| Veto HV Monitor |  |
| Veto LLD | 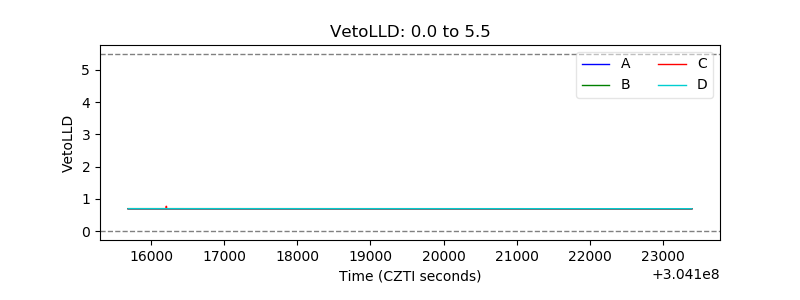 |
| Alpha Counter | 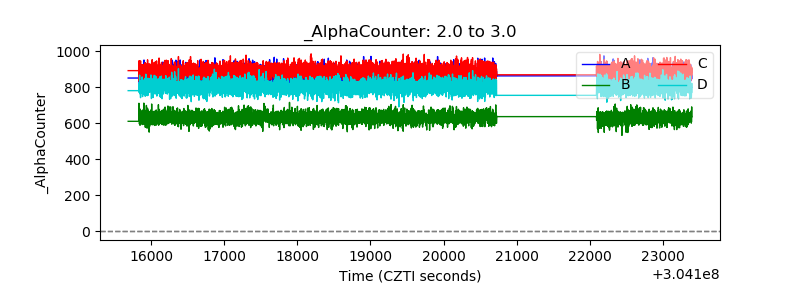 |
| _CPM_Rate | 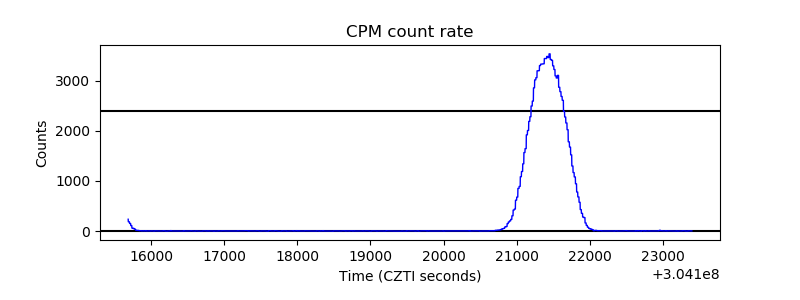 |
| CZT Counter | 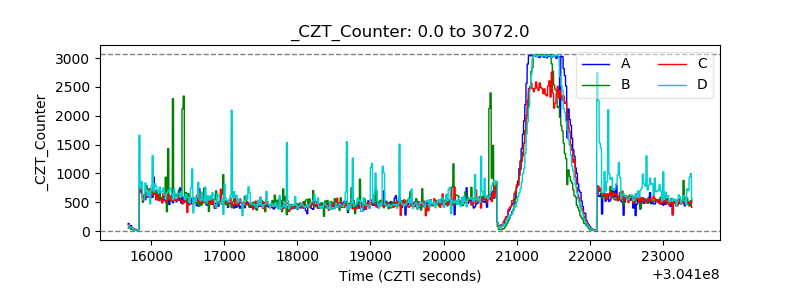 |
| +2.5 Volts monitor |  |
| +5 Volts monitor | 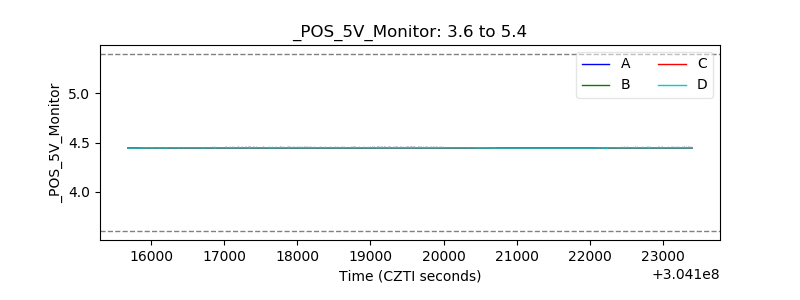 |
| _ROLL_ROT | 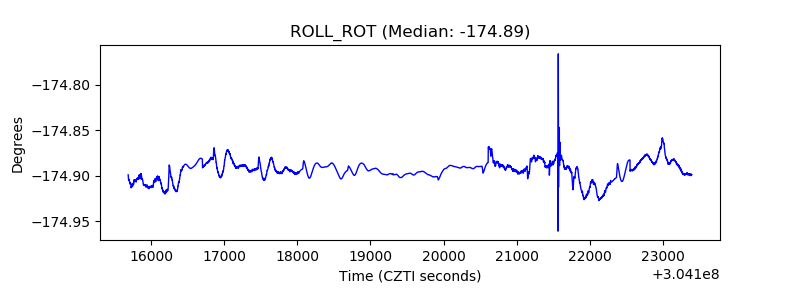 |
| _Roll_DEC | 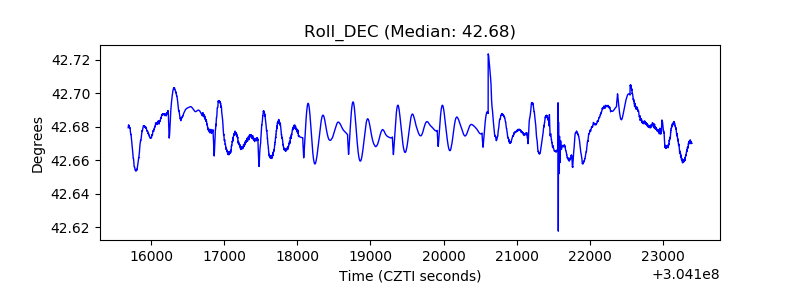 |
| _Roll_RA | 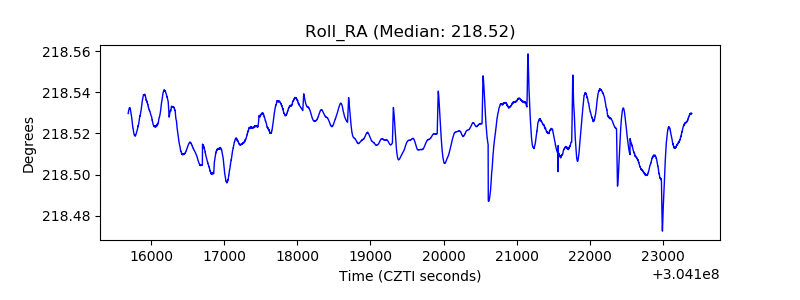 |
| Veto Counter | 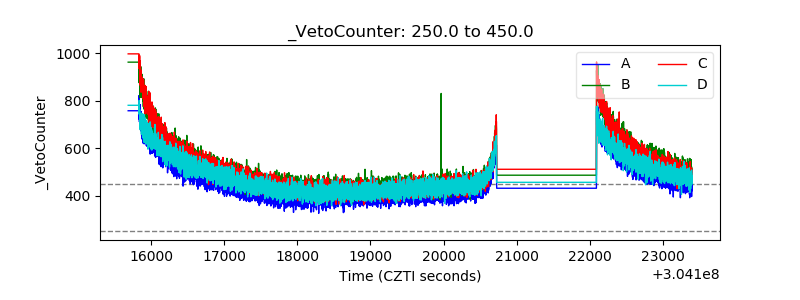 |