| Param | Original file | Final file |
|---|---|---|
| Filename | modeM0/AS1A05_075T05_9000003116_21075cztM0_level2.evt | modeM0/AS1A05_075T05_9000003116_21075cztM0_level2_quad_clean.evt |
| Size (bytes) | 484,902,720 | 79,511,040 |
| Size | 462.4 MB | 75.8 MB |
| Events in quadrant A | 3,226,603 | 501,601 |
| Events in quadrant B | 3,544,428 | 514,699 |
| Events in quadrant C | 3,269,487 | 484,632 |
| Events in quadrant D | 4,208,400 | 458,105 |
| Mode SS | |||
|---|---|---|---|
| Quadrant | BADHDUFLAG | Total packets | Discarded packets |
| A | 0 | 128 | 0 |
| B | 0 | 128 | 0 |
| C | 0 | 128 | 0 |
| D | 0 | 128 | 0 |
| Mode M0 | |||
|---|---|---|---|
| Quadrant | BADHDUFLAG | Total packets | Discarded packets |
| A | 0 | 13466 | 2 |
| B | 0 | 14369 | 2 |
| C | 0 | 13587 | 2 |
| D | 0 | 16673 | 2 |
| Mode M9 | |||
|---|---|---|---|
| Quadrant | BADHDUFLAG | Total packets | Discarded packets |
| A | 0 | 26 | 0 |
| B | 0 | 27 | 0 |
| C | 0 | 27 | 0 |
| D | 0 | 27 | 0 |
| Quadrant | Total seconds | Saturated seconds | Saturation percentage |
|---|---|---|---|
| A | 6439 | 40 | 0.621214% |
| B | 6439 | 79 | 1.226899% |
| C | 6439 | 66 | 1.025004% |
| D | 6439 | 175 | 2.717813% |
Noise dominated data is calculated using 1-second bins in cleaned event files. If a bin has >2000 counts, and if more than 50% of those come from <1% of pixels, then it is considered to be noise-dominated and hence unusable.
| Quadrant | # 1 sec bins | Bins with >0 counts | Bins with >2000 counts | High rate bins dominated by noise | Noise dominated (total time) | Noise dominated (detector-on time) | Marked lightcurve |
|---|---|---|---|---|---|---|---|
| A | 7794 | 6440 | 0 | 0 | 0.00% | 0.00% | 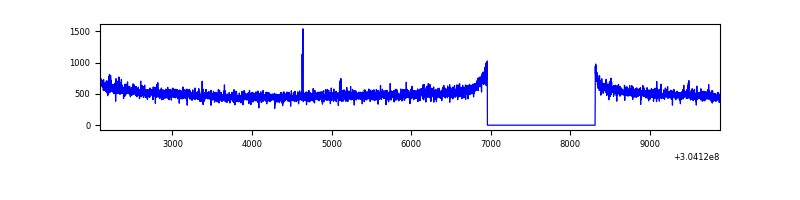 |
| B | 7794 | 6439 | 8 | 8 | 0.10% | 0.12% | 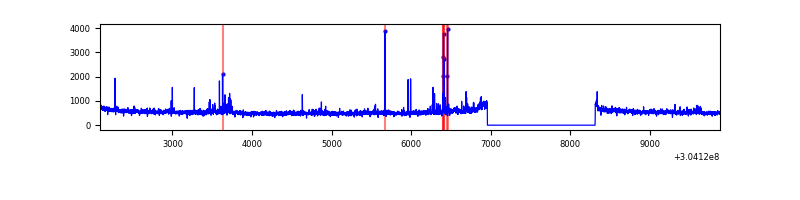 |
| C | 7794 | 6440 | 0 | 0 | 0.00% | 0.00% | 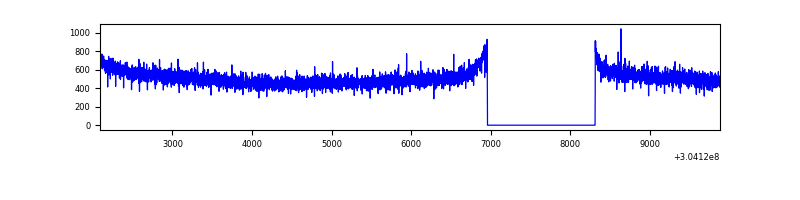 |
| D | 7794 | 6440 | 107 | 107 | 1.37% | 1.66% | 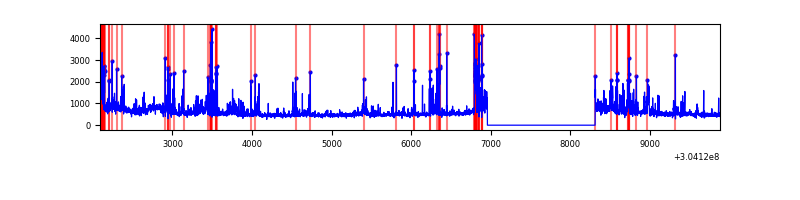 |
Top three noisy pixels from each quadrant. If the there are fewer than three noisy pixels in the level2.evt file, extra rows are filled as -1
| Pixel properties | Quadrant properties | ||||||
|---|---|---|---|---|---|---|---|
| Quadrant | DetID | PixID | Counts | Sigma | Mean | Median | Sigma |
| A | 13 | 254 | 9425 | 51.48 | 834 | 819 | 167.2 |
| A | 0 | 226 | 7135 | 37.78 | 834 | 819 | 167.2 |
| A | 3 | 137 | 6347 | 33.07 | 834 | 819 | 167.2 |
| B | 0 | 219 | 78724 | 503.7 | 842 | 824 | 154.7 |
| B | 0 | 230 | 47480 | 301.67 | 842 | 824 | 154.7 |
| B | 3 | 64 | 41174 | 260.9 | 842 | 824 | 154.7 |
| C | 14 | 238 | 129007 | 689.62 | 805 | 811 | 185.9 |
| C | 13 | 61 | 5677 | 26.18 | 805 | 811 | 185.9 |
| C | 14 | 111 | 1920 | 5.97 | 805 | 811 | 185.9 |
| D | 1 | 52 | 568697 | 3001.92 | 794 | 772 | 189.2 |
| D | 13 | 153 | 176837 | 930.64 | 794 | 772 | 189.2 |
| D | 1 | 239 | 148744 | 782.15 | 794 | 772 | 189.2 |
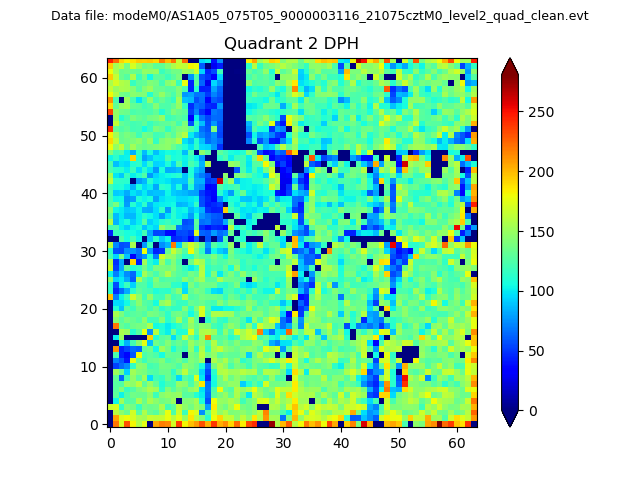
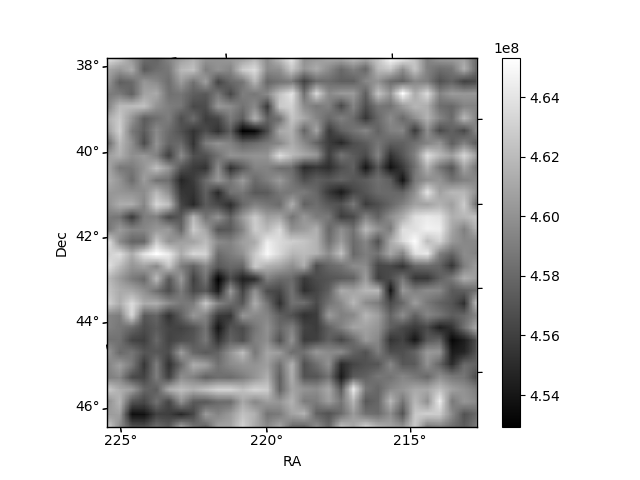
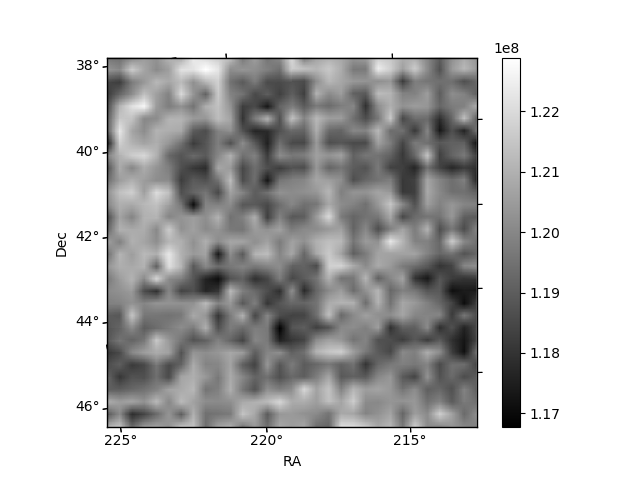
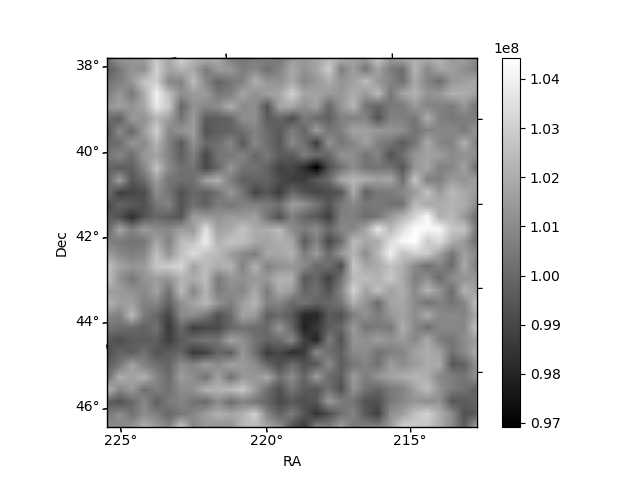
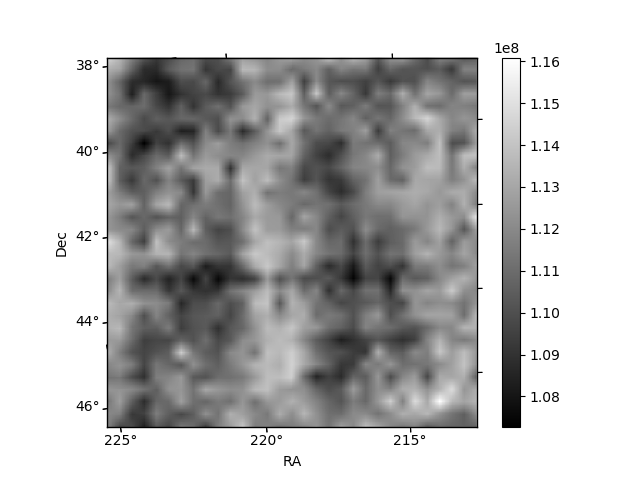
Histogram calculated using DETX and DETY for each event in the final _common_clean file
| Quadrant A | 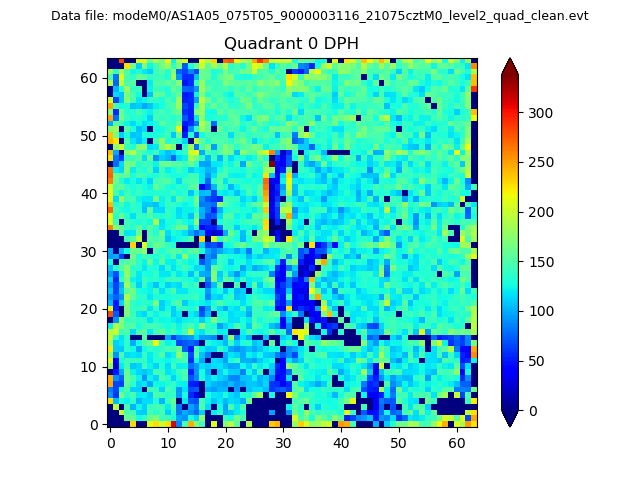 |
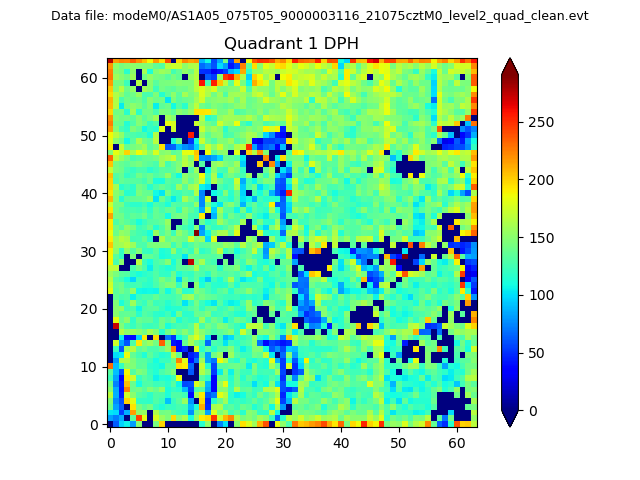 |
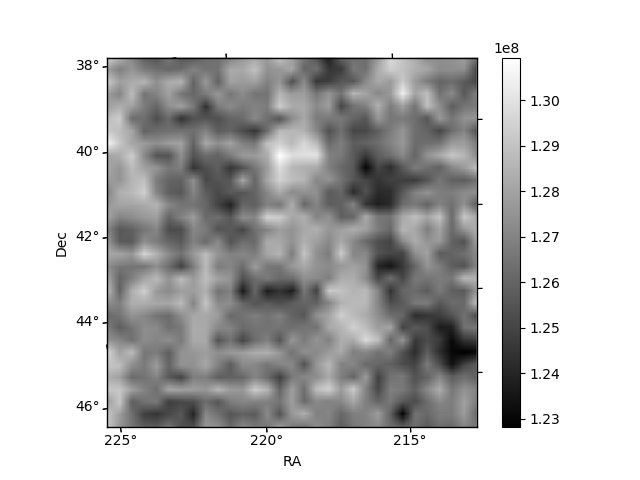
Quadrant B |
|---|---|---|---|
| Quadrant D | 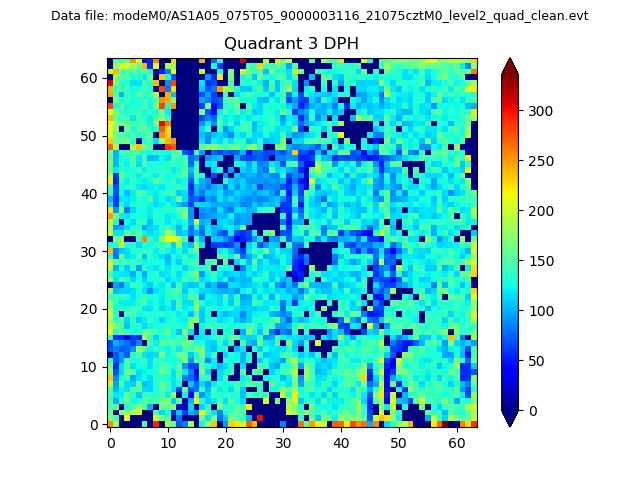 |
 |
Quadrant C |
| Plot type | Count rate plots | Images |
|---|---|---|
| Comparison with Poisson distribution Blue bars denote a histogram of data divided into 1 sec bins. Red curve is a Poisson curve with rate = median count rate of data. |
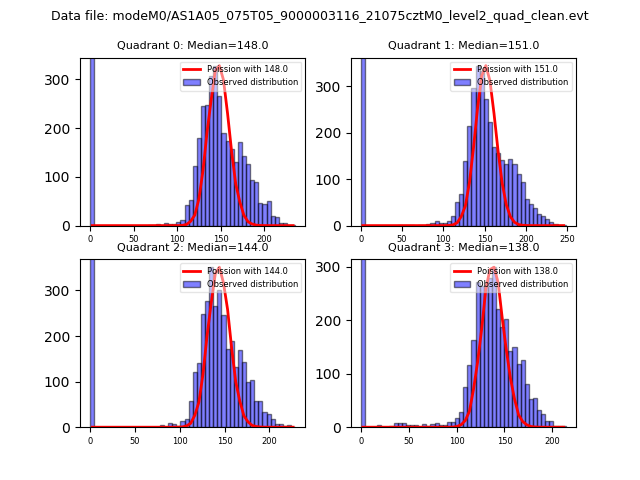 |
 |
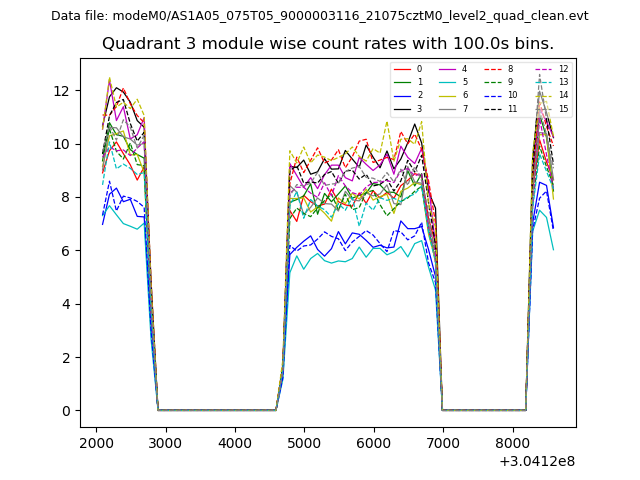
| Quadrant-wise count rates Data is divided into 100 sec bins |
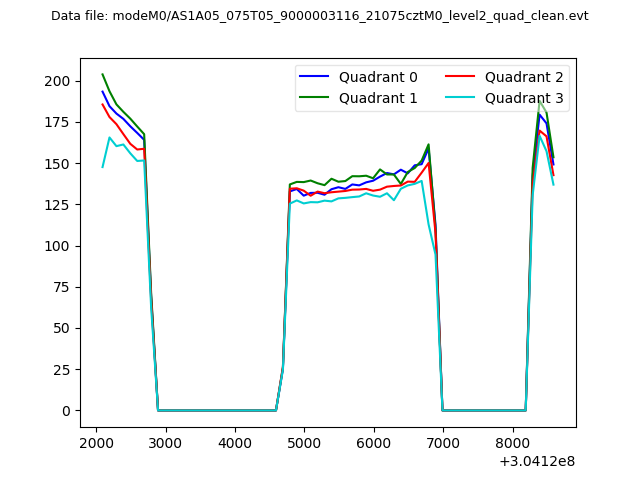 |
|
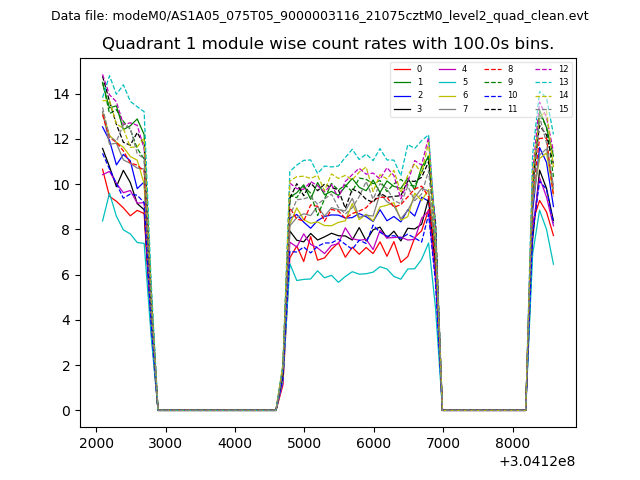
| Module-wise count rates for Quadrant A Data is divided into 100 sec bins |
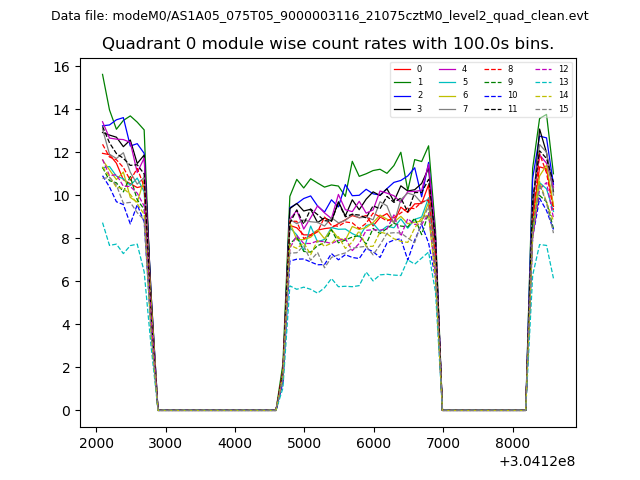 |
 |
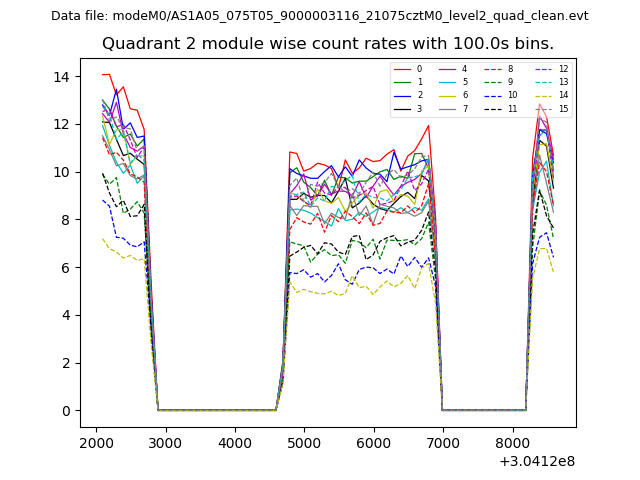
| Module-wise count rates for Quadrant B Data is divided into 100 sec bins |
 |
 |
| Module-wise count rates for Quadrant C Data is divided into 100 sec bins |
 |
 |
| Module-wise count rates for Quadrant D Data is divided into 100 sec bins |
 |
 |
| Parameter | Plot |
|---|---|
| CZT HV Monitor | 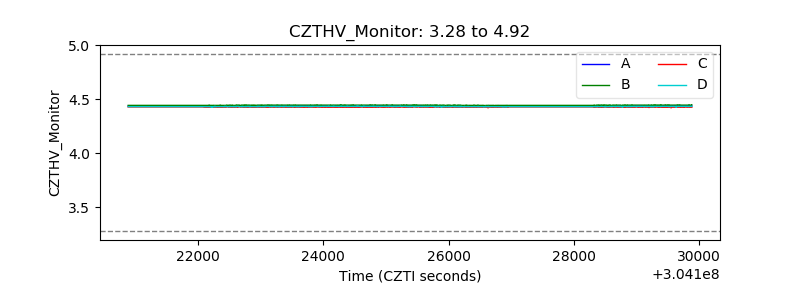 |
| D_VDD | 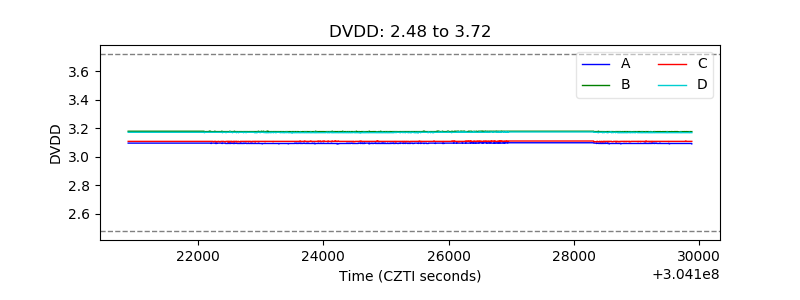 |
| Temperature 1 | 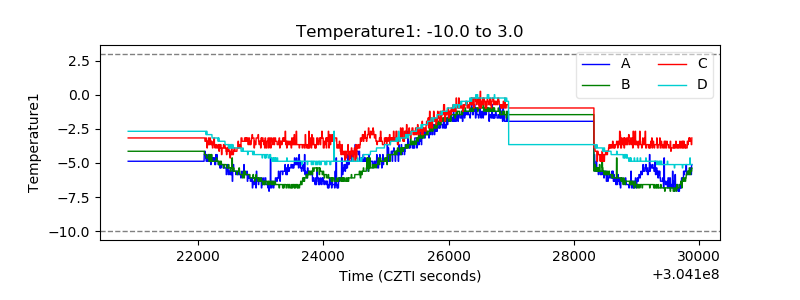 |
| Veto HV Monitor | 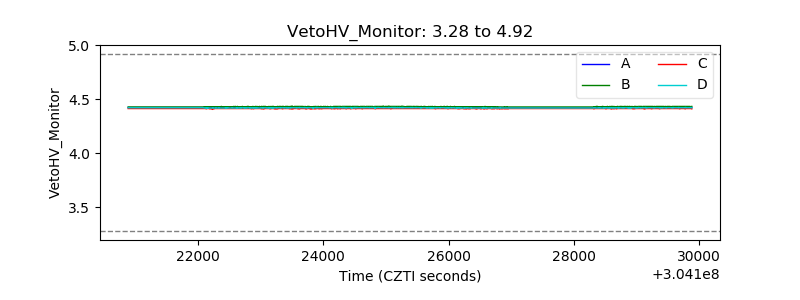 |
| Veto LLD | 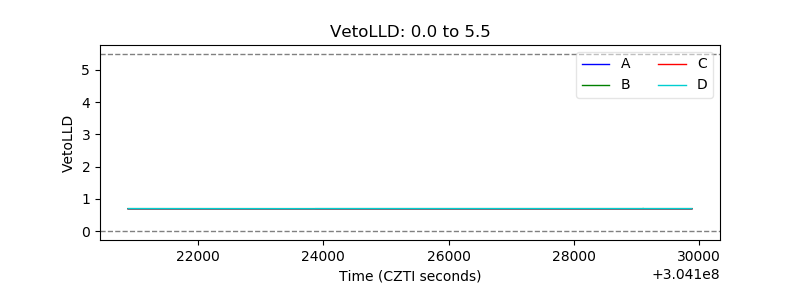 |
| Alpha Counter | 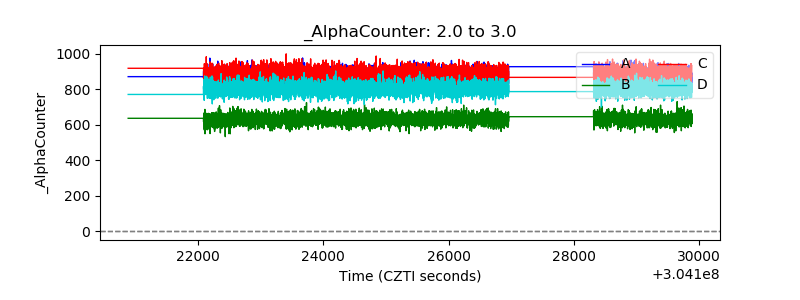 |
| _CPM_Rate | 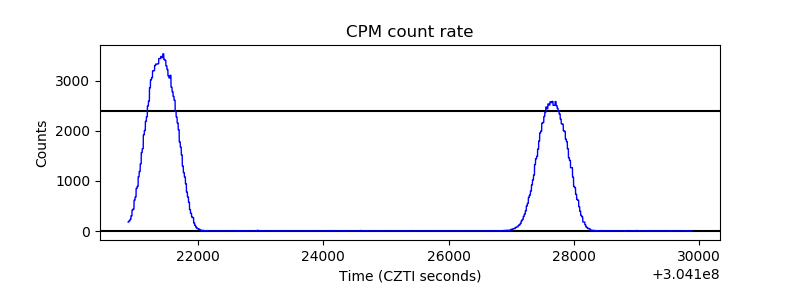 |
| CZT Counter | 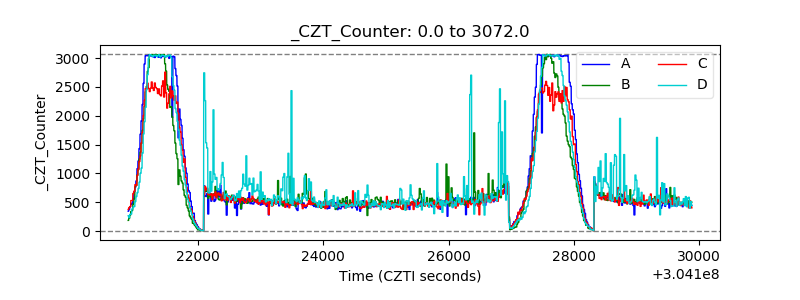 |
| +2.5 Volts monitor | 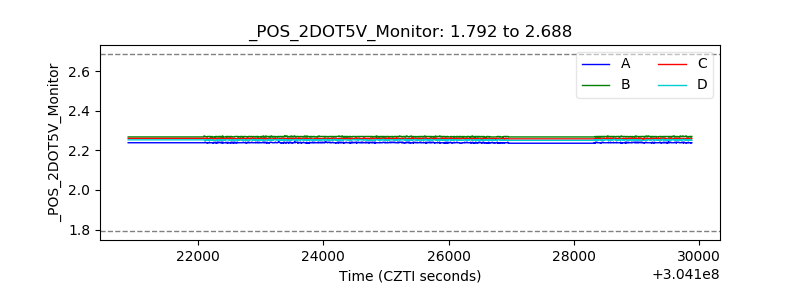 |
| +5 Volts monitor | 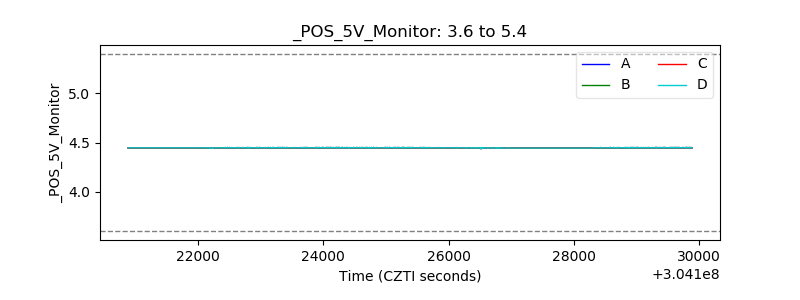 |
| _ROLL_ROT | 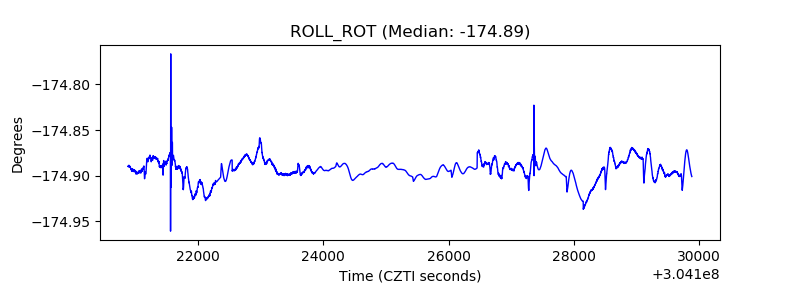 |
| _Roll_DEC | 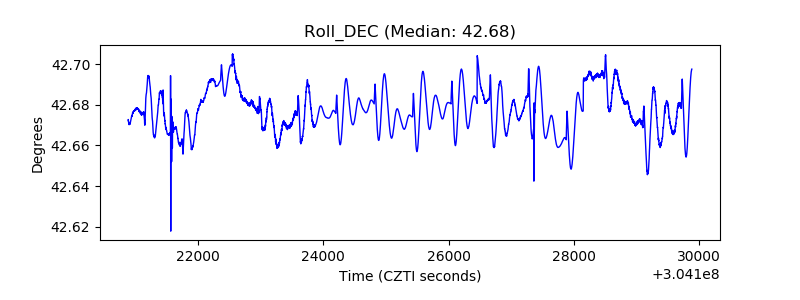 |
| _Roll_RA | 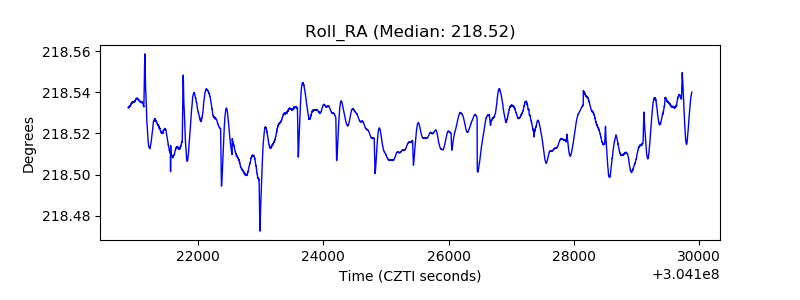 |
| Veto Counter | 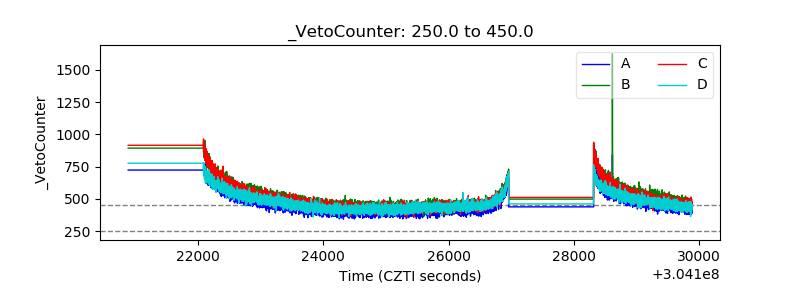 |