| Param | Original file | Final file |
|---|---|---|
| Filename | modeM0/AS1A05_075T05_9000003116_21076cztM0_level2.evt | modeM0/AS1A05_075T05_9000003116_21076cztM0_level2_quad_clean.evt |
| Size (bytes) | 478,529,280 | 69,477,120 |
| Size | 456.4 MB | 66.3 MB |
| Events in quadrant A | 3,207,618 | 424,143 |
| Events in quadrant B | 3,610,514 | 430,560 |
| Events in quadrant C | 3,227,752 | 406,464 |
| Events in quadrant D | 4,007,058 | 390,938 |
| Mode SS | |||
|---|---|---|---|
| Quadrant | BADHDUFLAG | Total packets | Discarded packets |
| A | 0 | 132 | 0 |
| B | 0 | 132 | 0 |
| C | 0 | 132 | 0 |
| D | 0 | 132 | 0 |
| Mode M0 | |||
|---|---|---|---|
| Quadrant | BADHDUFLAG | Total packets | Discarded packets |
| A | 0 | 13456 | 2 |
| B | 0 | 14709 | 2 |
| C | 0 | 13485 | 2 |
| D | 0 | 16116 | 2 |
| Mode M9 | |||
|---|---|---|---|
| Quadrant | BADHDUFLAG | Total packets | Discarded packets |
| A | 0 | 13 | 0 |
| B | 0 | 13 | 0 |
| C | 0 | 13 | 0 |
| D | 0 | 13 | 0 |
| Quadrant | Total seconds | Saturated seconds | Saturation percentage |
|---|---|---|---|
| A | 6471 | 44 | 0.679957% |
| B | 6472 | 76 | 1.174289% |
| C | 6472 | 76 | 1.174289% |
| D | 6471 | 108 | 1.668985% |
Noise dominated data is calculated using 1-second bins in cleaned event files. If a bin has >2000 counts, and if more than 50% of those come from <1% of pixels, then it is considered to be noise-dominated and hence unusable.
| Quadrant | # 1 sec bins | Bins with >0 counts | Bins with >2000 counts | High rate bins dominated by noise | Noise dominated (total time) | Noise dominated (detector-on time) | Marked lightcurve |
|---|---|---|---|---|---|---|---|
| A | 7766 | 6472 | 0 | 0 | 0.00% | 0.00% |  |
| B | 7767 | 6473 | 9 | 9 | 0.12% | 0.14% |  |
| C | 7767 | 6473 | 0 | 0 | 0.00% | 0.00% |  |
| D | 7766 | 6472 | 58 | 58 | 0.75% | 0.90% |  |
Top three noisy pixels from each quadrant. If the there are fewer than three noisy pixels in the level2.evt file, extra rows are filled as -1
| Pixel properties | Quadrant properties | ||||||
|---|---|---|---|---|---|---|---|
| Quadrant | DetID | PixID | Counts | Sigma | Mean | Median | Sigma |
| A | 13 | 254 | 8839 | 49.14 | 829 | 814 | 163.3 |
| A | 0 | 226 | 7165 | 38.89 | 829 | 814 | 163.3 |
| A | 3 | 137 | 6388 | 34.13 | 829 | 814 | 163.3 |
| B | 7 | 220 | 119357 | 765.21 | 833 | 813 | 154.9 |
| B | 0 | 219 | 102246 | 654.76 | 833 | 813 | 154.9 |
| B | 4 | 216 | 47736 | 302.89 | 833 | 813 | 154.9 |
| C | 14 | 238 | 126169 | 678.86 | 795 | 803 | 184.7 |
| C | 13 | 61 | 5582 | 25.88 | 795 | 803 | 184.7 |
| C | 9 | 54 | 2468 | 9.02 | 795 | 803 | 184.7 |
| D | 1 | 239 | 306149 | 1628.16 | 791 | 771 | 187.6 |
| D | 1 | 52 | 282980 | 1504.63 | 791 | 771 | 187.6 |
| D | 7 | 238 | 167451 | 888.67 | 791 | 771 | 187.6 |
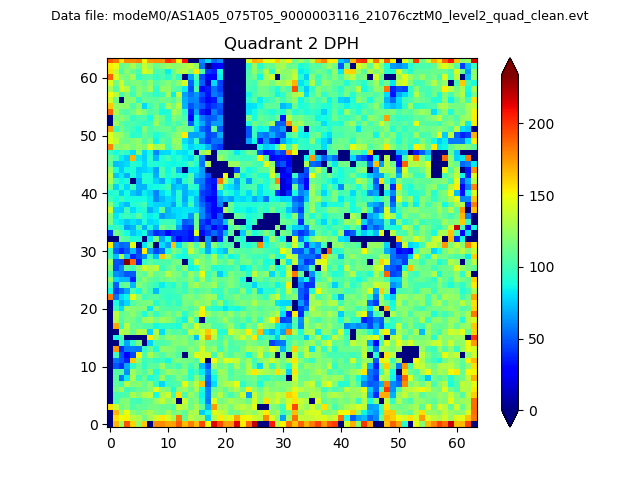
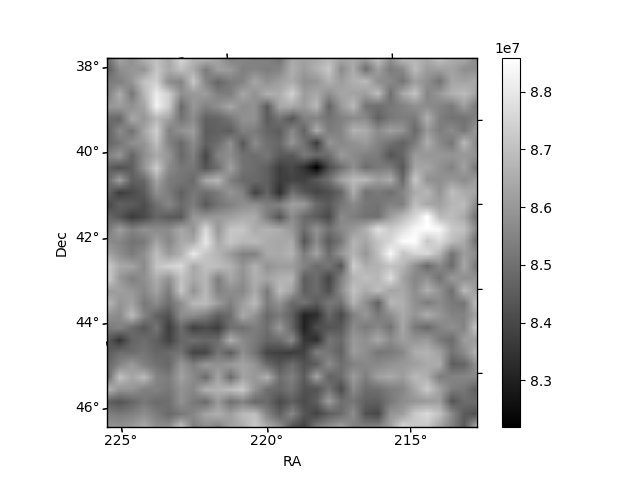
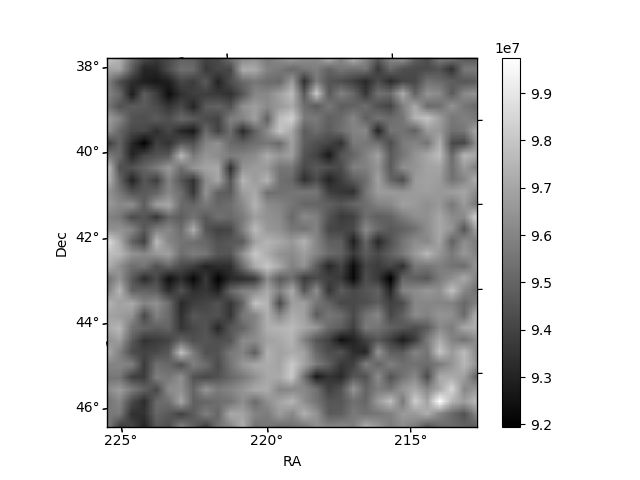
Histogram calculated using DETX and DETY for each event in the final _common_clean file
| Quadrant A | 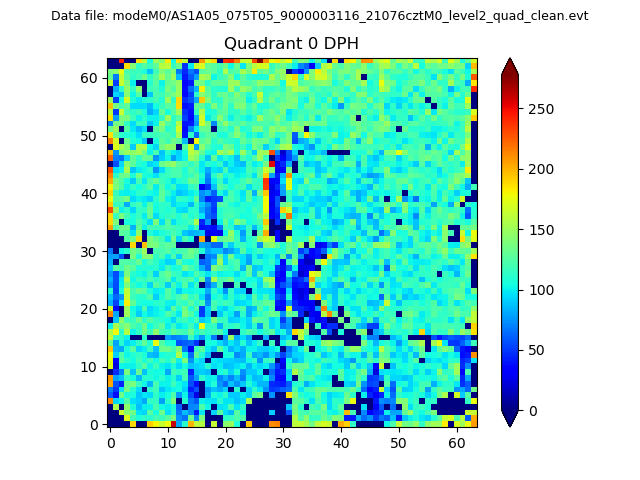 |
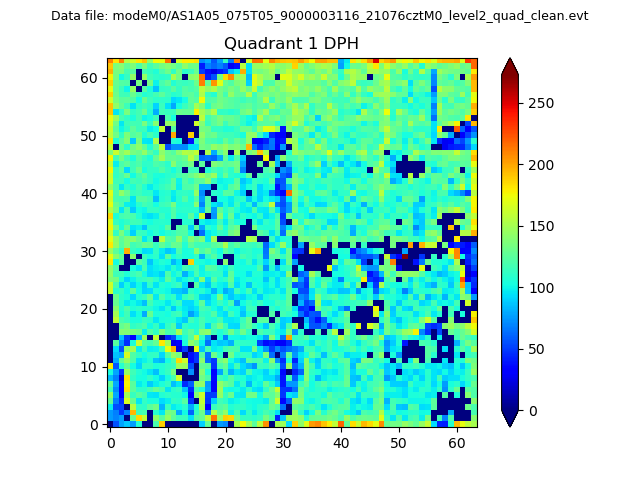 |
Quadrant B |
|---|---|---|---|
| Quadrant D | 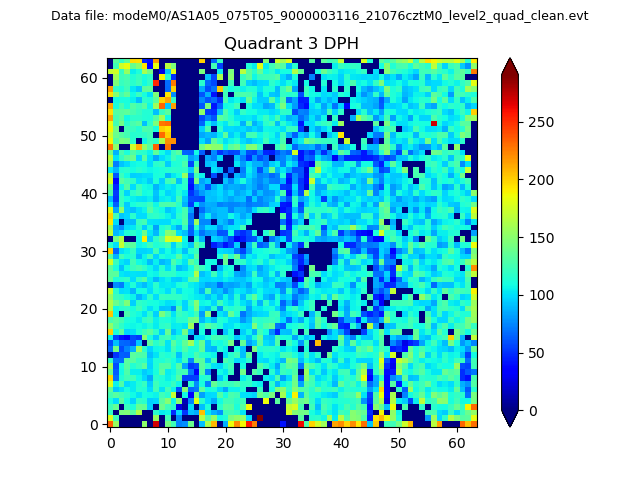 |
 |
Quadrant C |
| Plot type | Count rate plots | Images |
|---|---|---|
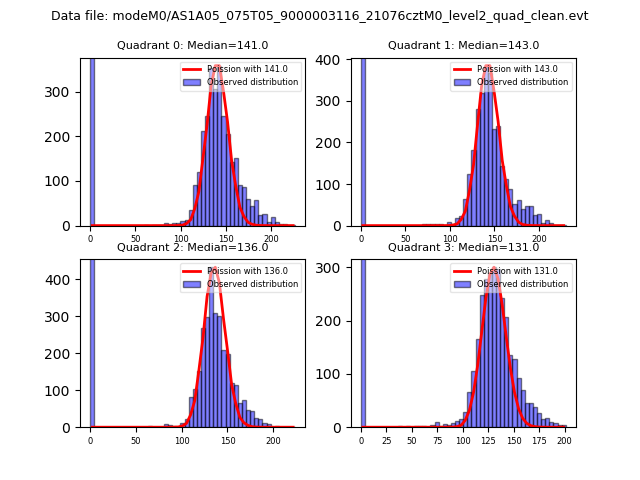
| Comparison with Poisson distribution Blue bars denote a histogram of data divided into 1 sec bins. Red curve is a Poisson curve with rate = median count rate of data. |
 |
 |
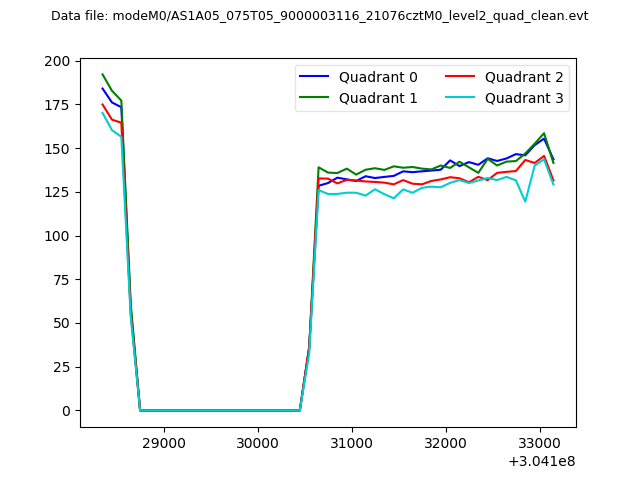
| Quadrant-wise count rates Data is divided into 100 sec bins |
 |
|
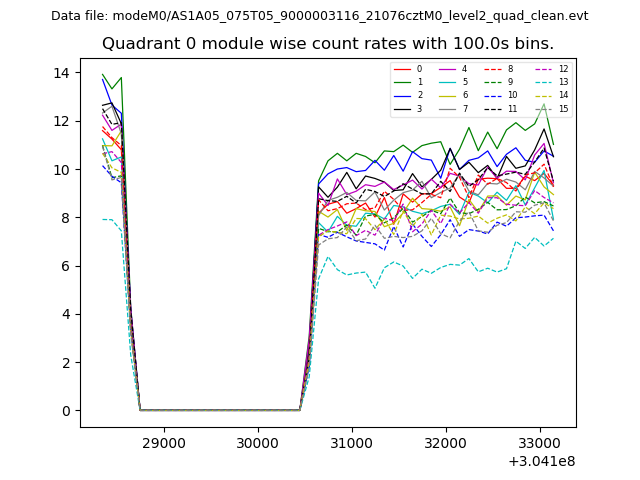
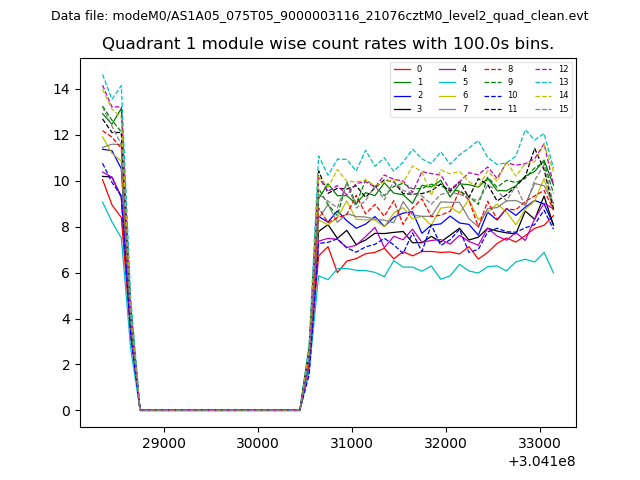
| Module-wise count rates for Quadrant A Data is divided into 100 sec bins |
 |
 |
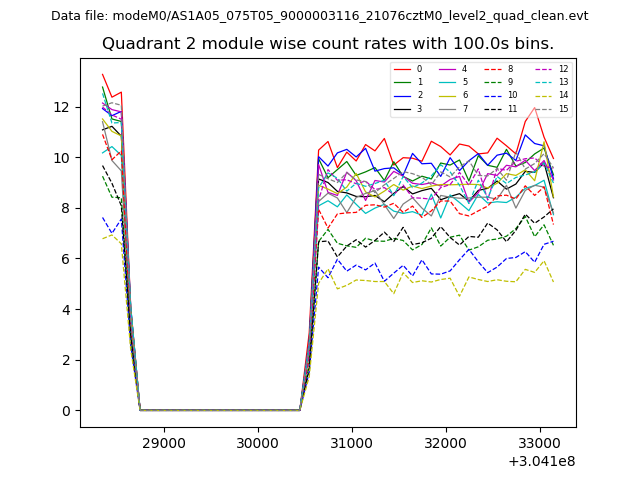
| Module-wise count rates for Quadrant B Data is divided into 100 sec bins |
 |
 |
| Module-wise count rates for Quadrant C Data is divided into 100 sec bins |
 |
 |
| Module-wise count rates for Quadrant D Data is divided into 100 sec bins |
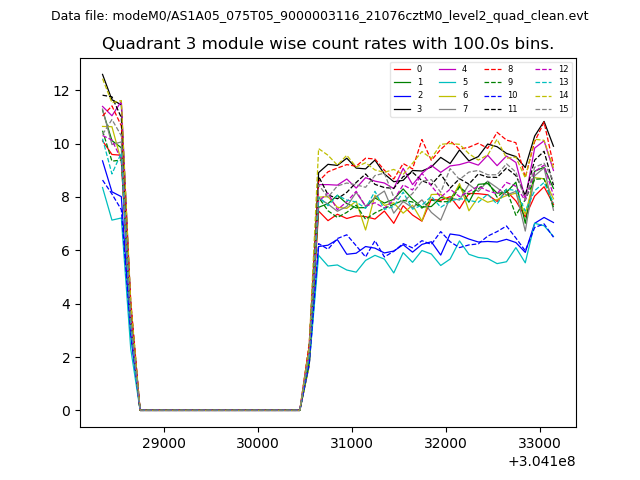 |
 |
| Parameter | Plot |
|---|---|
| CZT HV Monitor | 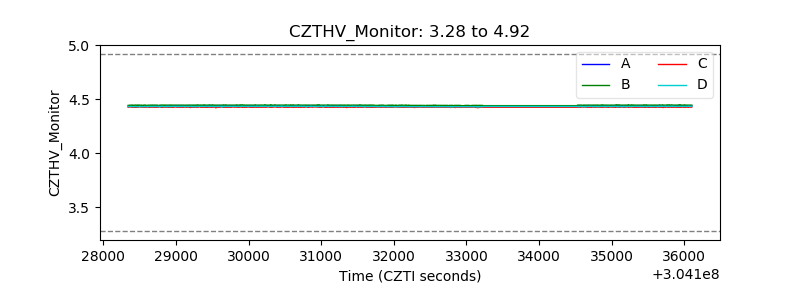 |
| D_VDD | 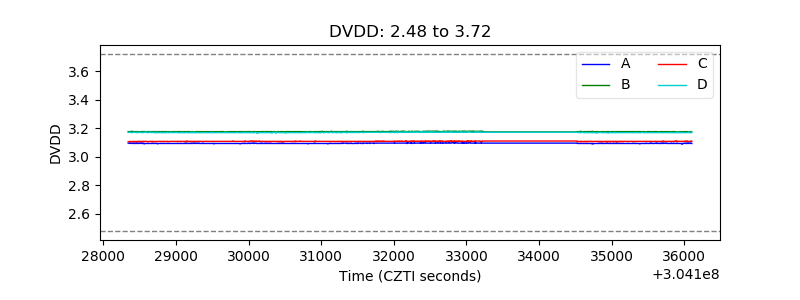 |
| Temperature 1 | 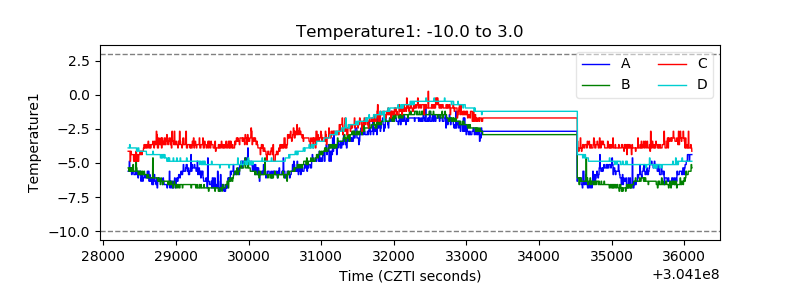 |
| Veto HV Monitor | 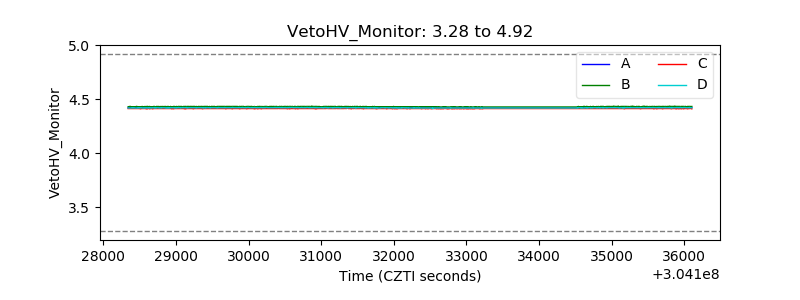 |
| Veto LLD | 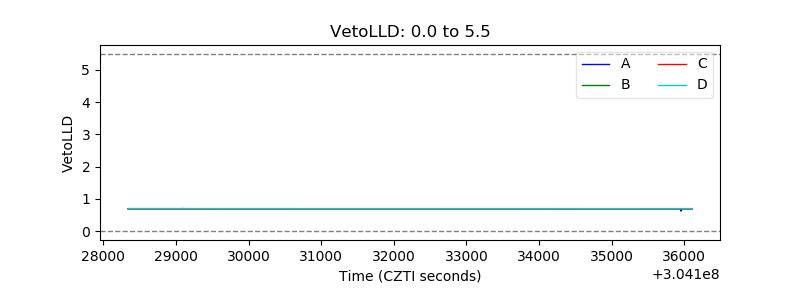 |
| Alpha Counter | 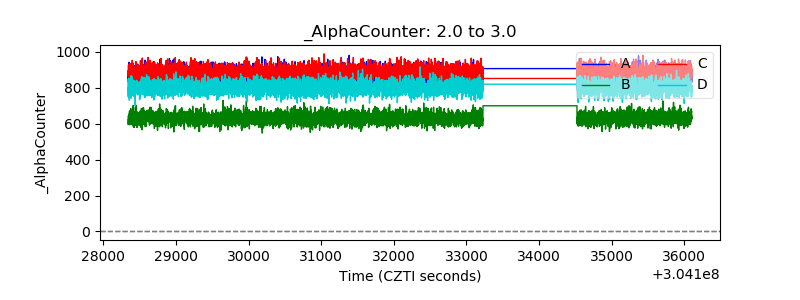 |
| _CPM_Rate | 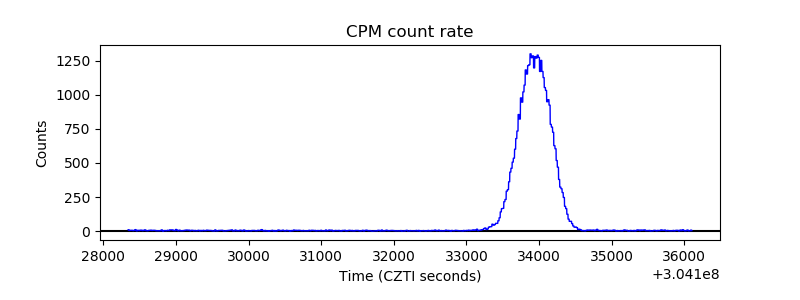 |
| CZT Counter | 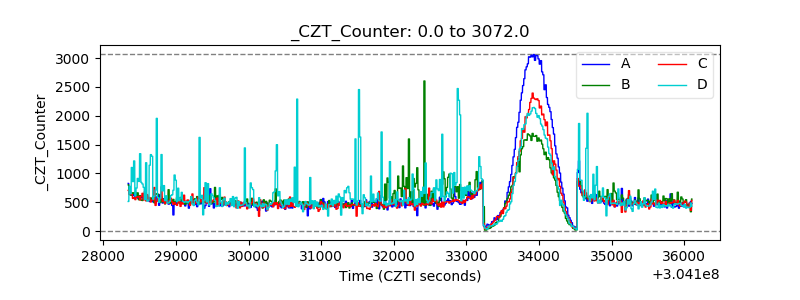 |
| +2.5 Volts monitor |  |
| +5 Volts monitor | 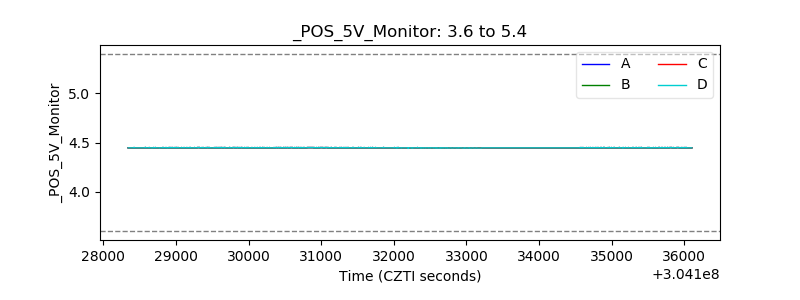 |
| _ROLL_ROT | 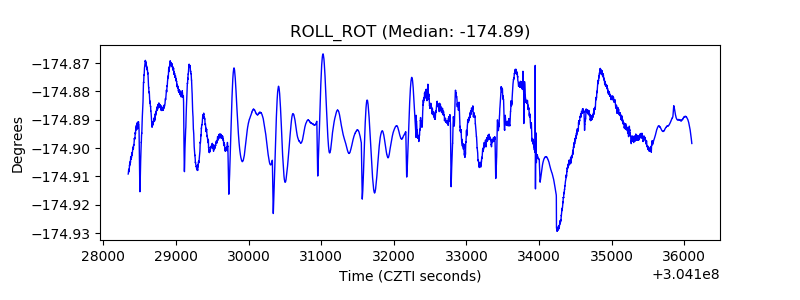 |
| _Roll_DEC | 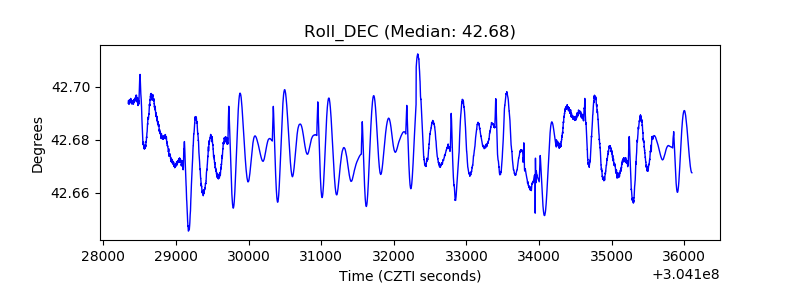 |
| _Roll_RA | 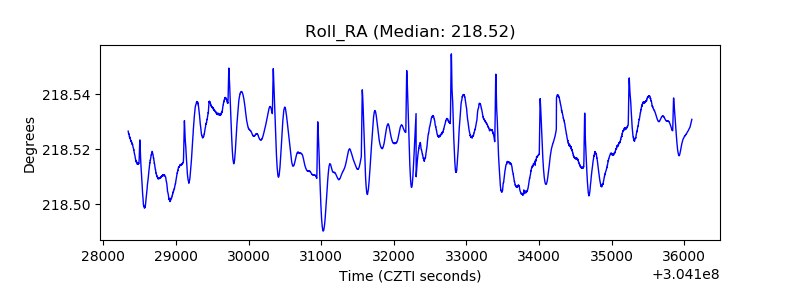 |
| Veto Counter | 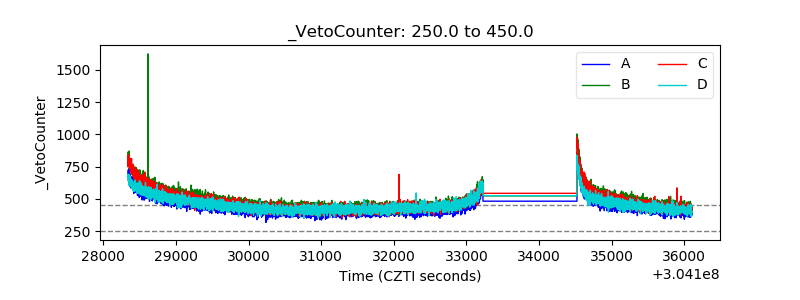 |