| Param | Original file | Final file |
|---|---|---|
| Filename | modeM0/AS1A05_075T05_9000003116_21078cztM0_level2.evt | modeM0/AS1A05_075T05_9000003116_21078cztM0_level2_quad_clean.evt |
| Size (bytes) | 598,760,640 | 84,110,400 |
| Size | 571.0 MB | 80.2 MB |
| Events in quadrant A | 3,272,828 | 546,882 |
| Events in quadrant B | 3,522,817 | 552,181 |
| Events in quadrant C | 3,255,468 | 527,150 |
| Events in quadrant D | 7,613,290 | 438,206 |
| Mode SS | |||
|---|---|---|---|
| Quadrant | BADHDUFLAG | Total packets | Discarded packets |
| A | 0 | 138 | 0 |
| B | 0 | 138 | 0 |
| C | 0 | 138 | 0 |
| D | 0 | 138 | 0 |
| Mode M0 | |||
|---|---|---|---|
| Quadrant | BADHDUFLAG | Total packets | Discarded packets |
| A | 0 | 14234 | 1 |
| B | 0 | 14752 | 1 |
| C | 0 | 14157 | 1 |
| D | 0 | 27410 | 2 |
| Mode M9 | |||
|---|---|---|---|
| Quadrant | BADHDUFLAG | Total packets | Discarded packets |
| A | 0 | 7 | 0 |
| B | 0 | 7 | 0 |
| C | 0 | 7 | 0 |
| D | 0 | 7 | 0 |
| Quadrant | Total seconds | Saturated seconds | Saturation percentage |
|---|---|---|---|
| A | 6926 | 114 | 1.645972% |
| B | 6927 | 143 | 2.064386% |
| C | 6927 | 125 | 1.804533% |
| D | 6926 | 1175 | 16.965059% |
Noise dominated data is calculated using 1-second bins in cleaned event files. If a bin has >2000 counts, and if more than 50% of those come from <1% of pixels, then it is considered to be noise-dominated and hence unusable.
| Quadrant | # 1 sec bins | Bins with >0 counts | Bins with >2000 counts | High rate bins dominated by noise | Noise dominated (total time) | Noise dominated (detector-on time) | Marked lightcurve |
|---|---|---|---|---|---|---|---|
| A | 7531 | 6927 | 3 | 3 | 0.04% | 0.04% |  |
| B | 7532 | 6928 | 13 | 13 | 0.17% | 0.19% |  |
| C | 7532 | 6928 | 0 | 0 | 0.00% | 0.00% |  |
| D | 7531 | 6927 | 807 | 807 | 10.72% | 11.65% | 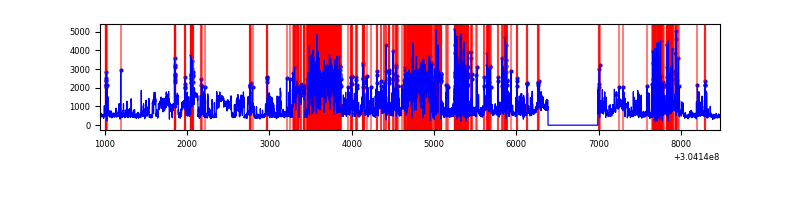 |
Top three noisy pixels from each quadrant. If the there are fewer than three noisy pixels in the level2.evt file, extra rows are filled as -1
| Pixel properties | Quadrant properties | ||||||
|---|---|---|---|---|---|---|---|
| Quadrant | DetID | PixID | Counts | Sigma | Mean | Median | Sigma |
| A | 12 | 96 | 29083 | 167.38 | 838 | 816 | 168.9 |
| A | 15 | 192 | 13961 | 77.84 | 838 | 816 | 168.9 |
| A | 13 | 254 | 9635 | 52.22 | 838 | 816 | 168.9 |
| B | 3 | 64 | 85100 | 531.01 | 836 | 816 | 158.7 |
| B | 0 | 219 | 56557 | 351.18 | 836 | 816 | 158.7 |
| B | 0 | 230 | 39758 | 245.34 | 836 | 816 | 158.7 |
| C | 14 | 238 | 126570 | 669.07 | 802 | 806 | 188.0 |
| C | 13 | 61 | 5589 | 25.45 | 802 | 806 | 188.0 |
| C | 9 | 54 | 2325 | 8.08 | 802 | 806 | 188.0 |
| D | 1 | 52 | 2234891 | 12234.27 | 746 | 723 | 182.6 |
| D | 1 | 239 | 2103857 | 11516.73 | 746 | 723 | 182.6 |
| D | 7 | 238 | 170500 | 929.7 | 746 | 723 | 182.6 |
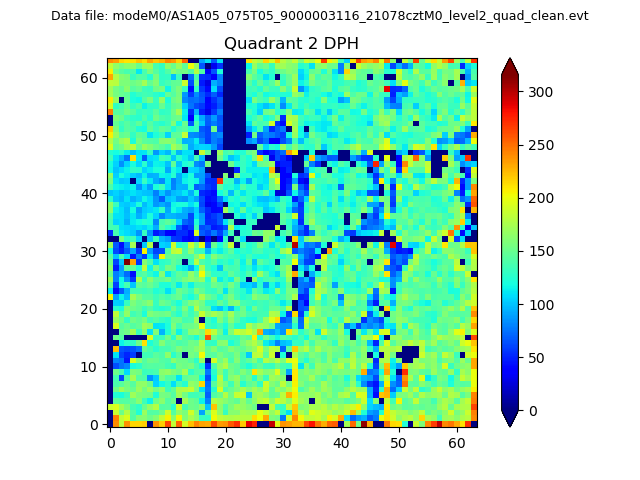
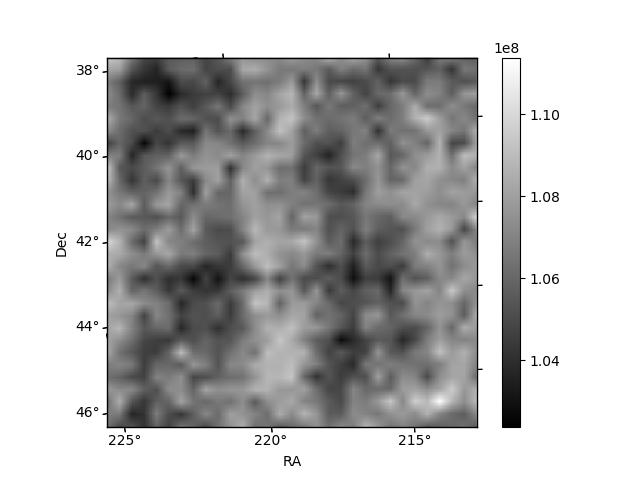
Histogram calculated using DETX and DETY for each event in the final _common_clean file
| Quadrant A | 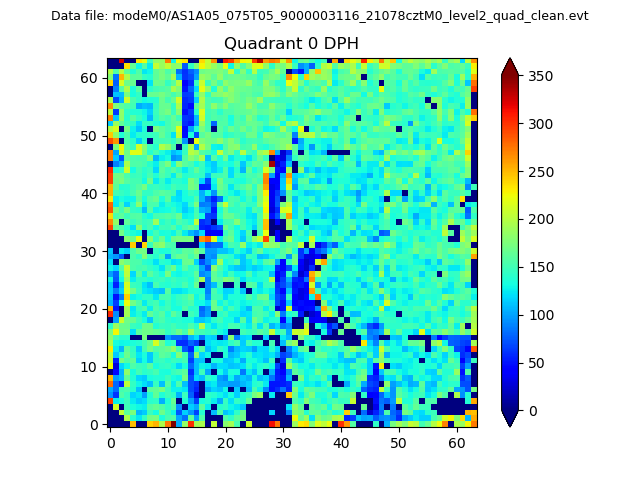 |
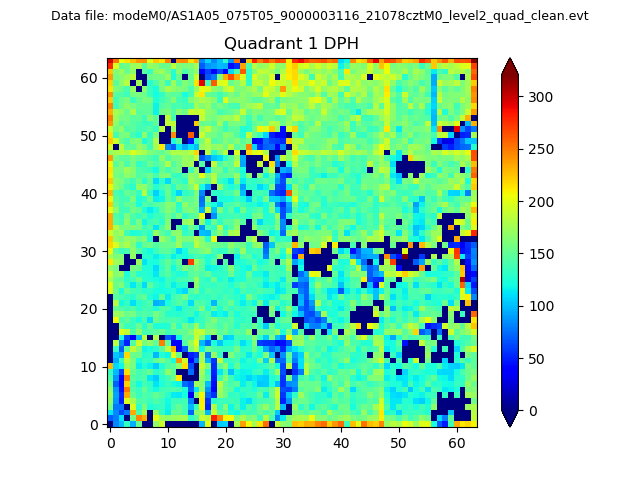 |
Quadrant B |
|---|---|---|---|
| Quadrant D | 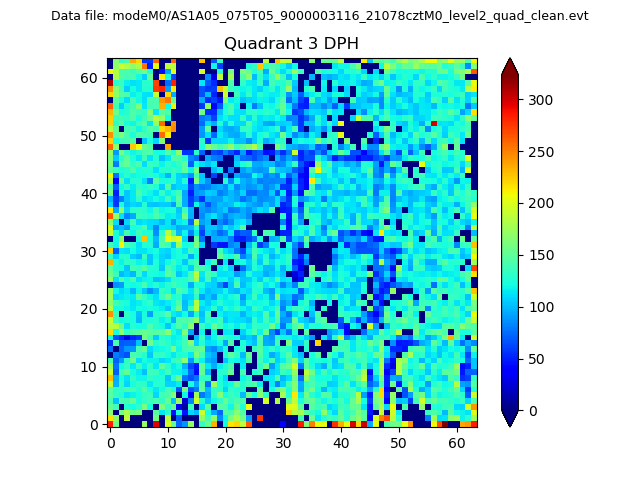 |
 |
Quadrant C |
| Plot type | Count rate plots | Images |
|---|---|---|
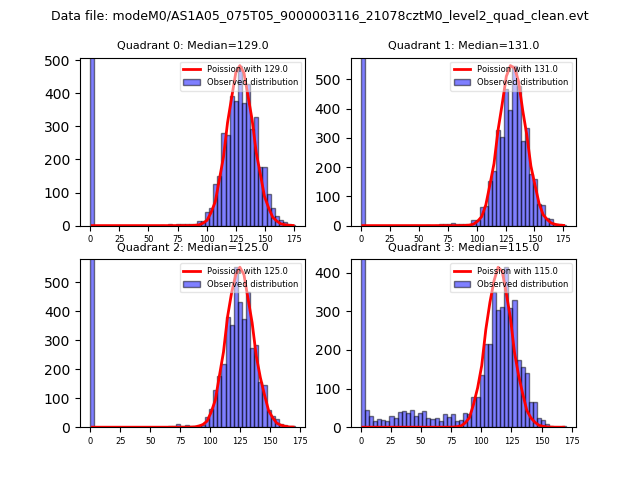
| Comparison with Poisson distribution Blue bars denote a histogram of data divided into 1 sec bins. Red curve is a Poisson curve with rate = median count rate of data. |
 |
 |
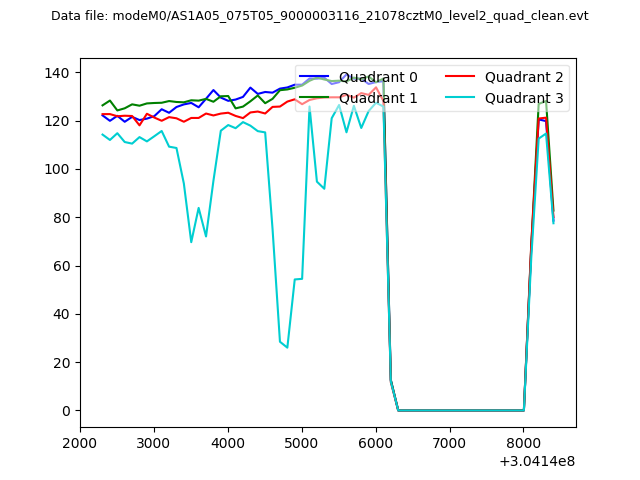
| Quadrant-wise count rates Data is divided into 100 sec bins |
 |
|
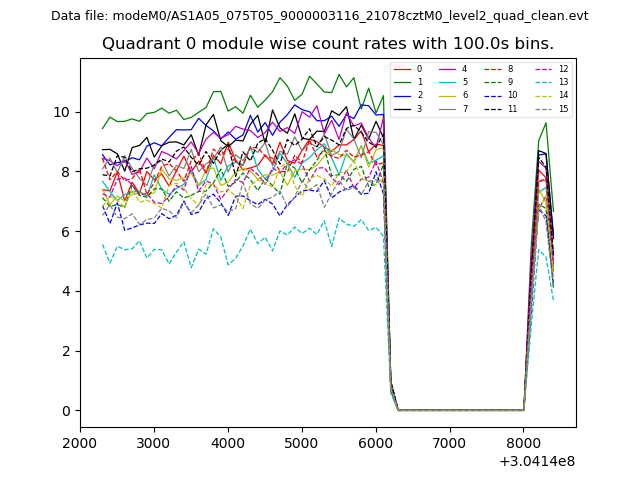
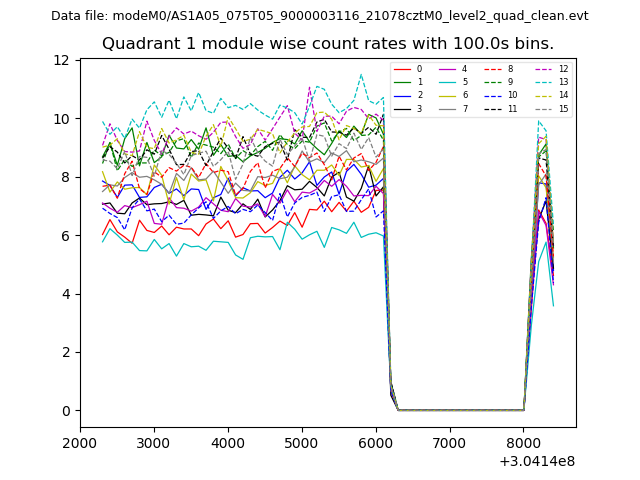
| Module-wise count rates for Quadrant A Data is divided into 100 sec bins |
 |
 |
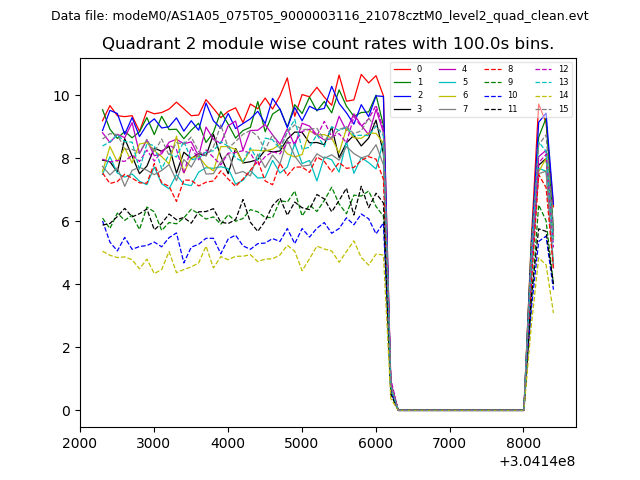
| Module-wise count rates for Quadrant B Data is divided into 100 sec bins |
 |
 |
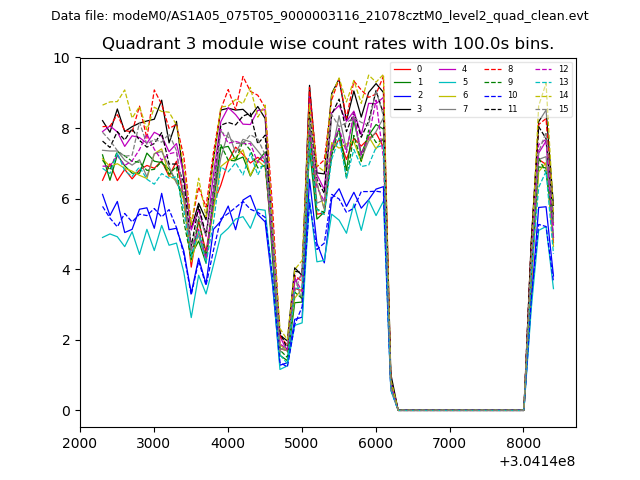
| Module-wise count rates for Quadrant C Data is divided into 100 sec bins |
 |
 |
| Module-wise count rates for Quadrant D Data is divided into 100 sec bins |
 |
 |
| Parameter | Plot |
|---|---|
| CZT HV Monitor | 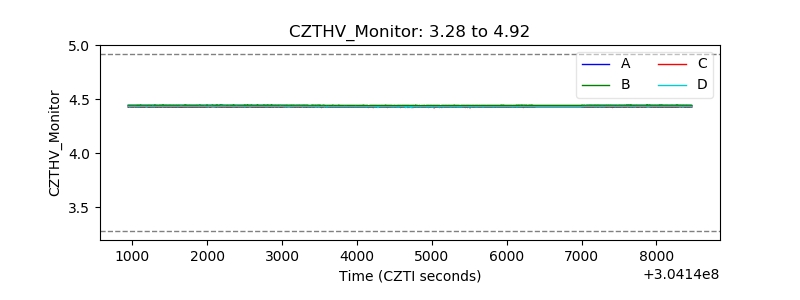 |
| D_VDD | 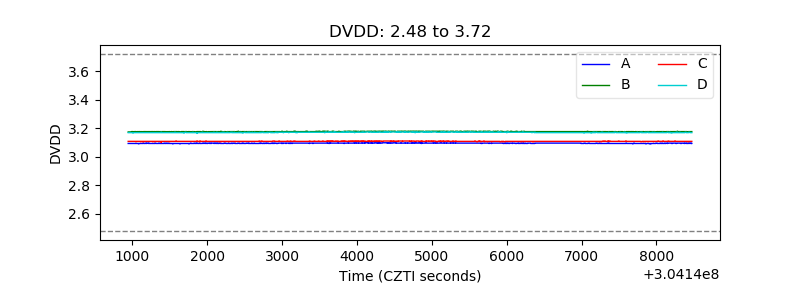 |
| Temperature 1 | 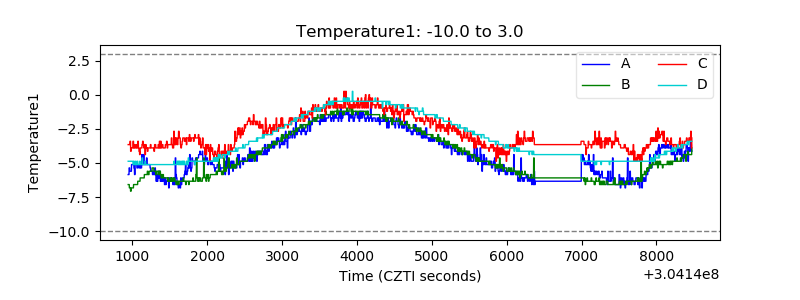 |
| Veto HV Monitor | 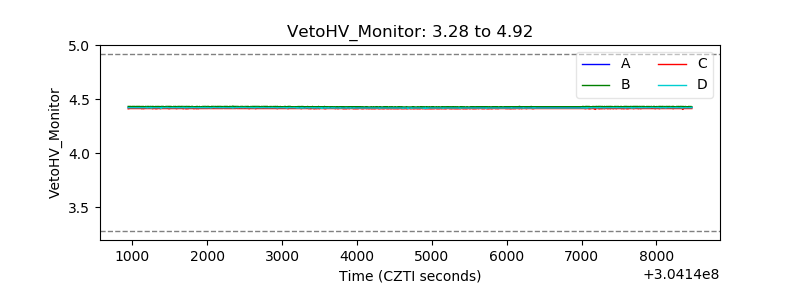 |
| Veto LLD | 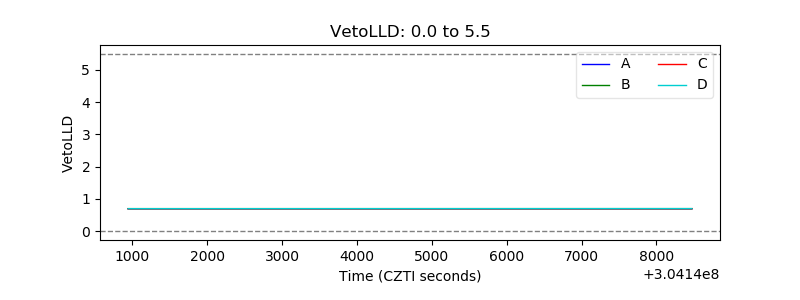 |
| Alpha Counter |  |
| _CPM_Rate | 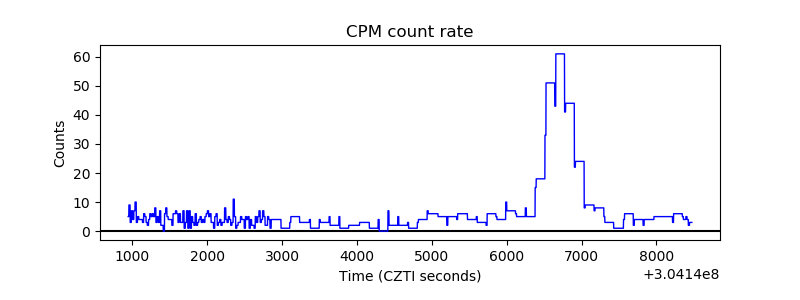 |
| CZT Counter | 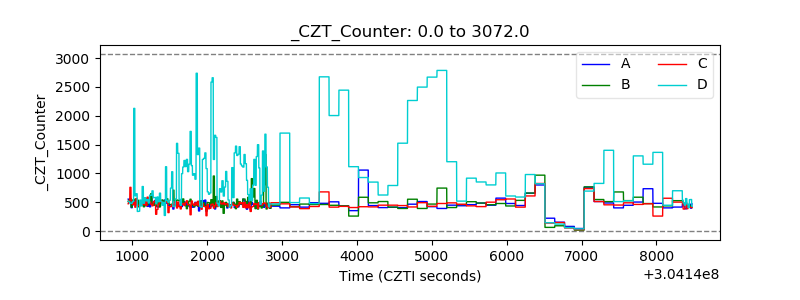 |
| +2.5 Volts monitor | 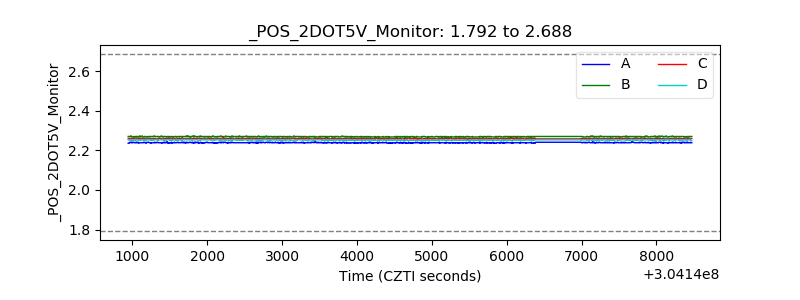 |
| +5 Volts monitor | 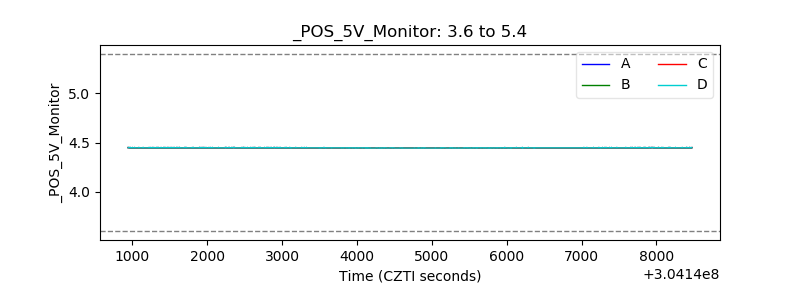 |
| _ROLL_ROT |  |
| _Roll_DEC | 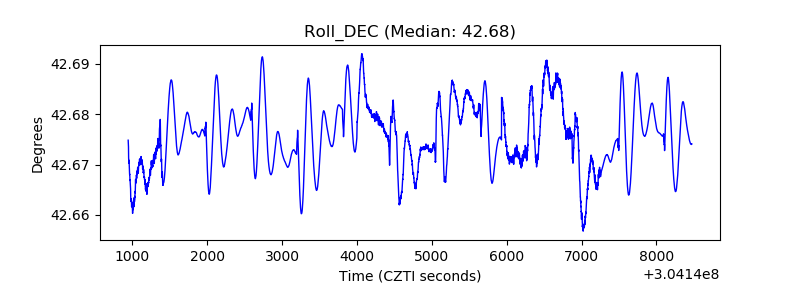 |
| _Roll_RA | 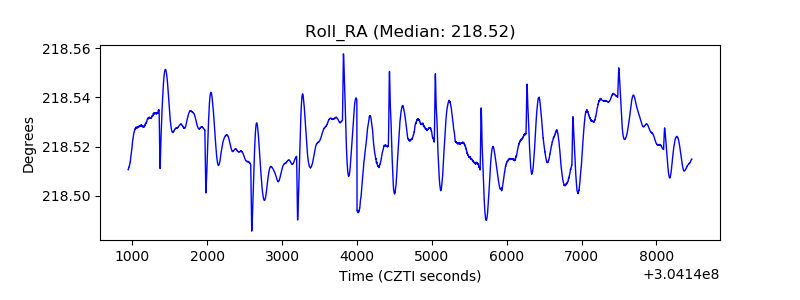 |
| Veto Counter |  |