| Param | Original file | Final file |
|---|---|---|
| Filename | modeM0/AS1A05_075T05_9000003116_21079cztM0_level2.evt | modeM0/AS1A05_075T05_9000003116_21079cztM0_level2_quad_clean.evt |
| Size (bytes) | 574,320,960 | 93,044,160 |
| Size | 547.7 MB | 88.7 MB |
| Events in quadrant A | 3,509,288 | 588,715 |
| Events in quadrant B | 3,933,124 | 592,443 |
| Events in quadrant C | 3,491,974 | 569,756 |
| Events in quadrant D | 5,950,191 | 544,914 |
| Mode SS | |||
|---|---|---|---|
| Quadrant | BADHDUFLAG | Total packets | Discarded packets |
| A | 0 | 152 | 0 |
| B | 0 | 152 | 0 |
| C | 0 | 152 | 0 |
| D | 0 | 152 | 0 |
| Mode M0 | |||
|---|---|---|---|
| Quadrant | BADHDUFLAG | Total packets | Discarded packets |
| A | 0 | 15407 | 2 |
| B | 0 | 16446 | 2 |
| C | 0 | 15348 | 2 |
| D | 0 | 22894 | 2 |
| Mode M9 | |||
|---|---|---|---|
| Quadrant | BADHDUFLAG | Total packets | Discarded packets |
| A | 0 | 3 | 0 |
| B | 0 | 4 | 0 |
| C | 0 | 4 | 0 |
| D | 0 | 4 | 0 |
| Quadrant | Total seconds | Saturated seconds | Saturation percentage |
|---|---|---|---|
| A | 7499 | 118 | 1.573543% |
| B | 7499 | 187 | 2.493666% |
| C | 7499 | 118 | 1.573543% |
| D | 7499 | 478 | 6.374183% |
Noise dominated data is calculated using 1-second bins in cleaned event files. If a bin has >2000 counts, and if more than 50% of those come from <1% of pixels, then it is considered to be noise-dominated and hence unusable.
| Quadrant | # 1 sec bins | Bins with >0 counts | Bins with >2000 counts | High rate bins dominated by noise | Noise dominated (total time) | Noise dominated (detector-on time) | Marked lightcurve |
|---|---|---|---|---|---|---|---|
| A | 7820 | 7501 | 3 | 3 | 0.04% | 0.04% | 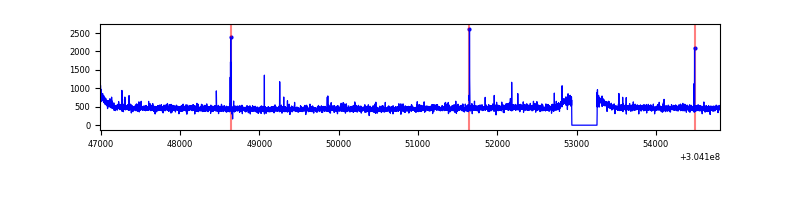 |
| B | 7820 | 7501 | 36 | 36 | 0.46% | 0.48% |  |
| C | 7820 | 7501 | 0 | 0 | 0.00% | 0.00% | 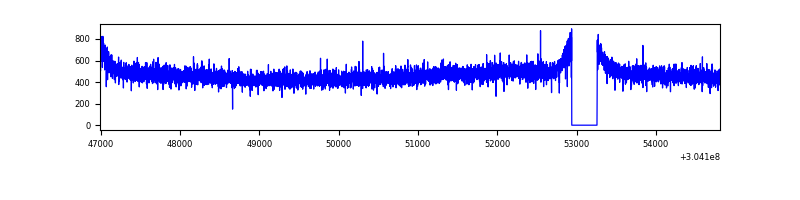 |
| D | 7820 | 7501 | 322 | 322 | 4.12% | 4.29% | 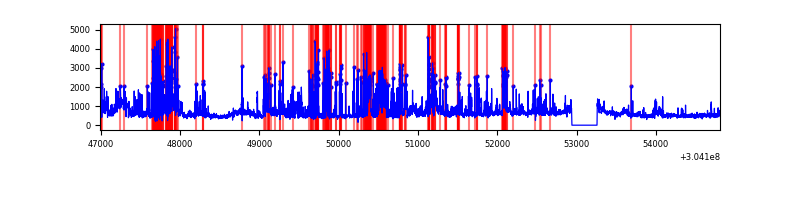 |
Top three noisy pixels from each quadrant. If the there are fewer than three noisy pixels in the level2.evt file, extra rows are filled as -1
| Pixel properties | Quadrant properties | ||||||
|---|---|---|---|---|---|---|---|
| Quadrant | DetID | PixID | Counts | Sigma | Mean | Median | Sigma |
| A | 15 | 192 | 32689 | 174.82 | 899 | 879 | 182.0 |
| A | 13 | 254 | 11388 | 57.75 | 899 | 879 | 182.0 |
| A | 12 | 96 | 9197 | 45.71 | 899 | 879 | 182.0 |
| B | 0 | 219 | 120250 | 705.4 | 893 | 870 | 169.2 |
| B | 0 | 228 | 102434 | 600.13 | 893 | 870 | 169.2 |
| B | 0 | 230 | 71889 | 419.64 | 893 | 870 | 169.2 |
| C | 14 | 238 | 135509 | 664.29 | 861 | 865 | 202.7 |
| C | 13 | 61 | 5956 | 25.12 | 861 | 865 | 202.7 |
| C | 3 | 202 | 2058 | 5.89 | 861 | 865 | 202.7 |
| D | 1 | 239 | 1932127 | 9233.8 | 857 | 830 | 209.2 |
| D | 7 | 238 | 429741 | 2050.68 | 857 | 830 | 209.2 |
| D | 1 | 52 | 138015 | 655.9 | 857 | 830 | 209.2 |
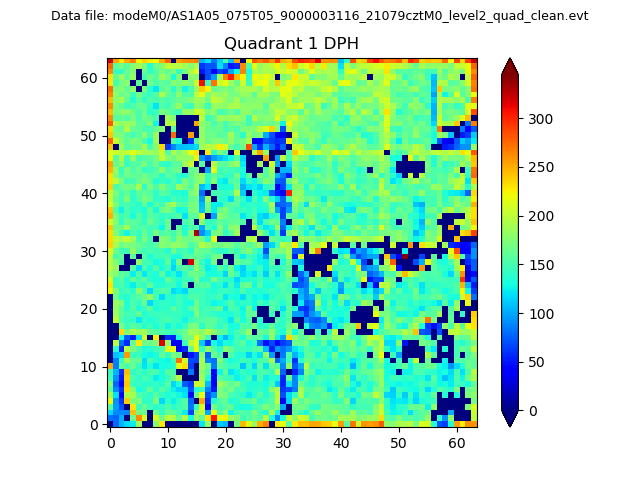
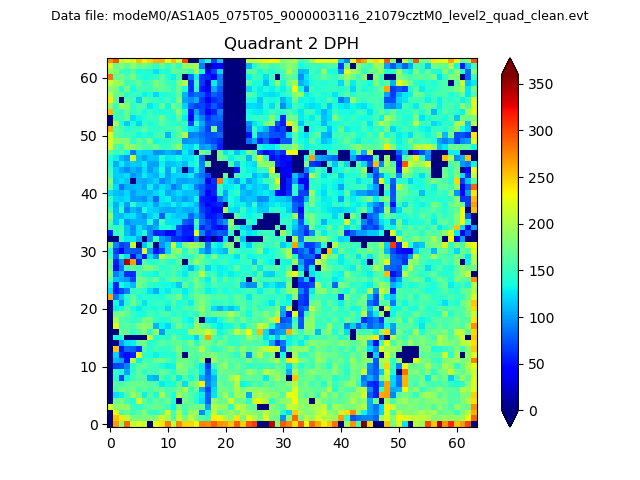
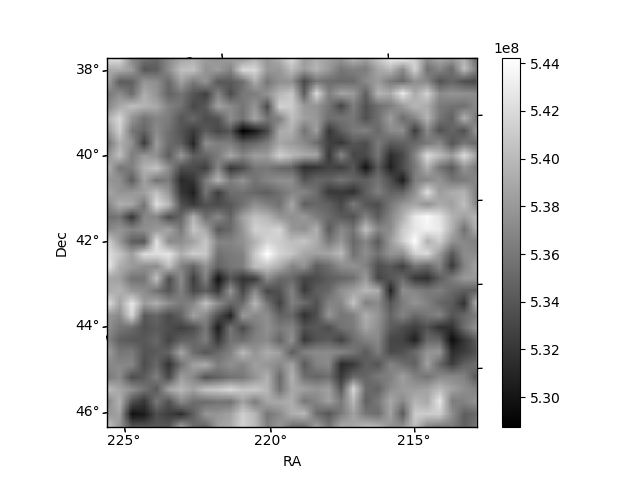
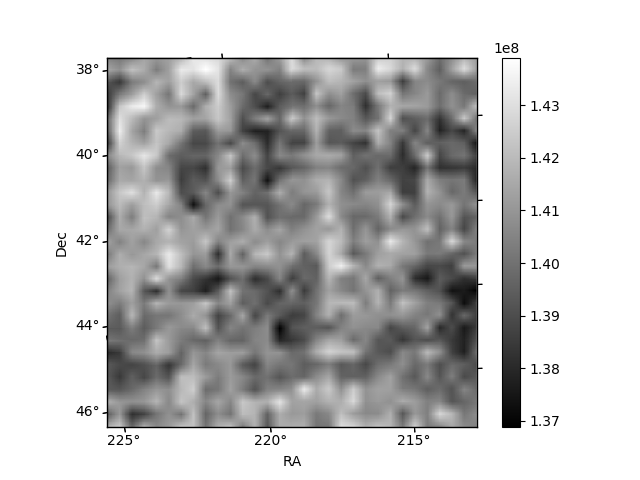
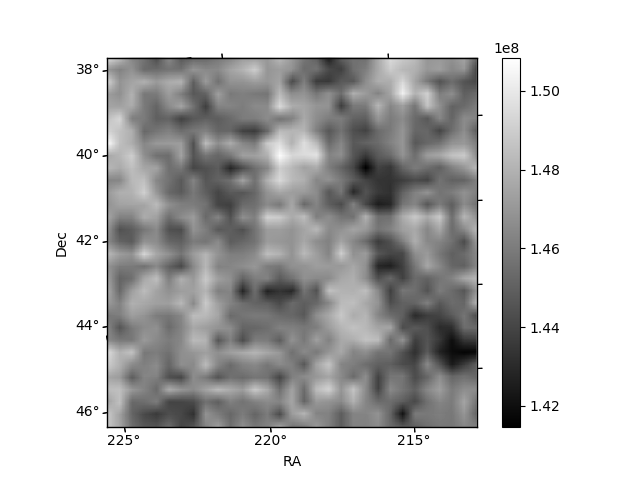
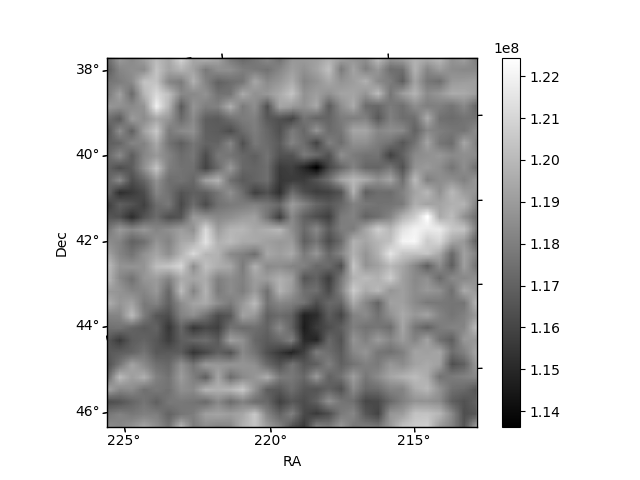
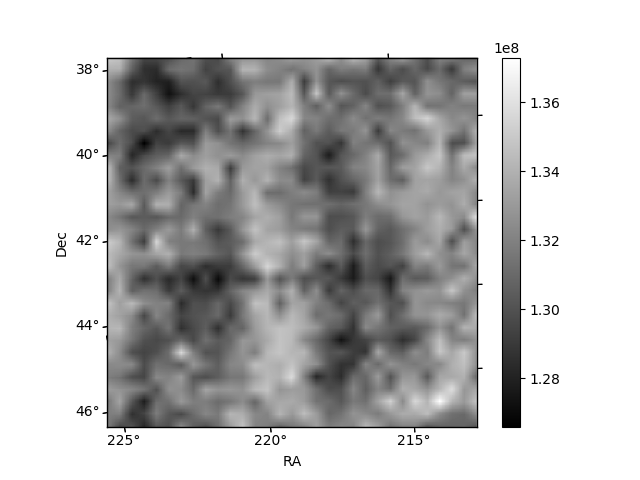
Histogram calculated using DETX and DETY for each event in the final _common_clean file
| Quadrant A | 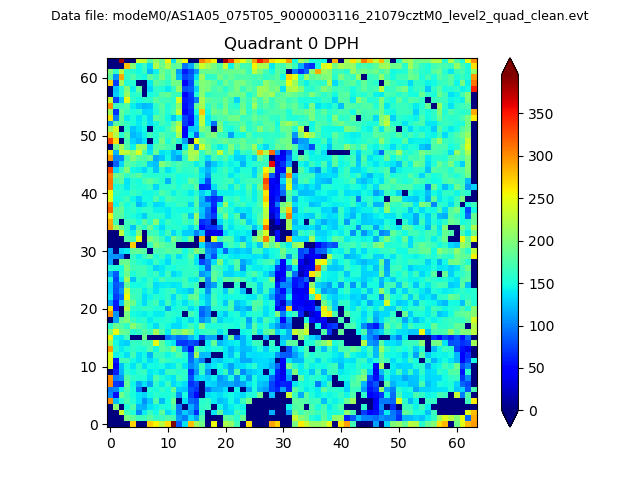 |
 |
Quadrant B |
|---|---|---|---|
| Quadrant D | 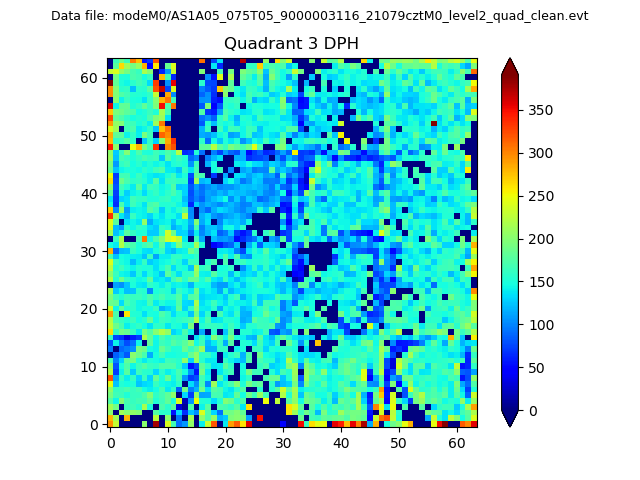 |
 |
Quadrant C |
| Plot type | Count rate plots | Images |
|---|---|---|
| Comparison with Poisson distribution Blue bars denote a histogram of data divided into 1 sec bins. Red curve is a Poisson curve with rate = median count rate of data. |
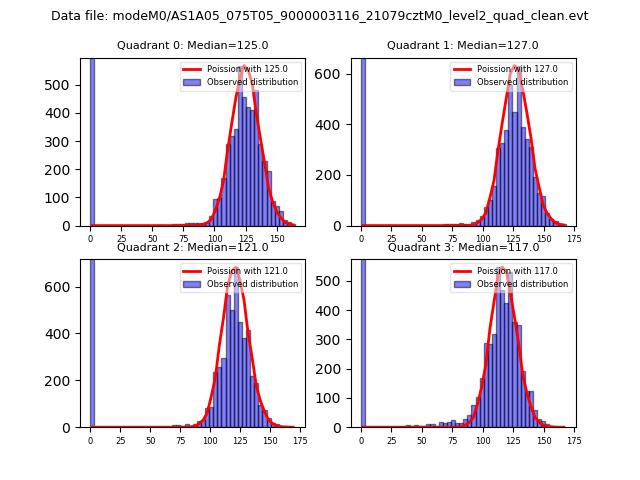 |
 |
| Quadrant-wise count rates Data is divided into 100 sec bins |
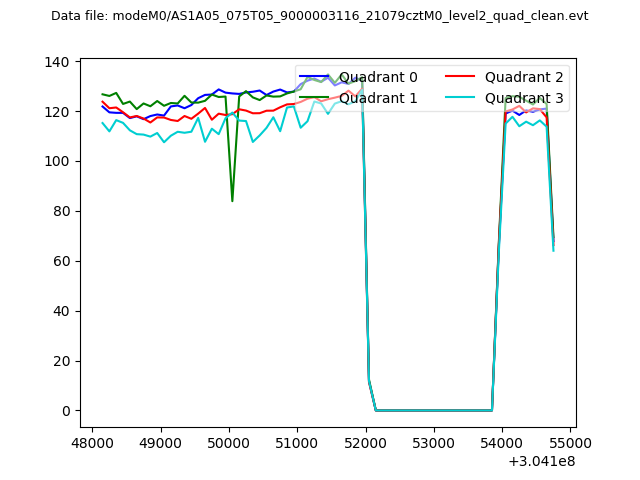 |
|
| Module-wise count rates for Quadrant A Data is divided into 100 sec bins |
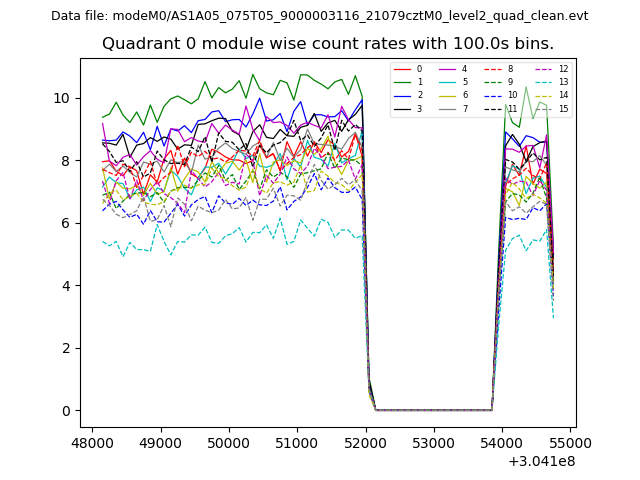 |
 |
| Module-wise count rates for Quadrant B Data is divided into 100 sec bins |
 |
 |
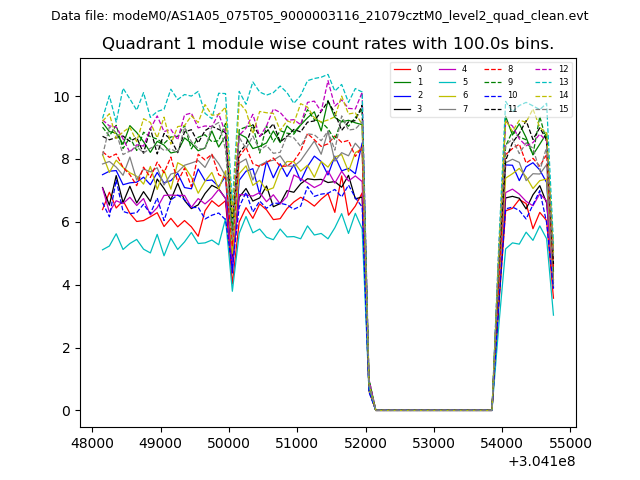
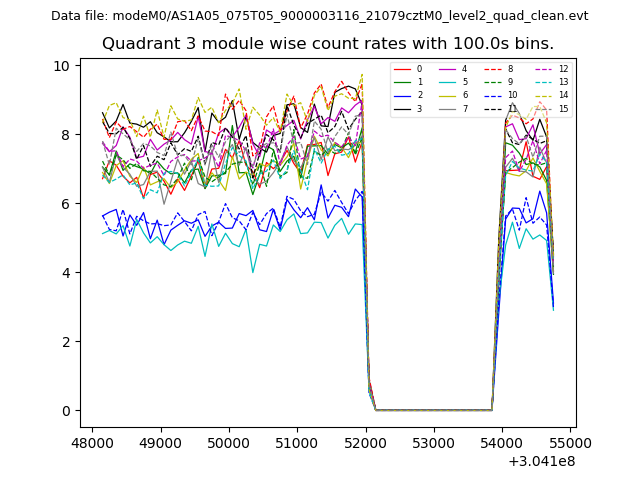
| Module-wise count rates for Quadrant C Data is divided into 100 sec bins |
 |
 |
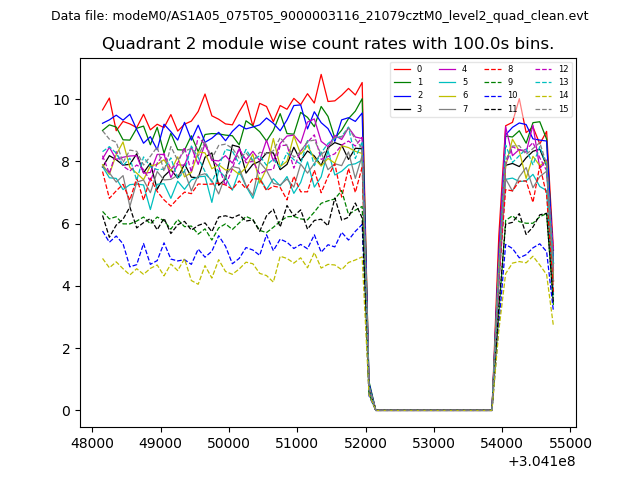
| Module-wise count rates for Quadrant D Data is divided into 100 sec bins |
 |
 |
| Parameter | Plot |
|---|---|
| CZT HV Monitor | 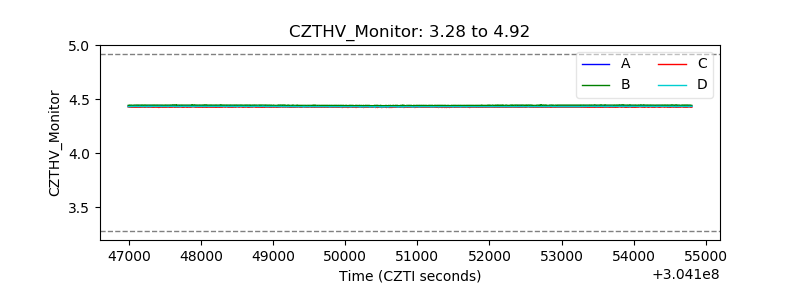 |
| D_VDD | 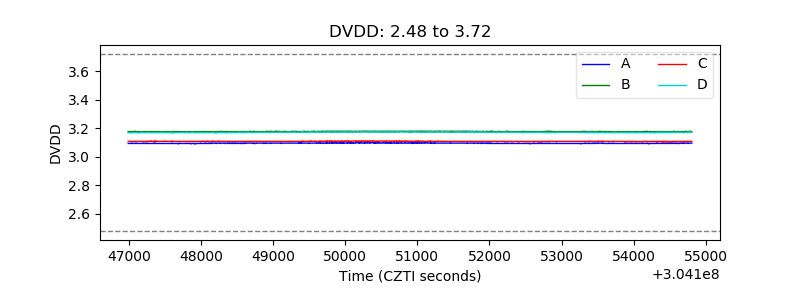 |
| Temperature 1 | 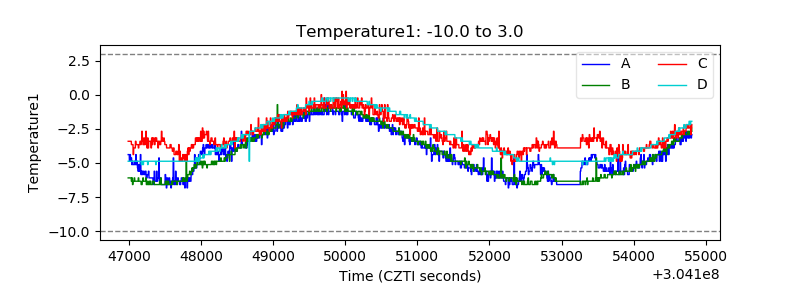 |
| Veto HV Monitor |  |
| Veto LLD | 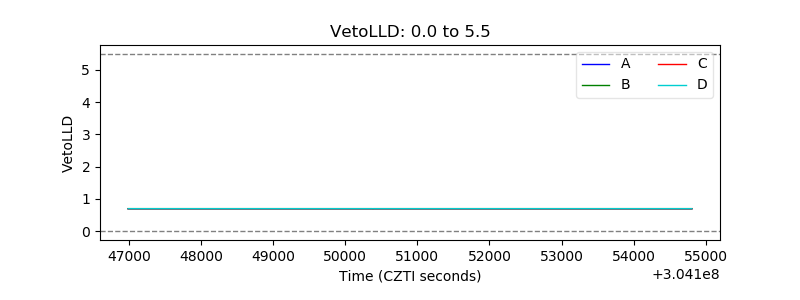 |
| Alpha Counter | 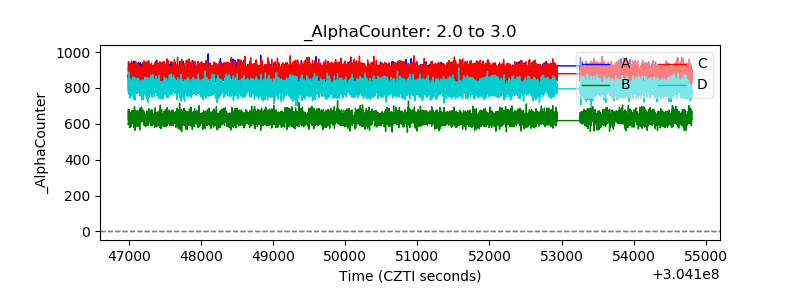 |
| _CPM_Rate | 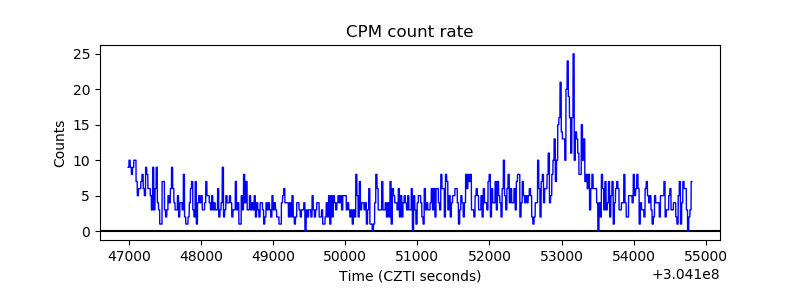 |
| CZT Counter | 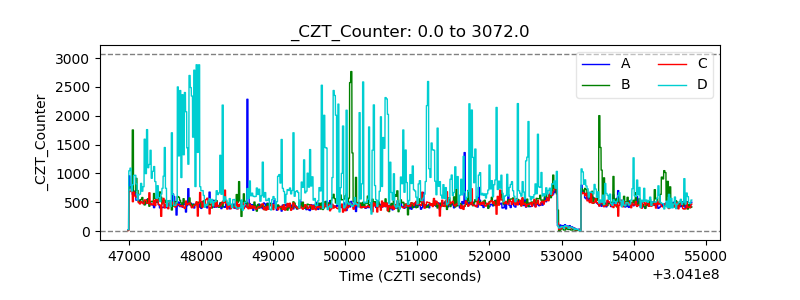 |
| +2.5 Volts monitor |  |
| +5 Volts monitor | 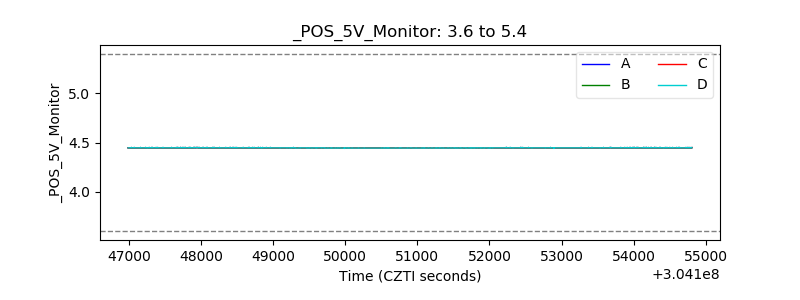 |
| _ROLL_ROT | 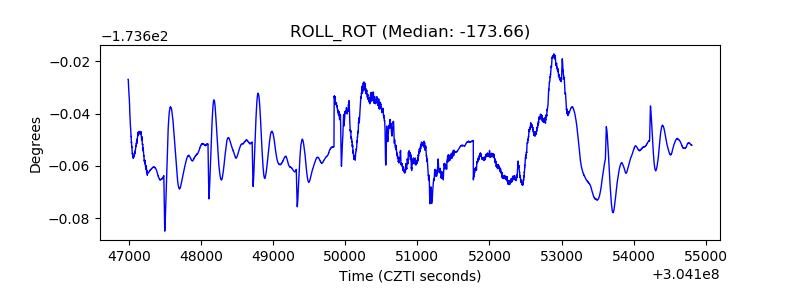 |
| _Roll_DEC |  |
| _Roll_RA | 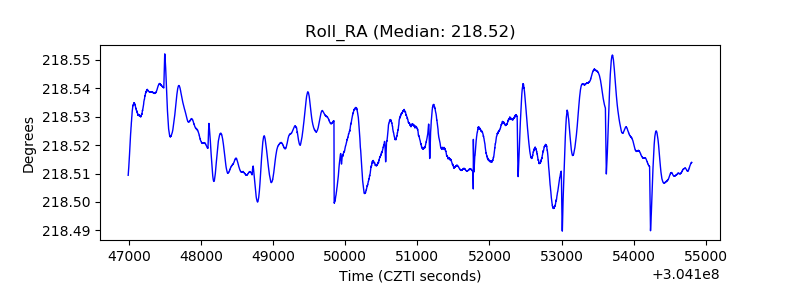 |
| Veto Counter | 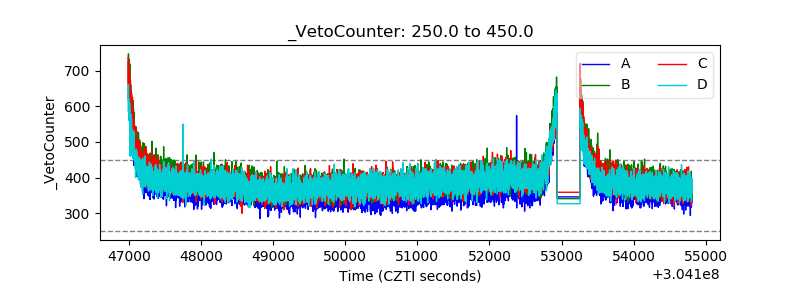 |