| Param | Original file | Final file |
|---|---|---|
| Filename | modeM0/AS1A05_075T05_9000003116_21080cztM0_level2.evt | modeM0/AS1A05_075T05_9000003116_21080cztM0_level2_quad_clean.evt |
| Size (bytes) | 570,594,240 | 100,137,600 |
| Size | 544.2 MB | 95.5 MB |
| Events in quadrant A | 3,557,127 | 642,314 |
| Events in quadrant B | 3,929,927 | 647,294 |
| Events in quadrant C | 3,541,466 | 619,346 |
| Events in quadrant D | 5,737,165 | 595,601 |
| Mode SS | |||
|---|---|---|---|
| Quadrant | BADHDUFLAG | Total packets | Discarded packets |
| A | 0 | 156 | 0 |
| B | 0 | 156 | 0 |
| C | 0 | 156 | 0 |
| D | 0 | 156 | 0 |
| Mode M0 | |||
|---|---|---|---|
| Quadrant | BADHDUFLAG | Total packets | Discarded packets |
| A | 0 | 15605 | 2 |
| B | 0 | 16548 | 2 |
| C | 0 | 15562 | 2 |
| D | 0 | 22222 | 2 |
| Mode M9 | |||
|---|---|---|---|
| Quadrant | BADHDUFLAG | Total packets | Discarded packets |
| A | 0 | 6 | 0 |
| B | 0 | 6 | 0 |
| C | 0 | 6 | 0 |
| D | 0 | 6 | 0 |
| Quadrant | Total seconds | Saturated seconds | Saturation percentage |
|---|---|---|---|
| A | 7590 | 116 | 1.528327% |
| B | 7590 | 139 | 1.831357% |
| C | 7590 | 128 | 1.686430% |
| D | 7591 | 243 | 3.201159% |
Noise dominated data is calculated using 1-second bins in cleaned event files. If a bin has >2000 counts, and if more than 50% of those come from <1% of pixels, then it is considered to be noise-dominated and hence unusable.
| Quadrant | # 1 sec bins | Bins with >0 counts | Bins with >2000 counts | High rate bins dominated by noise | Noise dominated (total time) | Noise dominated (detector-on time) | Marked lightcurve |
|---|---|---|---|---|---|---|---|
| A | 8200 | 7592 | 3 | 3 | 0.04% | 0.04% | 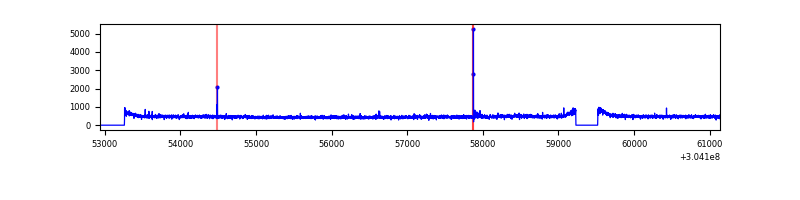 |
| B | 8200 | 7592 | 14 | 14 | 0.17% | 0.18% | 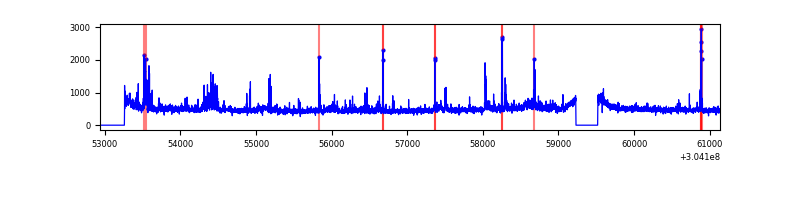 |
| C | 8200 | 7592 | 0 | 0 | 0.00% | 0.00% | 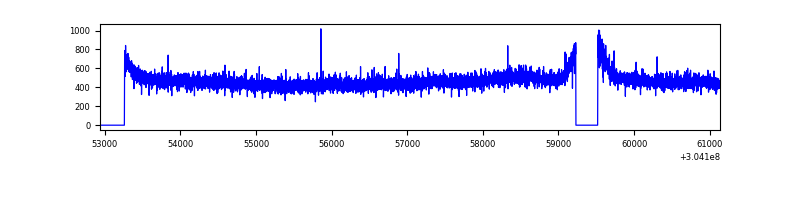 |
| D | 8201 | 7593 | 130 | 130 | 1.59% | 1.71% |  |
Top three noisy pixels from each quadrant. If the there are fewer than three noisy pixels in the level2.evt file, extra rows are filled as -1
| Pixel properties | Quadrant properties | ||||||
|---|---|---|---|---|---|---|---|
| Quadrant | DetID | PixID | Counts | Sigma | Mean | Median | Sigma |
| A | 12 | 96 | 20804 | 107.49 | 914 | 893 | 185.2 |
| A | 13 | 254 | 10945 | 54.27 | 914 | 893 | 185.2 |
| A | 15 | 192 | 8643 | 41.84 | 914 | 893 | 185.2 |
| B | 0 | 219 | 111538 | 639.62 | 907 | 885 | 173.0 |
| B | 0 | 230 | 81515 | 466.08 | 907 | 885 | 173.0 |
| B | 10 | 247 | 62892 | 358.43 | 907 | 885 | 173.0 |
| C | 14 | 238 | 134926 | 655.47 | 871 | 874 | 204.5 |
| C | 13 | 61 | 6019 | 25.16 | 871 | 874 | 204.5 |
| C | 8 | 128 | 5570 | 22.96 | 871 | 874 | 204.5 |
| D | 1 | 239 | 1506739 | 7000.61 | 883 | 860 | 215.1 |
| D | 9 | 1 | 207939 | 962.68 | 883 | 860 | 215.1 |
| D | 1 | 52 | 162024 | 749.23 | 883 | 860 | 215.1 |
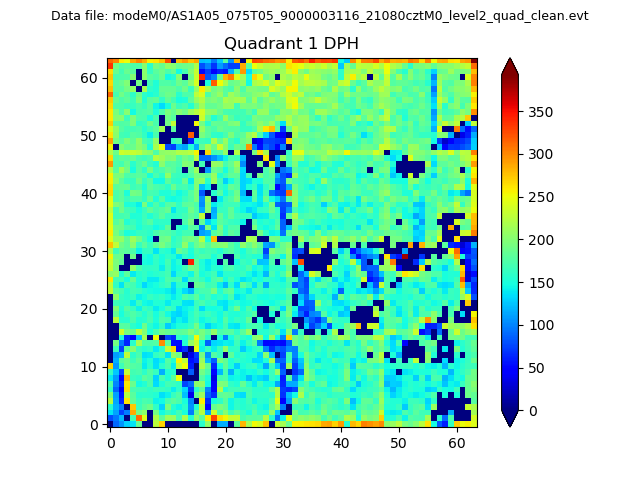
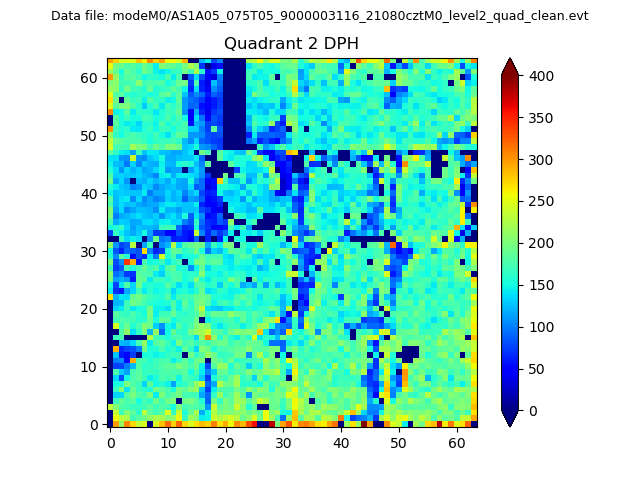
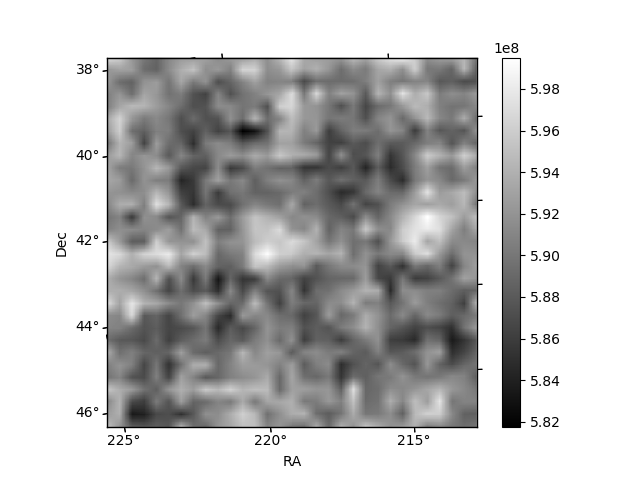
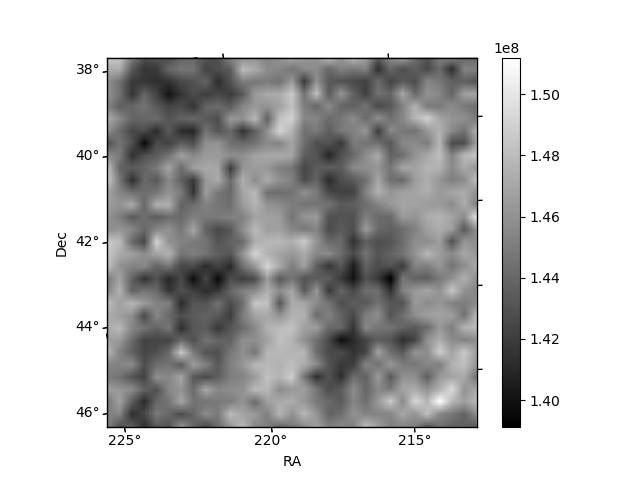
Histogram calculated using DETX and DETY for each event in the final _common_clean file
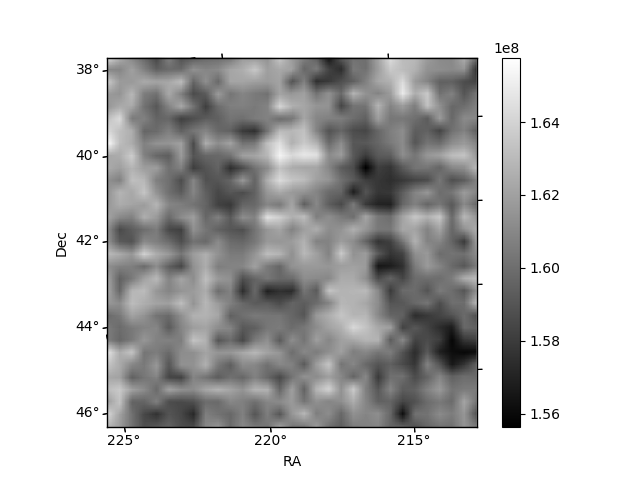
| Quadrant A | 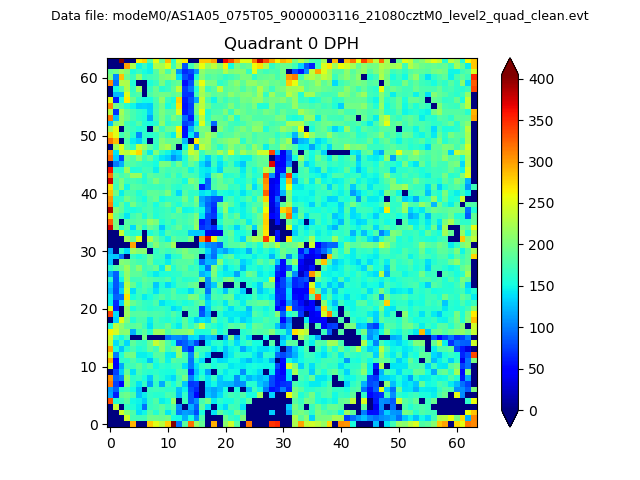 |
 |
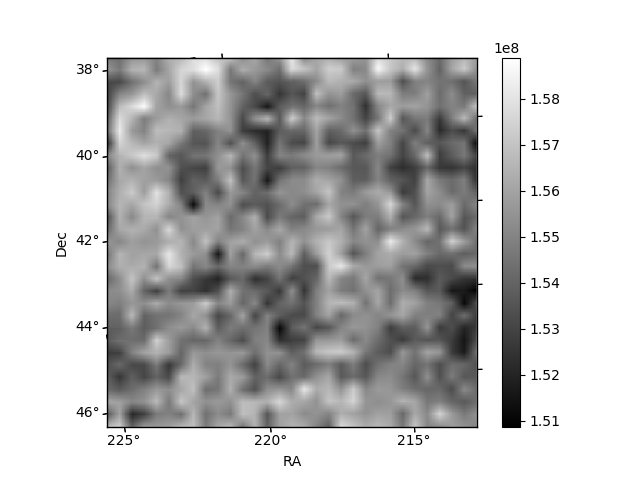
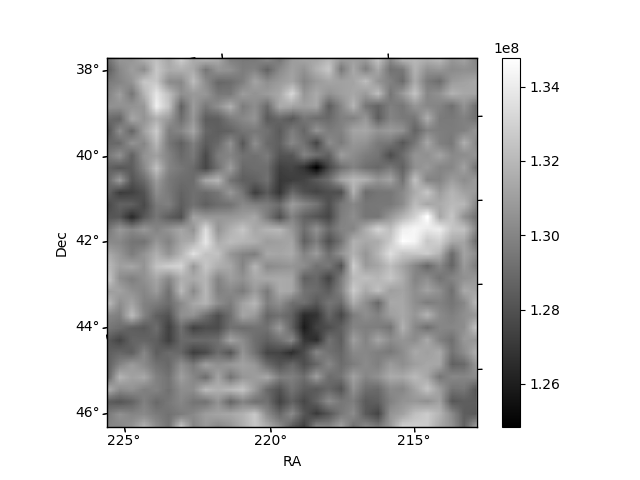
Quadrant B |
|---|---|---|---|
| Quadrant D | 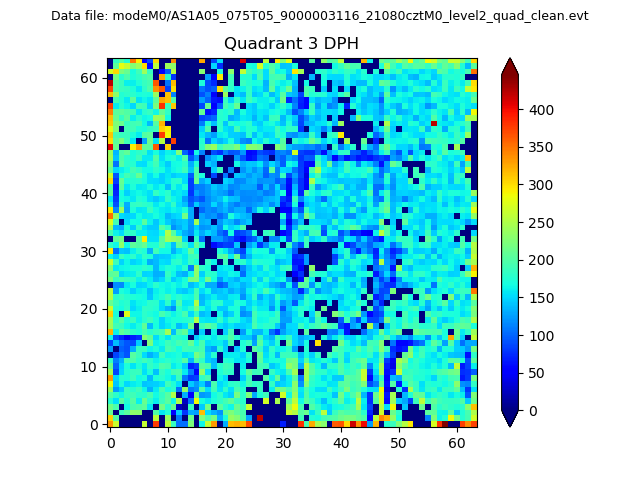 |
 |
Quadrant C |
| Plot type | Count rate plots | Images |
|---|---|---|
| Comparison with Poisson distribution Blue bars denote a histogram of data divided into 1 sec bins. Red curve is a Poisson curve with rate = median count rate of data. |
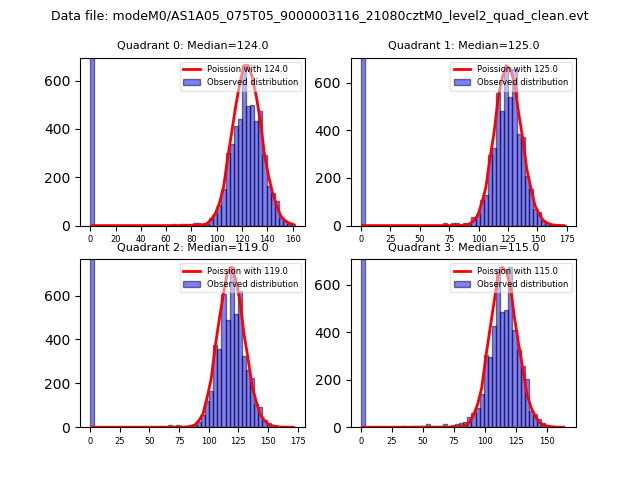 |
 |
| Quadrant-wise count rates Data is divided into 100 sec bins |
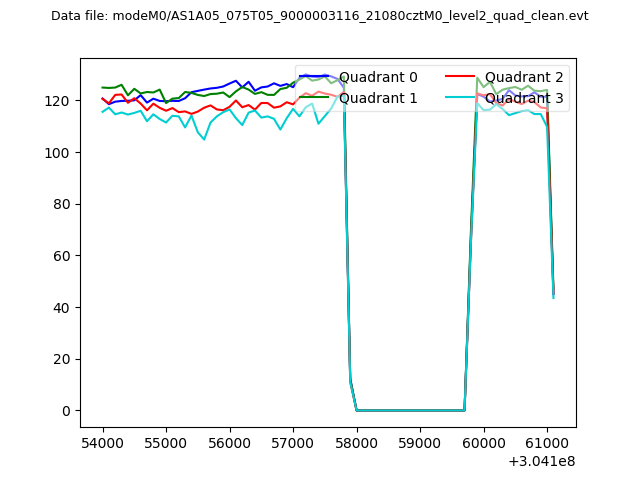 |
|
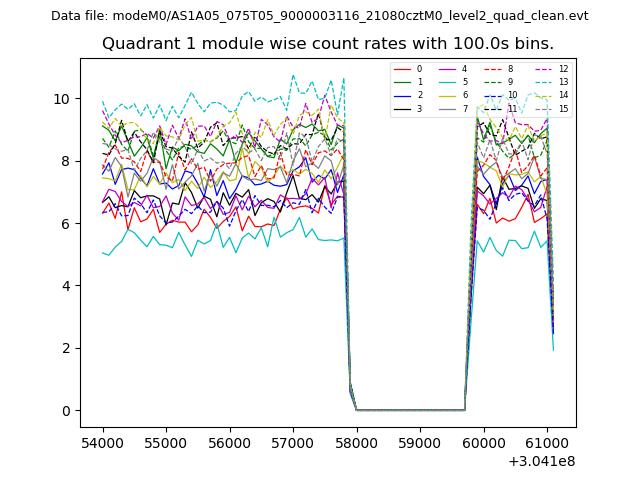
| Module-wise count rates for Quadrant A Data is divided into 100 sec bins |
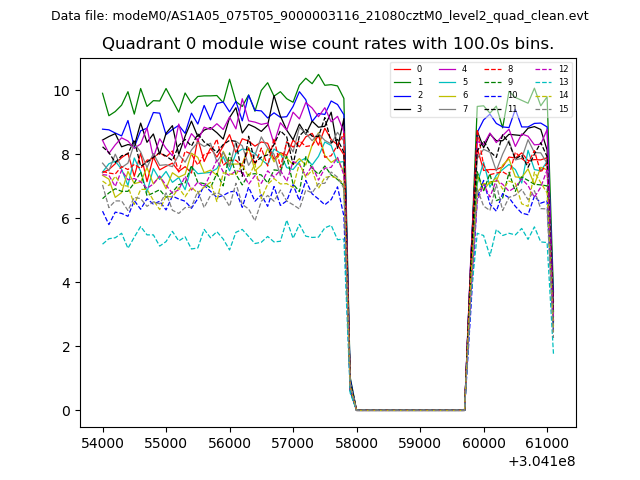 |
 |
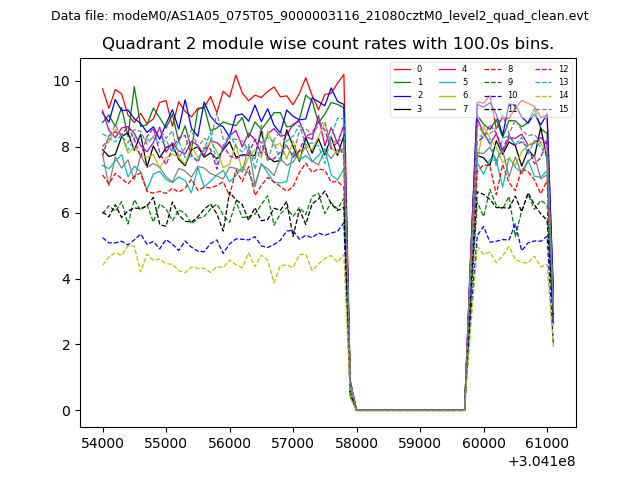
| Module-wise count rates for Quadrant B Data is divided into 100 sec bins |
 |
 |
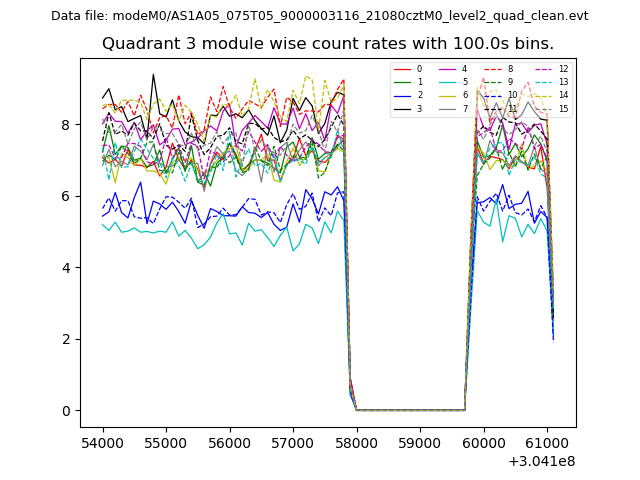
| Module-wise count rates for Quadrant C Data is divided into 100 sec bins |
 |
 |
| Module-wise count rates for Quadrant D Data is divided into 100 sec bins |
 |
 |
| Parameter | Plot |
|---|---|
| CZT HV Monitor | 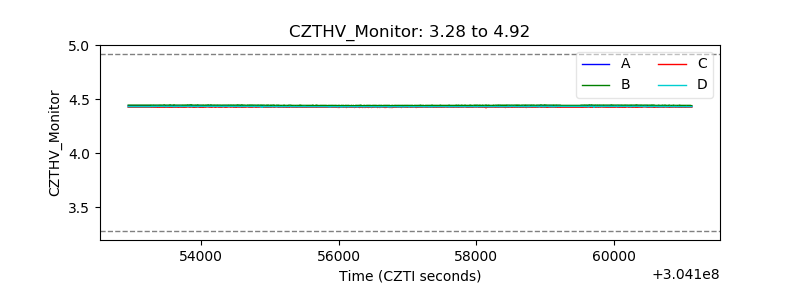 |
| D_VDD |  |
| Temperature 1 | 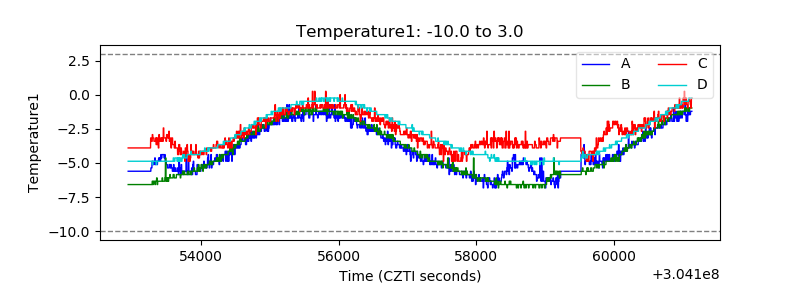 |
| Veto HV Monitor | 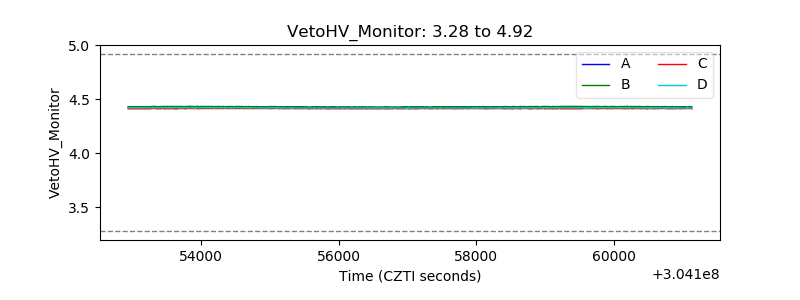 |
| Veto LLD | 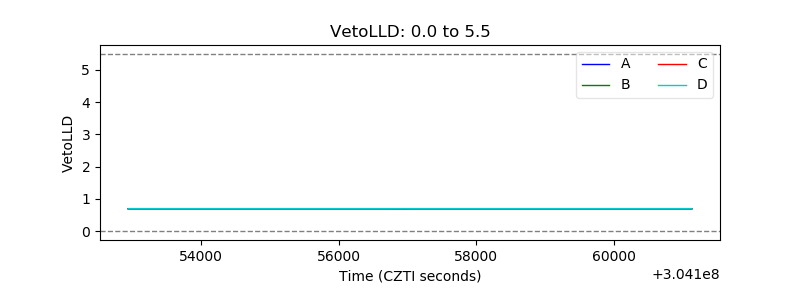 |
| Alpha Counter | 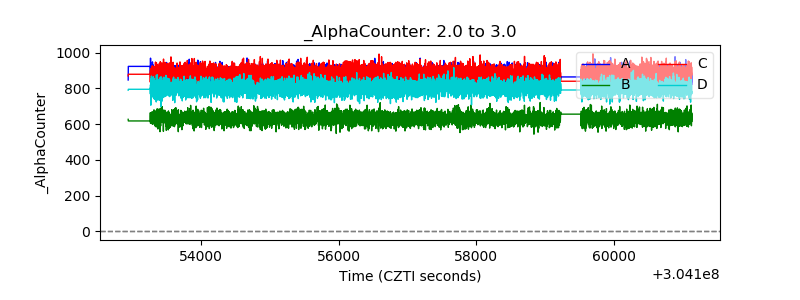 |
| _CPM_Rate | 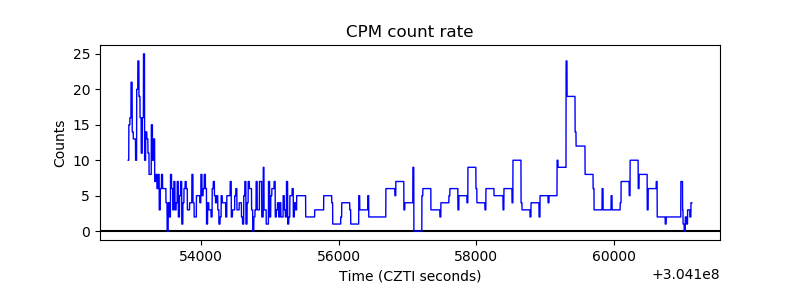 |
| CZT Counter | 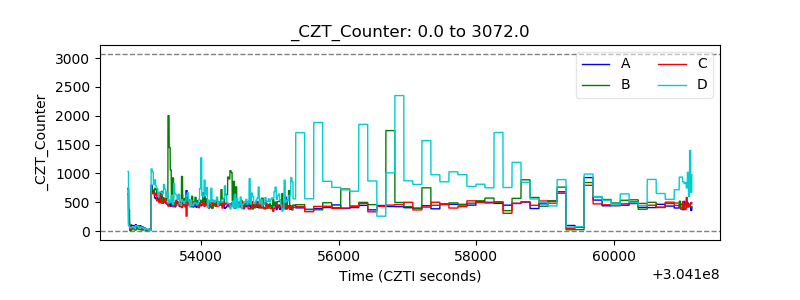 |
| +2.5 Volts monitor |  |
| +5 Volts monitor |  |
| _ROLL_ROT | 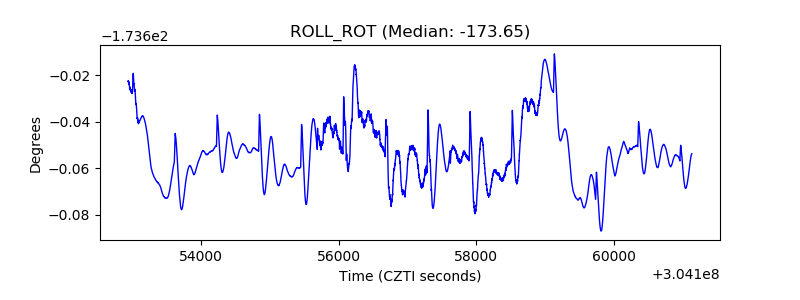 |
| _Roll_DEC | 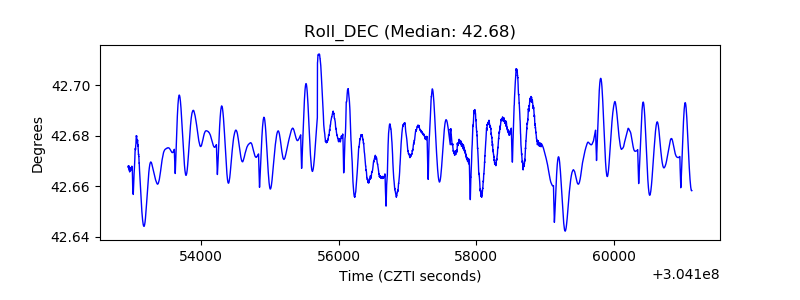 |
| _Roll_RA | 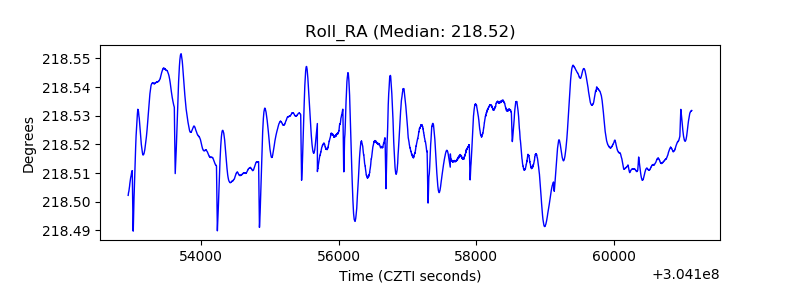 |
| Veto Counter | 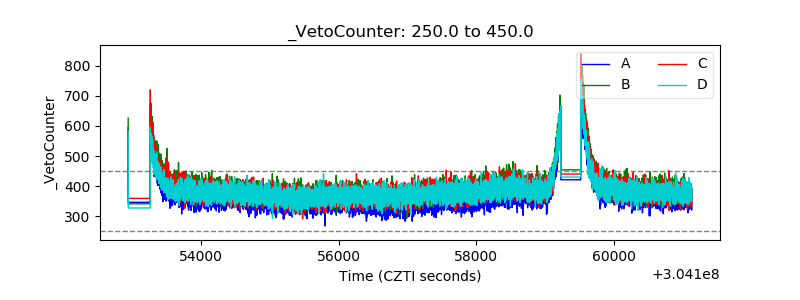 |