| Param | Original file | Final file |
|---|---|---|
| Filename | modeM0/AS1A05_075T05_9000003116_21084cztM0_level2.evt | modeM0/AS1A05_075T05_9000003116_21084cztM0_level2_quad_clean.evt |
| Size (bytes) | 126,993,600 | 25,174,080 |
| Size | 121.1 MB | 24.0 MB |
| Events in quadrant A | 636,521 | 174,924 |
| Events in quadrant B | 775,973 | 172,844 |
| Events in quadrant C | 614,300 | 165,621 |
| Events in quadrant D | 1,723,368 | 145,985 |
| Mode SS | |||
|---|---|---|---|
| Quadrant | BADHDUFLAG | Total packets | Discarded packets |
| A | 0 | 28 | 0 |
| B | 0 | 28 | 0 |
| C | 0 | 28 | 0 |
| D | 0 | 28 | 0 |
| Mode M0 | |||
|---|---|---|---|
| Quadrant | BADHDUFLAG | Total packets | Discarded packets |
| A | 0 | 2798 | 0 |
| B | 0 | 3249 | 0 |
| C | 0 | 2745 | 0 |
| D | 0 | 6058 | 0 |
| Quadrant | Total seconds | Saturated seconds | Saturation percentage |
|---|---|---|---|
| A | 1369 | 3 | 0.219138% |
| B | 1369 | 29 | 2.118335% |
| C | 1369 | 2 | 0.146092% |
| D | 1370 | 303 | 22.116788% |
Noise dominated data is calculated using 1-second bins in cleaned event files. If a bin has >2000 counts, and if more than 50% of those come from <1% of pixels, then it is considered to be noise-dominated and hence unusable.
| Quadrant | # 1 sec bins | Bins with >0 counts | Bins with >2000 counts | High rate bins dominated by noise | Noise dominated (total time) | Noise dominated (detector-on time) | Marked lightcurve |
|---|---|---|---|---|---|---|---|
| A | 1369 | 1369 | 2 | 2 | 0.15% | 0.15% | 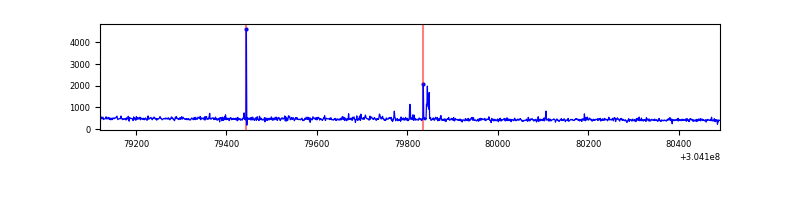 |
| B | 1369 | 1369 | 14 | 14 | 1.02% | 1.02% | 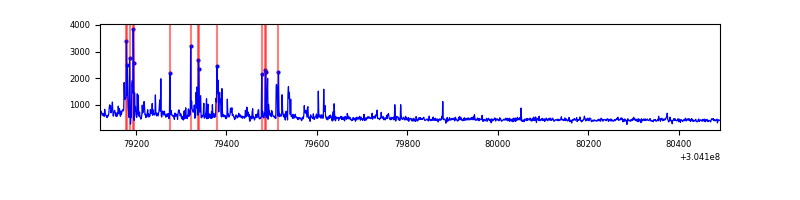 |
| C | 1369 | 1369 | 0 | 0 | 0.00% | 0.00% | 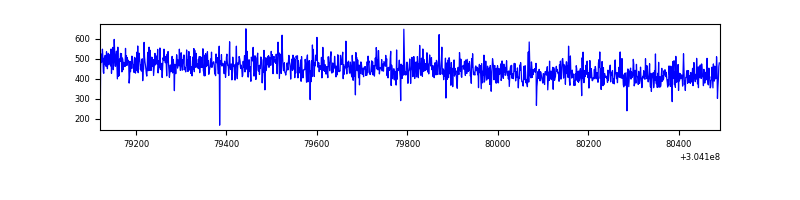 |
| D | 1370 | 1370 | 266 | 266 | 19.42% | 19.42% | 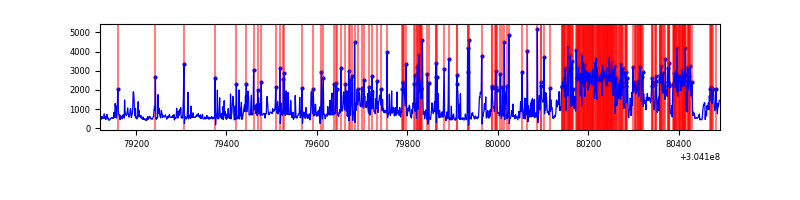 |
Top three noisy pixels from each quadrant. If the there are fewer than three noisy pixels in the level2.evt file, extra rows are filled as -1
| Pixel properties | Quadrant properties | ||||||
|---|---|---|---|---|---|---|---|
| Quadrant | DetID | PixID | Counts | Sigma | Mean | Median | Sigma |
| A | 15 | 192 | 23599 | 700.12 | 157 | 153 | 33.5 |
| A | 13 | 254 | 2170 | 60.23 | 157 | 153 | 33.5 |
| A | 3 | 1 | 1948 | 53.6 | 157 | 153 | 33.5 |
| B | 7 | 220 | 134625 | 4285.33 | 154 | 151 | 31.4 |
| B | 0 | 190 | 16167 | 510.39 | 154 | 151 | 31.4 |
| B | 0 | 219 | 8501 | 266.09 | 154 | 151 | 31.4 |
| C | 14 | 238 | 22838 | 606.98 | 151 | 151 | 37.4 |
| C | 13 | 61 | 1048 | 24.0 | 151 | 151 | 37.4 |
| C | 7 | 247 | 390 | 6.39 | 151 | 151 | 37.4 |
| D | 2 | 14 | 541044 | 14924.64 | 143 | 139 | 36.2 |
| D | 1 | 239 | 342342 | 9442.06 | 143 | 139 | 36.2 |
| D | 1 | 52 | 217739 | 6004.02 | 143 | 139 | 36.2 |
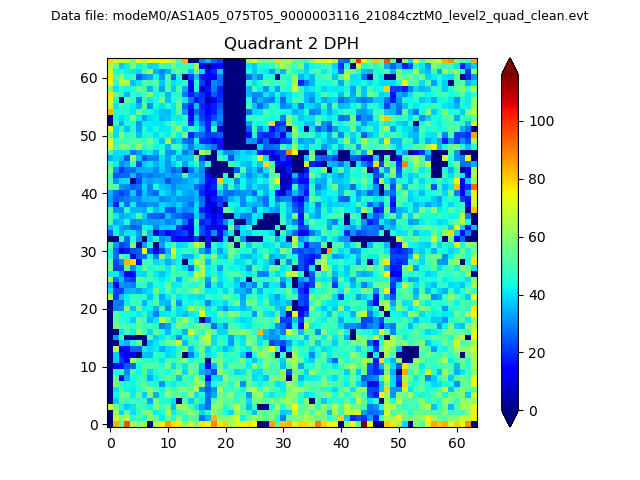
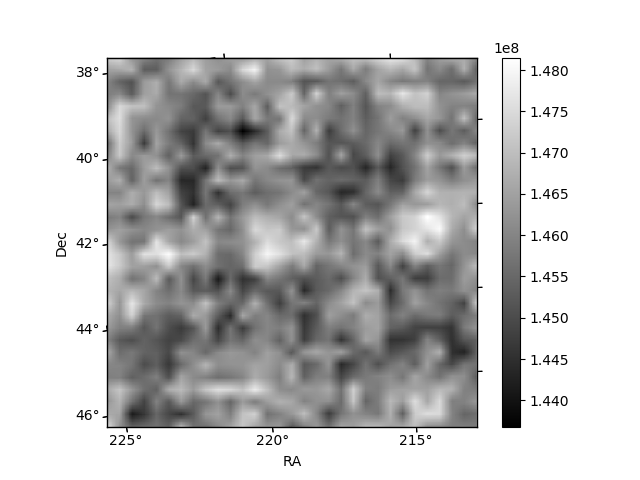
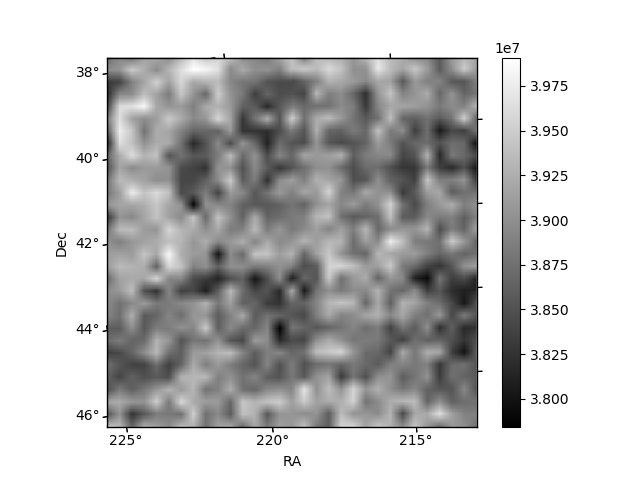
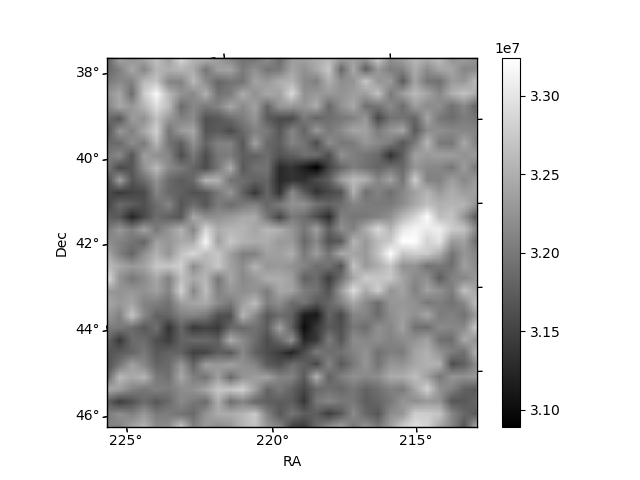
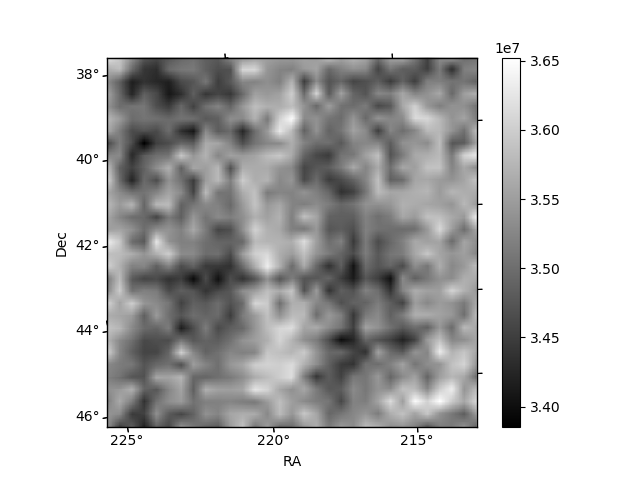
Histogram calculated using DETX and DETY for each event in the final _common_clean file
| Quadrant A | 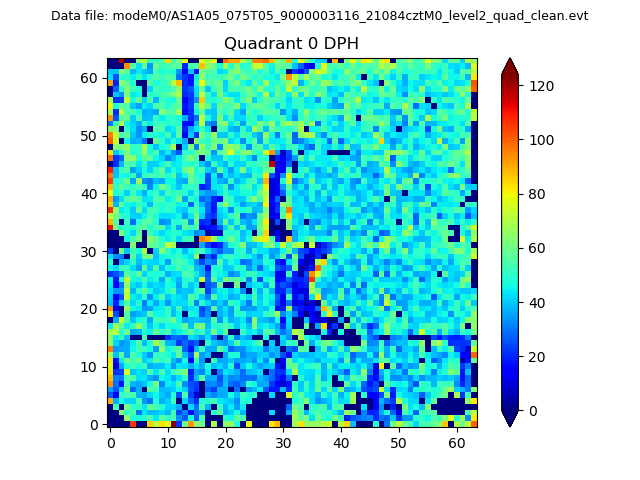 |
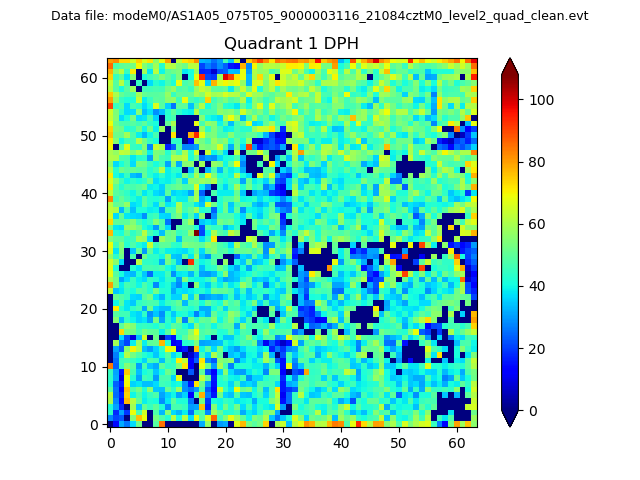 |
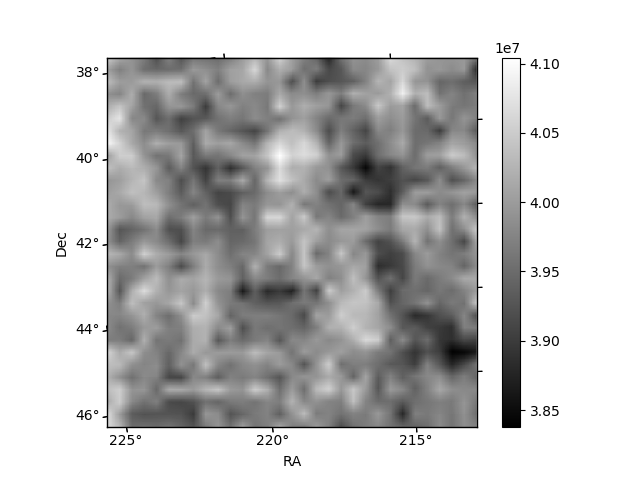
Quadrant B |
|---|---|---|---|
| Quadrant D | 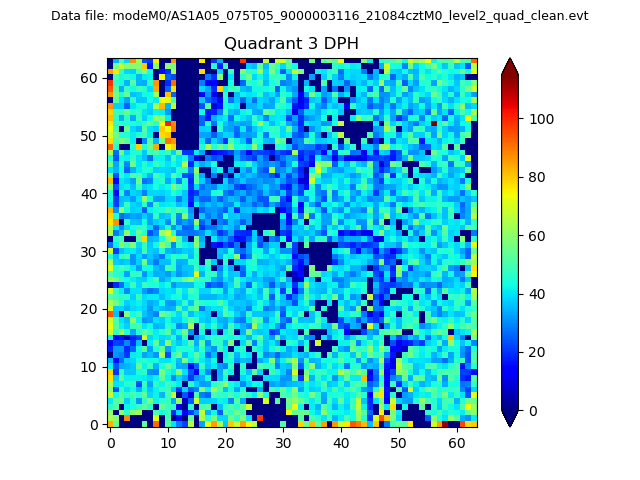 |
 |
Quadrant C |
| Plot type | Count rate plots | Images |
|---|---|---|
| Comparison with Poisson distribution Blue bars denote a histogram of data divided into 1 sec bins. Red curve is a Poisson curve with rate = median count rate of data. |
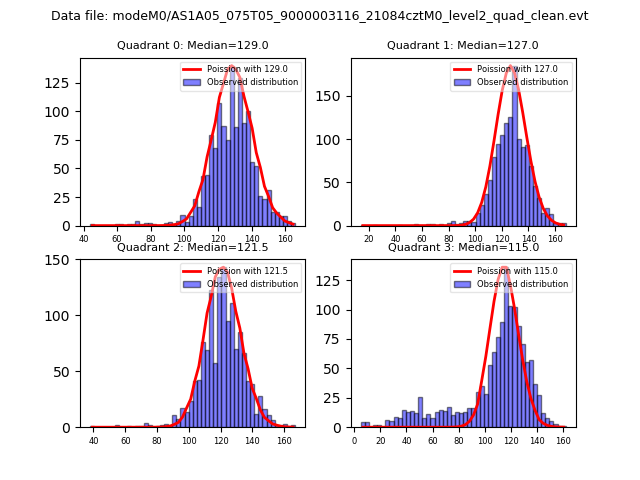 |
 |
| Quadrant-wise count rates Data is divided into 100 sec bins |
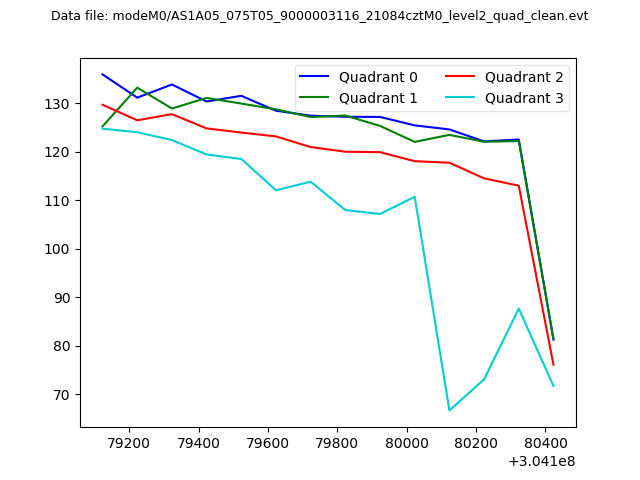 |
|
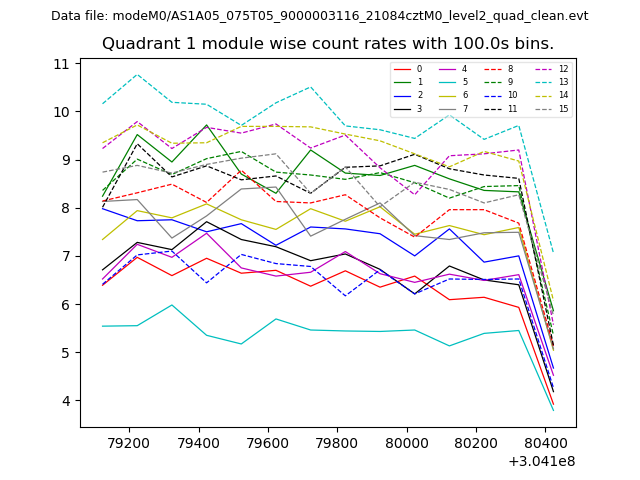
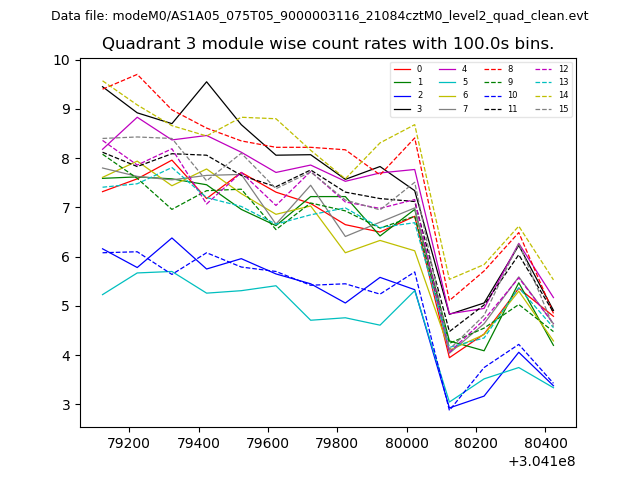
| Module-wise count rates for Quadrant A Data is divided into 100 sec bins |
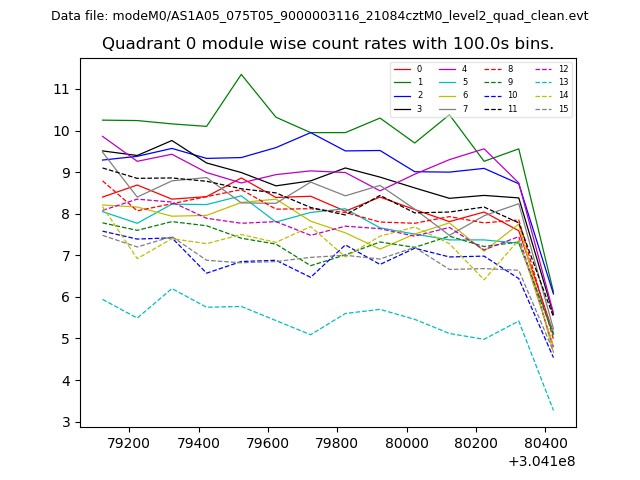 |
 |
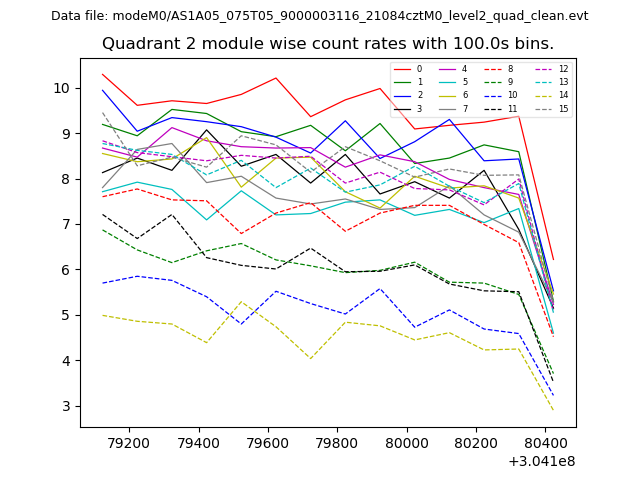
| Module-wise count rates for Quadrant B Data is divided into 100 sec bins |
 |
 |
| Module-wise count rates for Quadrant C Data is divided into 100 sec bins |
 |
 |
| Module-wise count rates for Quadrant D Data is divided into 100 sec bins |
 |
 |
| Parameter | Plot |
|---|---|
| CZT HV Monitor | 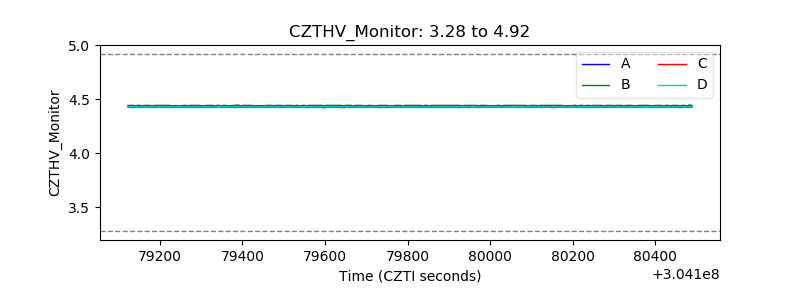 |
| D_VDD | 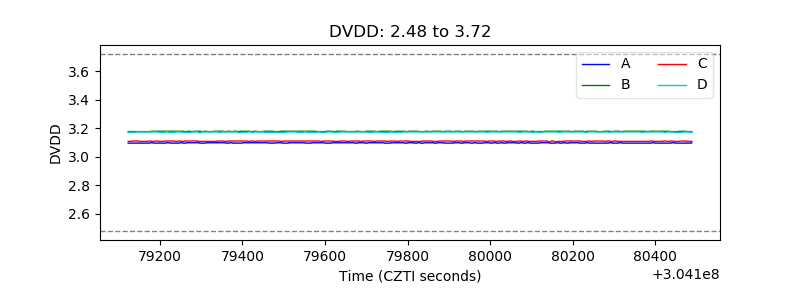 |
| Temperature 1 | 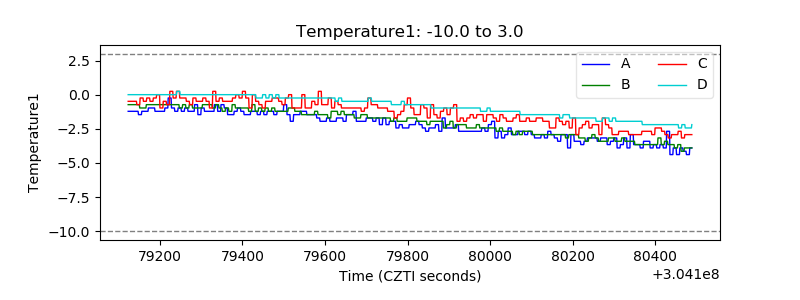 |
| Veto HV Monitor | 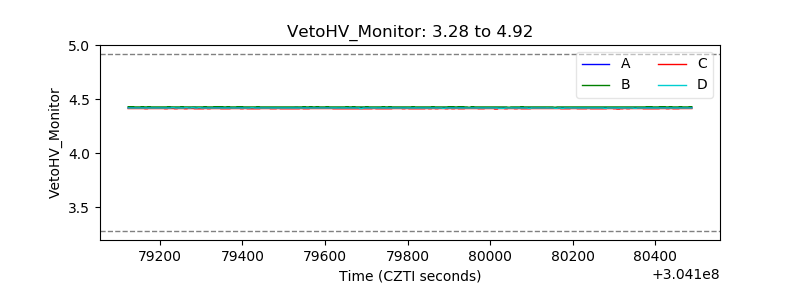 |
| Veto LLD | 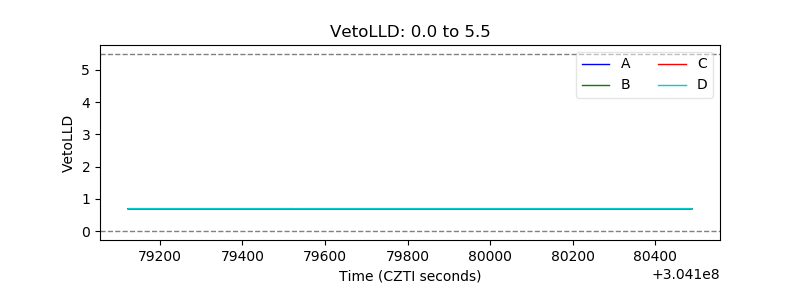 |
| Alpha Counter | 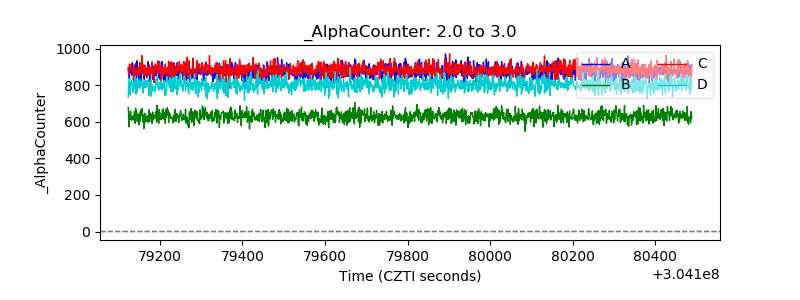 |
| _CPM_Rate | 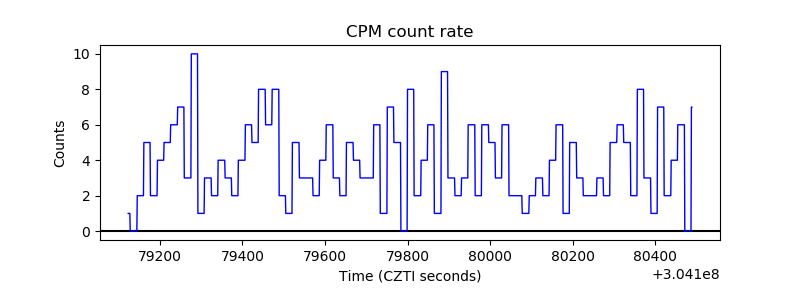 |
| CZT Counter | 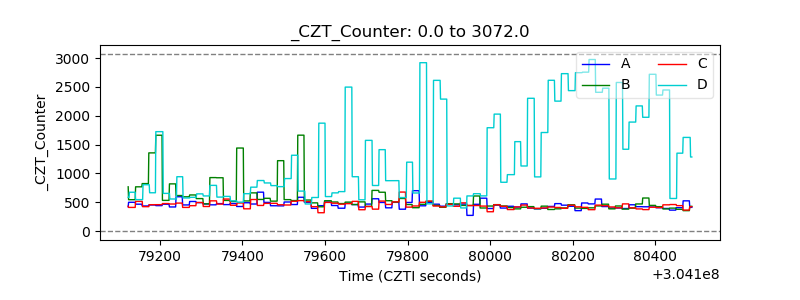 |
| +2.5 Volts monitor |  |
| +5 Volts monitor | 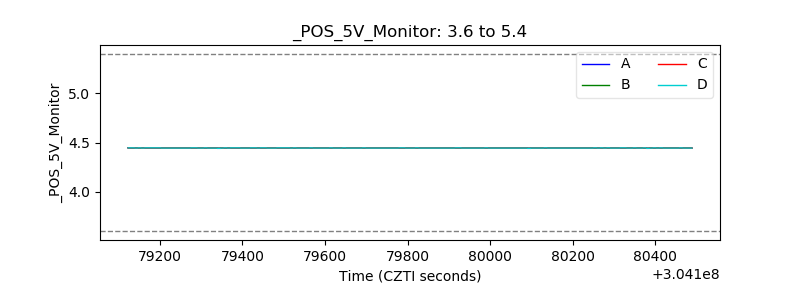 |
| _ROLL_ROT | 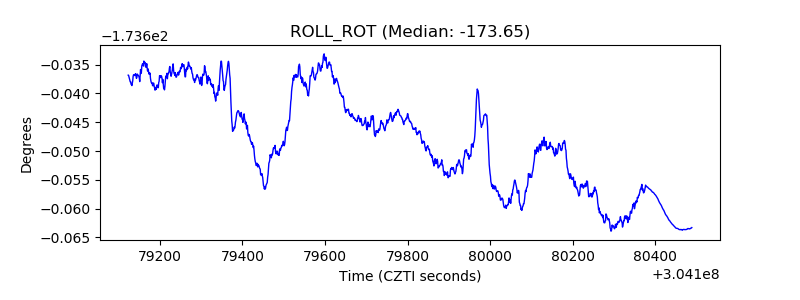 |
| _Roll_DEC |  |
| _Roll_RA | 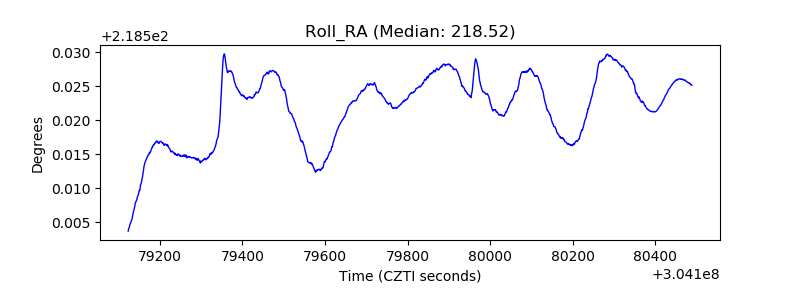 |
| Veto Counter |  |