| Param | Original file | Final file |
|---|---|---|
| Filename | modeM0/AS1A05_155T04_9000003114cztM0_level2.fits | modeM0/AS1A05_155T04_9000003114cztM0_level2_quad_clean.evt |
| Size (bytes) | 423,331,200 | 437,725,440 |
| Size | 403.7 MB | 417.4 MB |
| Events in quadrant A | 2,576,418 | 2,684,010 |
| Events in quadrant B | 2,465,438 | 2,650,495 |
| Events in quadrant C | 2,520,888 | 2,537,079 |
| Events in quadrant D | 2,189,846 | 2,317,709 |
| Mode M0 | |||
|---|---|---|---|
| Quadrant | BADHDUFLAG | Total packets | Discarded packets |
| A | 0 | 91751 | 0 |
| B | 0 | 100833 | 0 |
| C | 0 | 91737 | 0 |
| D | 0 | 107060 | 0 |
| Mode M9 | |||
|---|---|---|---|
| Quadrant | BADHDUFLAG | Total packets | Discarded packets |
| A | 0 | 53 | 0 |
| B | 0 | 53 | 0 |
| C | 0 | 53 | 0 |
| D | 0 | 53 | 0 |
| Mode SS | |||
|---|---|---|---|
| Quadrant | BADHDUFLAG | Total packets | Discarded packets |
| A | 0 | 908 | 0 |
| B | 0 | 908 | 0 |
| C | 0 | 908 | 0 |
| D | 0 | 908 | 0 |
| Quadrant | Total seconds | Saturated seconds | Saturation percentage |
|---|---|---|---|
| A | 44694 | 627 | 1.402873% |
| B | 44694 | 1188 | 2.658075% |
| C | 44694 | 740 | 1.655703% |
| D | 44694 | 1257 | 2.812458% |
Noise dominated data is calculated using 1-second bins in cleaned event files. If a bin has >2000 counts, and if more than 50% of those come from <1% of pixels, then it is considered to be noise-dominated and hence unusable.
| Quadrant | # 1 sec bins | Bins with >0 counts | Bins with >2000 counts | High rate bins dominated by noise | Noise dominated (total time) | Noise dominated (detector-on time) | Marked lightcurve |
|---|---|---|---|---|---|---|---|
| A | 49869 | 44694 | 0 | 0 | 0.00% | 0.00% | 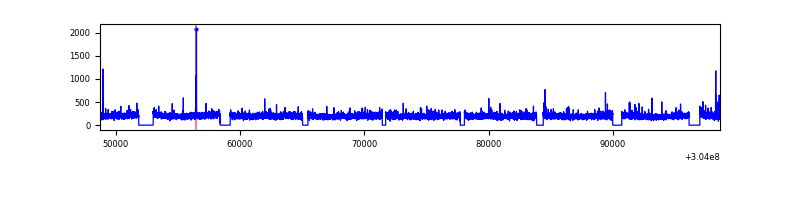 |
| B | 49869 | 44690 | 0 | 0 | 0.00% | 0.00% |  |
| C | 49869 | 44694 | 0 | 0 | 0.00% | 0.00% |  |
| D | 49869 | 44690 | 0 | 0 | 0.00% | 0.00% |  |
Top three noisy pixels from each quadrant. If the there are fewer than three noisy pixels in the level2.evt file, extra rows are filled as -1
| Pixel properties | Quadrant properties | ||||||
|---|---|---|---|---|---|---|---|
| Quadrant | DetID | PixID | Counts | Sigma | Mean | Median | Sigma |
| A | 0 | 29 | 2384 | 10.48 | 670 | 628 | 167.5 |
| A | 7 | 110 | 2103 | 8.81 | 670 | 628 | 167.5 |
| A | 0 | 30 | 1944 | 7.86 | 670 | 628 | 167.5 |
| B | 2 | 9 | 1938 | 10.09 | 651 | 618 | 130.7 |
| B | 2 | 8 | 1689 | 8.19 | 651 | 618 | 130.7 |
| B | 3 | 17 | 1686 | 8.16 | 651 | 618 | 130.7 |
| C | 12 | 241 | 1838 | 7.11 | 665 | 619 | 171.4 |
| C | 2 | 191 | 1747 | 6.58 | 665 | 619 | 171.4 |
| C | 9 | 209 | 1744 | 6.56 | 665 | 619 | 171.4 |
| D | 6 | 231 | 1575 | 5.99 | 625 | 568 | 168.1 |
| D | 10 | 113 | 1531 | 5.73 | 625 | 568 | 168.1 |
| D | 10 | 189 | 1526 | 5.7 | 625 | 568 | 168.1 |
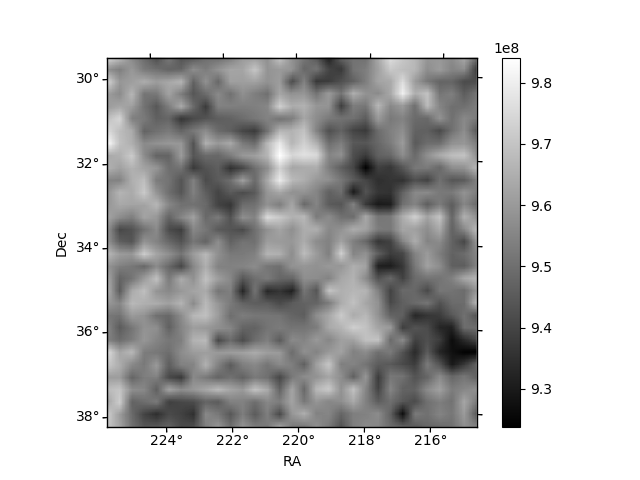
Histogram calculated using DETX and DETY for each event in the final _common_clean file
| Quadrant A | 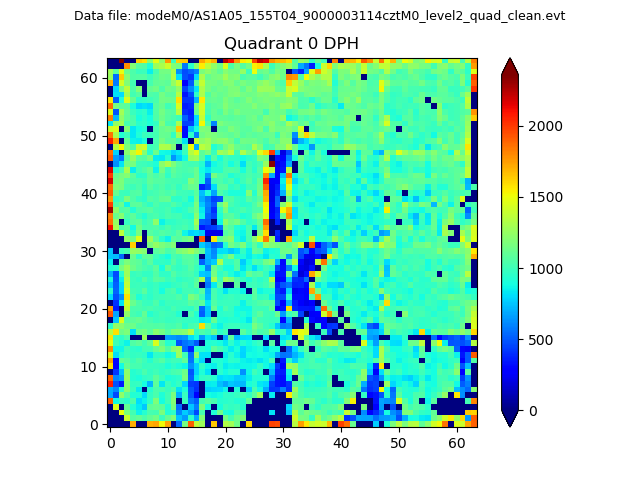 |
 |
Quadrant B |
|---|---|---|---|
| Quadrant D |  |
 |
Quadrant C |
| Plot type | Count rate plots | Images |
|---|---|---|
| Comparison with Poisson distribution Blue bars denote a histogram of data divided into 1 sec bins. Red curve is a Poisson curve with rate = median count rate of data. |
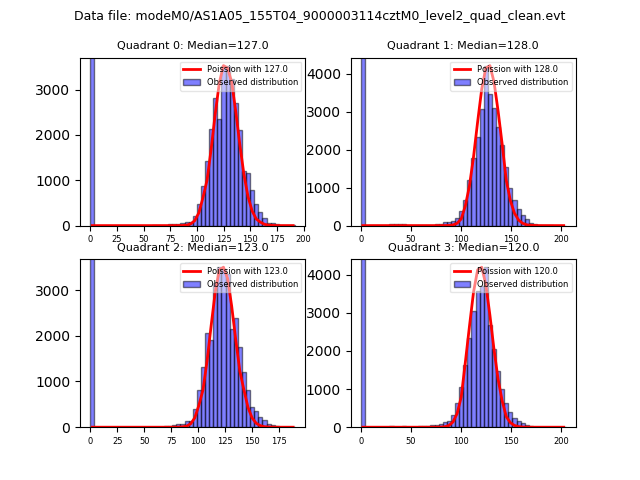 |
 |
| Quadrant-wise count rates Data is divided into 100 sec bins |
 |
|
| Module-wise count rates for Quadrant A Data is divided into 100 sec bins |
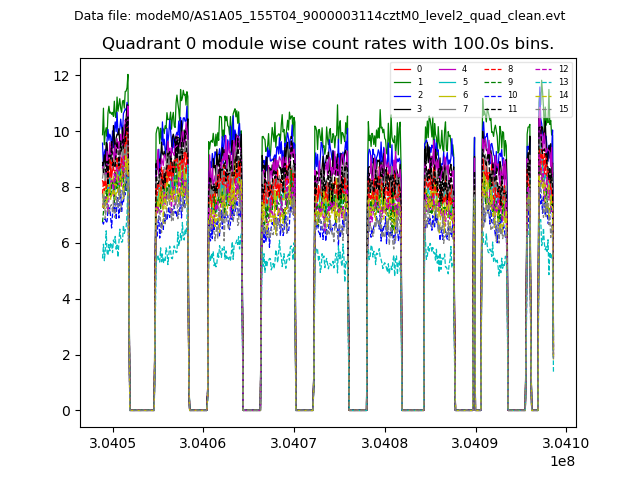 |
 |
| Module-wise count rates for Quadrant B Data is divided into 100 sec bins |
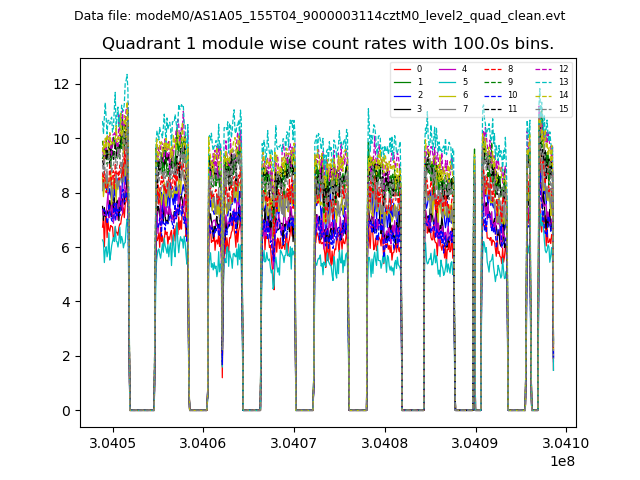 |
 |
| Module-wise count rates for Quadrant C Data is divided into 100 sec bins |
 |
 |
| Module-wise count rates for Quadrant D Data is divided into 100 sec bins |
 |
 |
| Parameter | Plot |
|---|---|
| CZT HV Monitor |  |
| D_VDD |  |
| Temperature 1 |  |
| Veto HV Monitor |  |
| Veto LLD |  |
| Alpha Counter |  |
| _CPM_Rate | 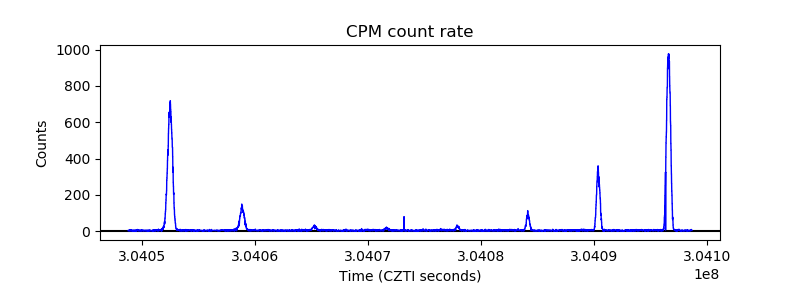 |
| CZT Counter | 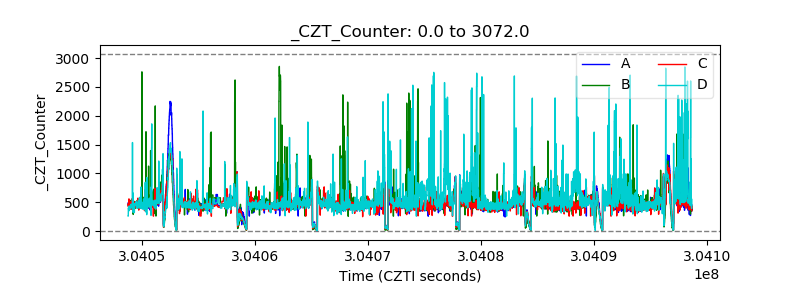 |
| +2.5 Volts monitor |  |
| +5 Volts monitor |  |
| _ROLL_ROT |  |
| _Roll_DEC |  |
| _Roll_RA |  |
| Veto Counter |  |