| Param | Original file | Final file |
|---|---|---|
| Filename | modeM0/AS1A05_155T04_9000003114_21062cztM0_level2.evt | modeM0/AS1A05_155T04_9000003114_21062cztM0_level2_quad_clean.evt |
| Size (bytes) | 316,797,120 | 63,809,280 |
| Size | 302.1 MB | 60.9 MB |
| Events in quadrant A | 2,244,859 | 406,846 |
| Events in quadrant B | 2,408,753 | 415,194 |
| Events in quadrant C | 2,268,007 | 399,893 |
| Events in quadrant D | 2,362,196 | 390,259 |
| Mode M0 | |||
|---|---|---|---|
| Quadrant | BADHDUFLAG | Total packets | Discarded packets |
| A | 0 | 9492 | 1 |
| B | 0 | 9902 | 1 |
| C | 0 | 9512 | 1 |
| D | 0 | 10040 | 1 |
| Mode M9 | |||
|---|---|---|---|
| Quadrant | BADHDUFLAG | Total packets | Discarded packets |
| A | 0 | 12 | 0 |
| B | 0 | 12 | 0 |
| C | 0 | 12 | 0 |
| D | 0 | 12 | 0 |
| Mode SS | |||
|---|---|---|---|
| Quadrant | BADHDUFLAG | Total packets | Discarded packets |
| A | 0 | 92 | 0 |
| B | 0 | 92 | 0 |
| C | 0 | 92 | 0 |
| D | 0 | 92 | 0 |
| Quadrant | Total seconds | Saturated seconds | Saturation percentage |
|---|---|---|---|
| A | 4554 | 77 | 1.690821% |
| B | 4553 | 106 | 2.328135% |
| C | 4553 | 94 | 2.064573% |
| D | 4553 | 55 | 1.207995% |
Noise dominated data is calculated using 1-second bins in cleaned event files. If a bin has >2000 counts, and if more than 50% of those come from <1% of pixels, then it is considered to be noise-dominated and hence unusable.
| Quadrant | # 1 sec bins | Bins with >0 counts | Bins with >2000 counts | High rate bins dominated by noise | Noise dominated (total time) | Noise dominated (detector-on time) | Marked lightcurve |
|---|---|---|---|---|---|---|---|
| A | 5724 | 4555 | 0 | 0 | 0.00% | 0.00% | 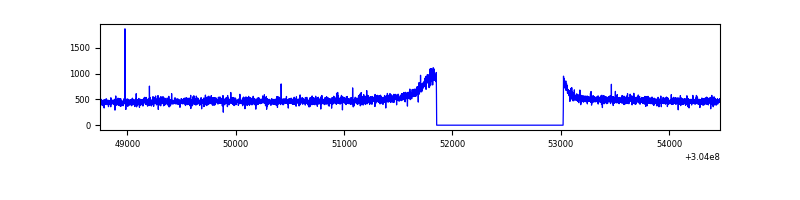 |
| B | 5723 | 4554 | 5 | 5 | 0.09% | 0.11% | 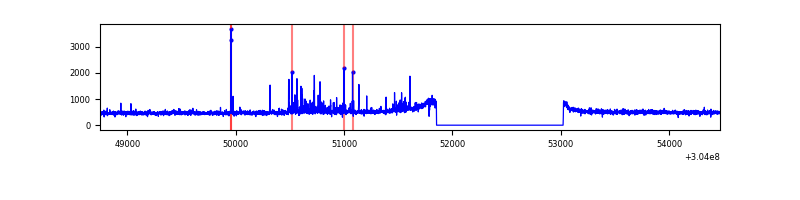 |
| C | 5723 | 4554 | 0 | 0 | 0.00% | 0.00% |  |
| D | 5723 | 4554 | 10 | 10 | 0.17% | 0.22% | 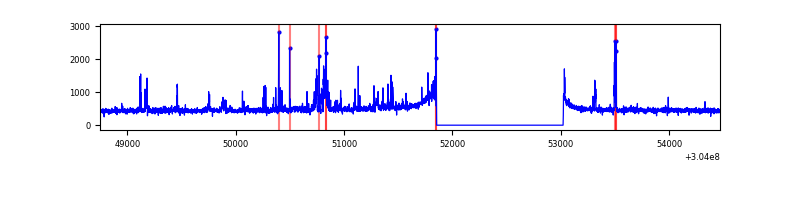 |
Top three noisy pixels from each quadrant. If the there are fewer than three noisy pixels in the level2.evt file, extra rows are filled as -1
| Pixel properties | Quadrant properties | ||||||
|---|---|---|---|---|---|---|---|
| Quadrant | DetID | PixID | Counts | Sigma | Mean | Median | Sigma |
| A | 13 | 254 | 5126 | 38.64 | 582 | 569 | 117.9 |
| A | 0 | 226 | 4934 | 37.01 | 582 | 569 | 117.9 |
| A | 3 | 137 | 4842 | 36.23 | 582 | 569 | 117.9 |
| B | 7 | 220 | 93242 | 830.47 | 581 | 566 | 111.6 |
| B | 3 | 64 | 14898 | 128.43 | 581 | 566 | 111.6 |
| B | 12 | 111 | 13118 | 112.48 | 581 | 566 | 111.6 |
| C | 14 | 238 | 87530 | 666.23 | 559 | 562 | 130.5 |
| C | 13 | 61 | 3908 | 25.63 | 559 | 562 | 130.5 |
| C | 3 | 202 | 1332 | 5.9 | 559 | 562 | 130.5 |
| D | 1 | 52 | 94081 | 693.03 | 566 | 552 | 135.0 |
| D | 12 | 233 | 66217 | 486.56 | 566 | 552 | 135.0 |
| D | 9 | 1 | 40401 | 295.27 | 566 | 552 | 135.0 |
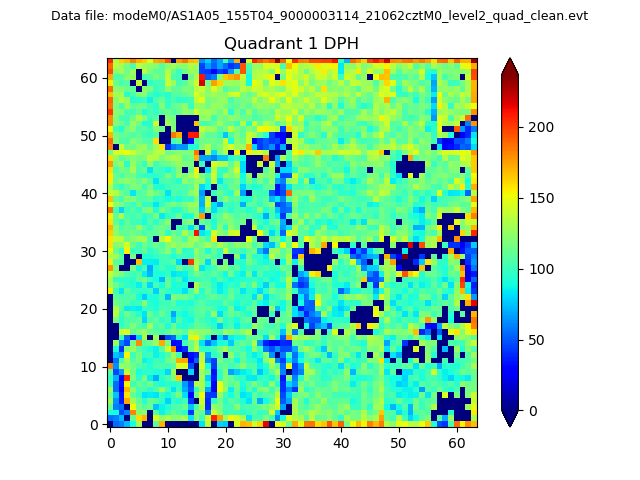
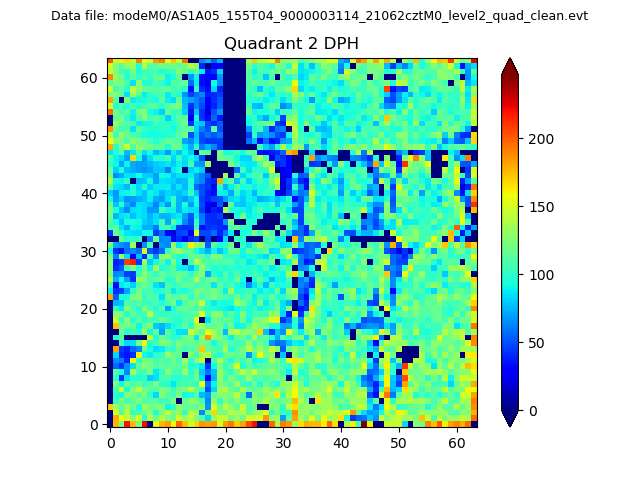
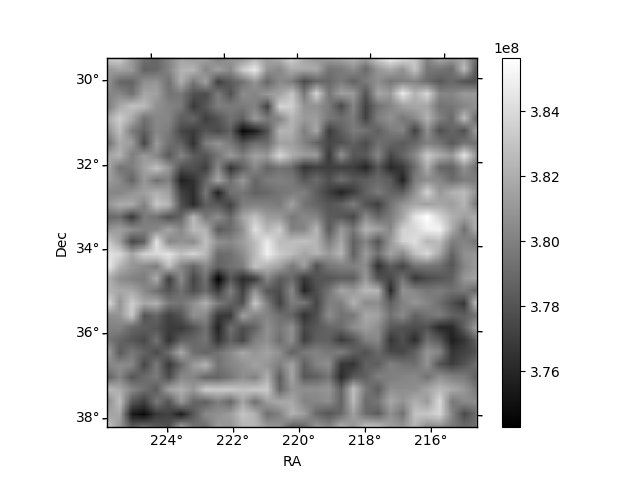
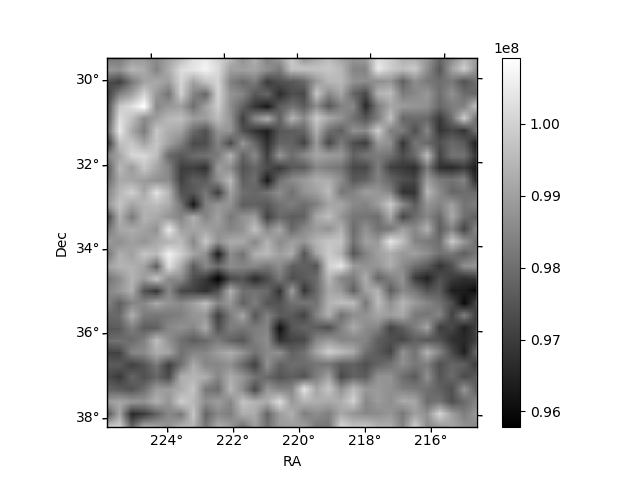
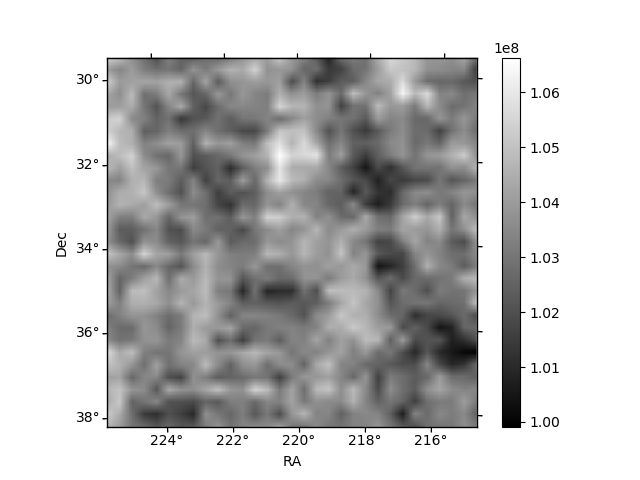
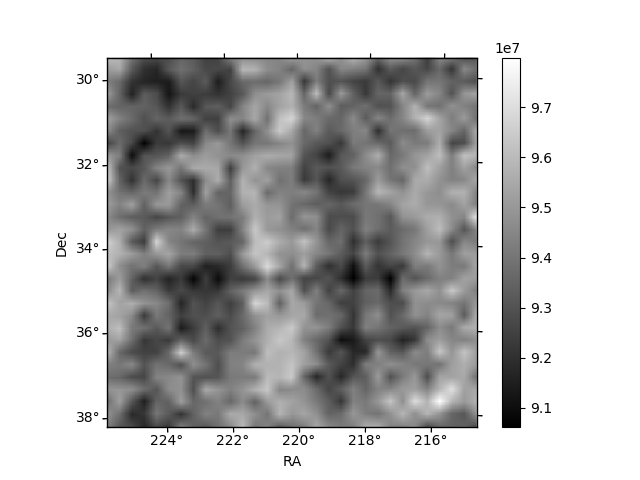
Histogram calculated using DETX and DETY for each event in the final _common_clean file
| Quadrant A | 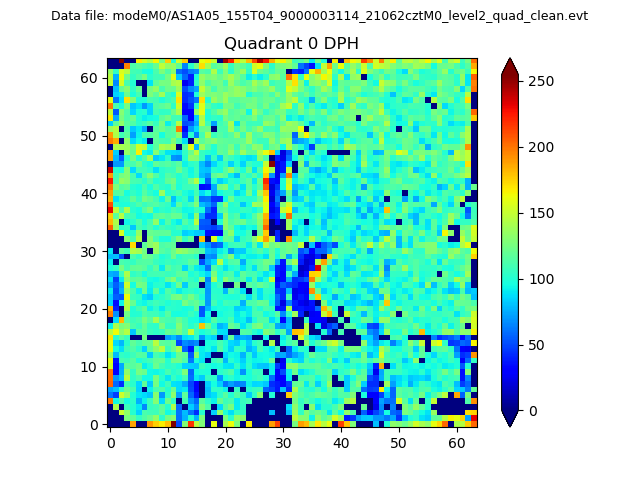 |
 |
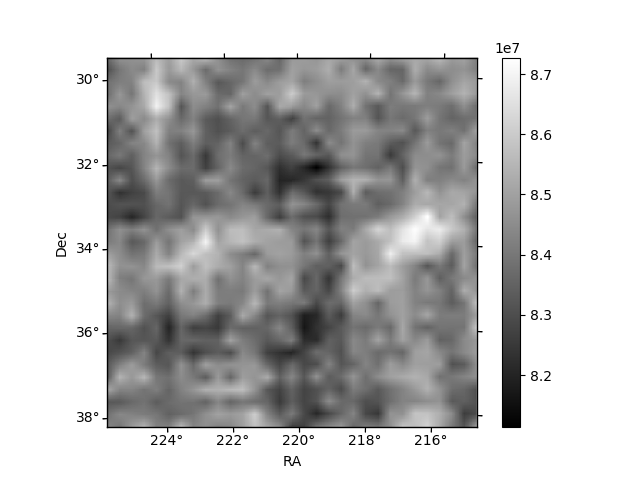
Quadrant B |
|---|---|---|---|
| Quadrant D | 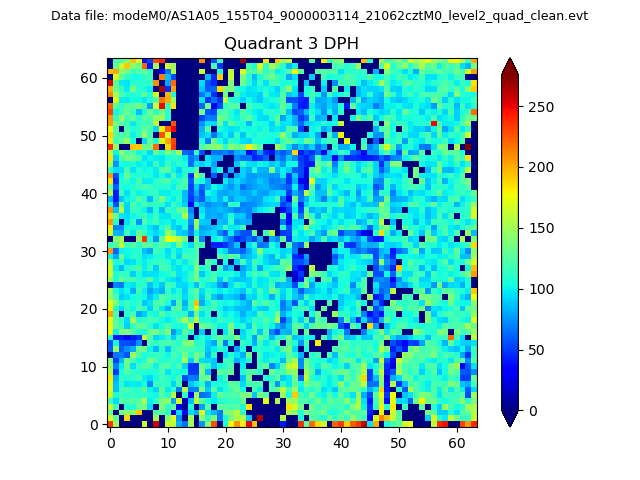 |
 |
Quadrant C |
| Plot type | Count rate plots | Images |
|---|---|---|
| Comparison with Poisson distribution Blue bars denote a histogram of data divided into 1 sec bins. Red curve is a Poisson curve with rate = median count rate of data. |
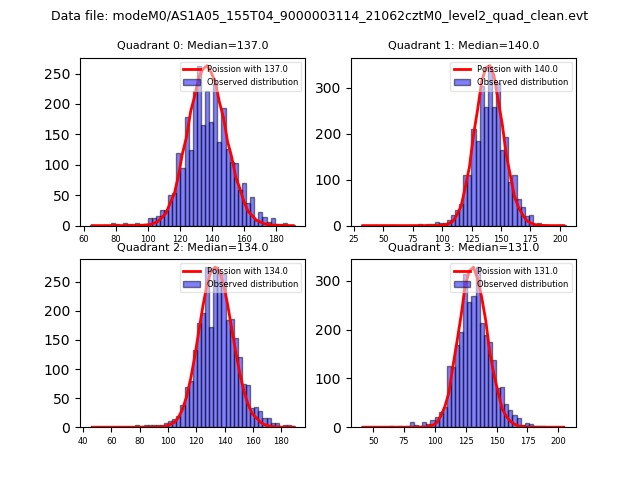 |
 |
| Quadrant-wise count rates Data is divided into 100 sec bins |
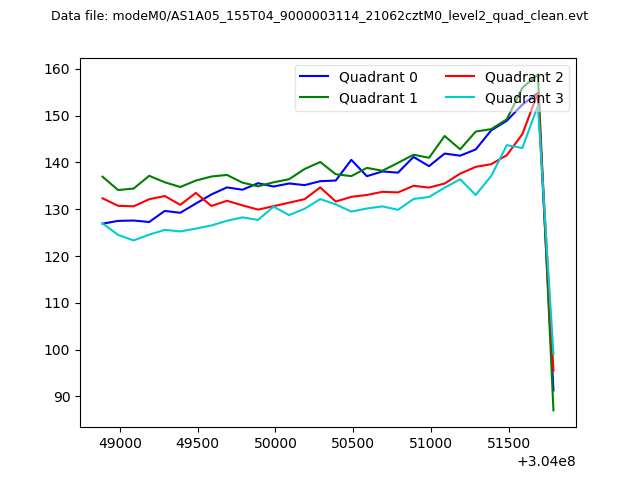 |
|
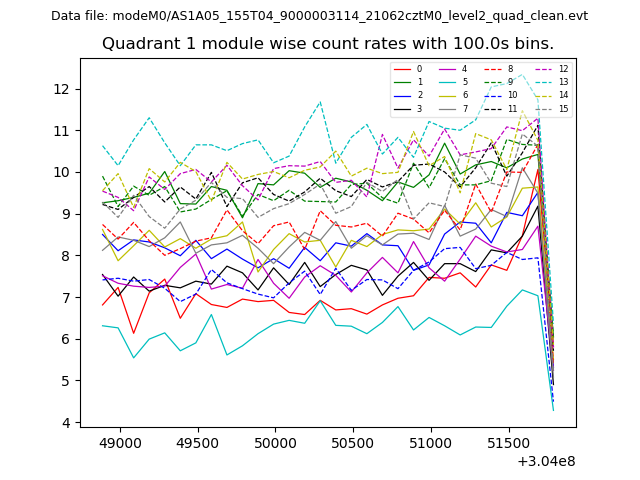
| Module-wise count rates for Quadrant A Data is divided into 100 sec bins |
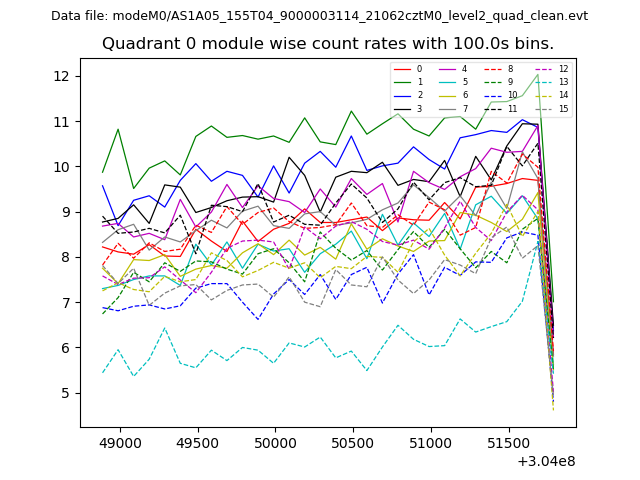 |
 |
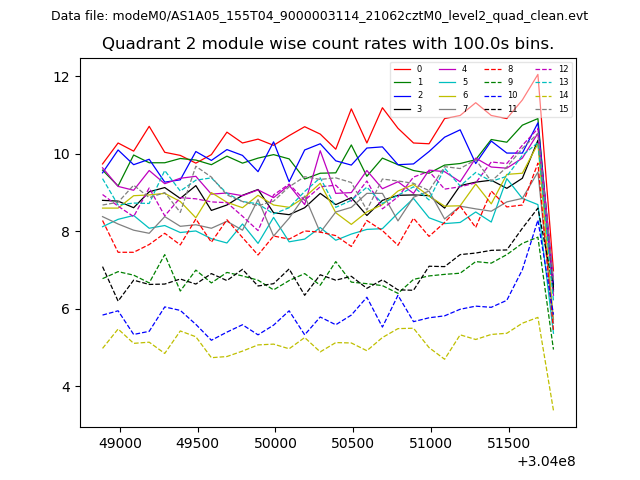
| Module-wise count rates for Quadrant B Data is divided into 100 sec bins |
 |
 |
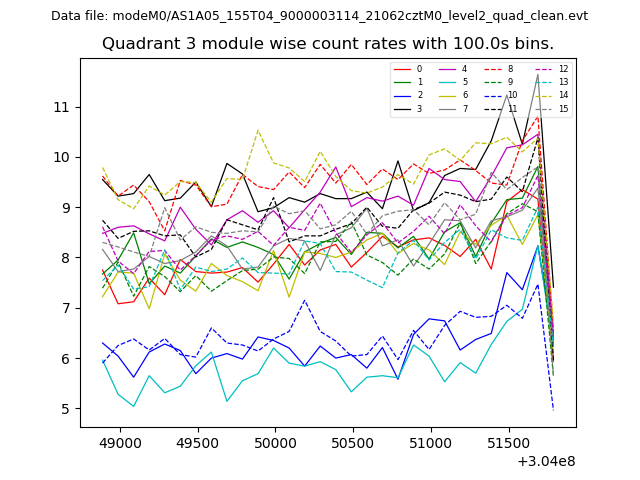
| Module-wise count rates for Quadrant C Data is divided into 100 sec bins |
 |
 |
| Module-wise count rates for Quadrant D Data is divided into 100 sec bins |
 |
 |
| Parameter | Plot |
|---|---|
| CZT HV Monitor | 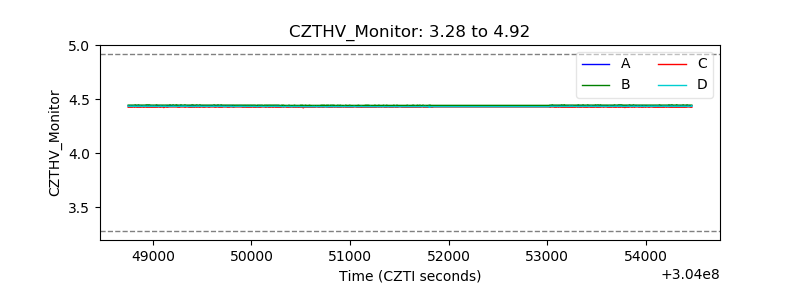 |
| D_VDD | 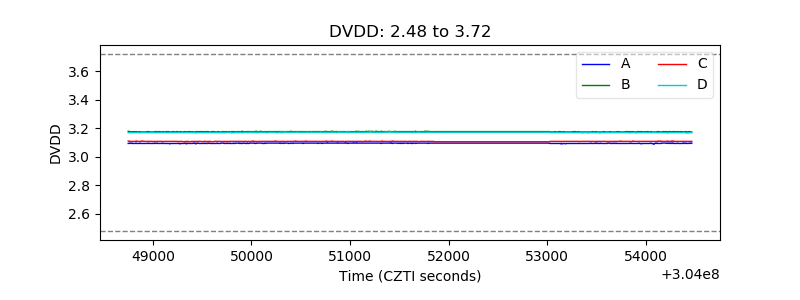 |
| Temperature 1 | 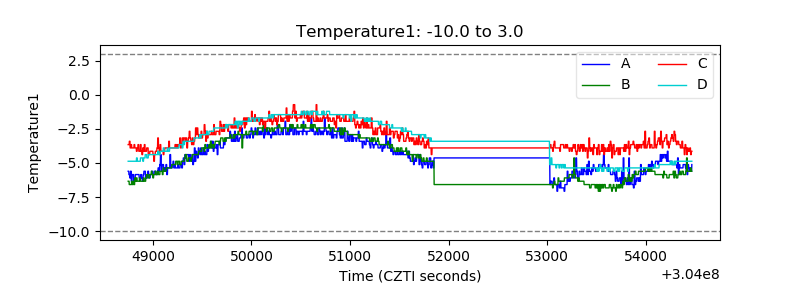 |
| Veto HV Monitor |  |
| Veto LLD | 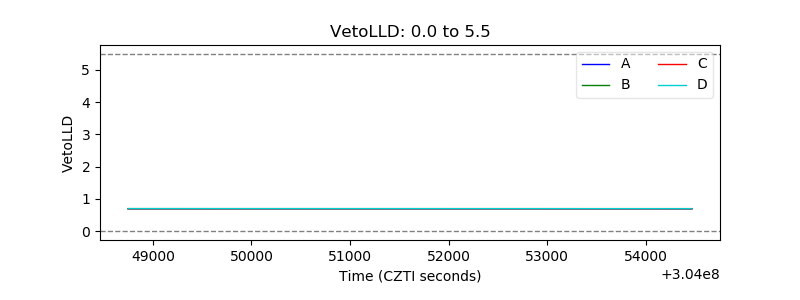 |
| Alpha Counter | 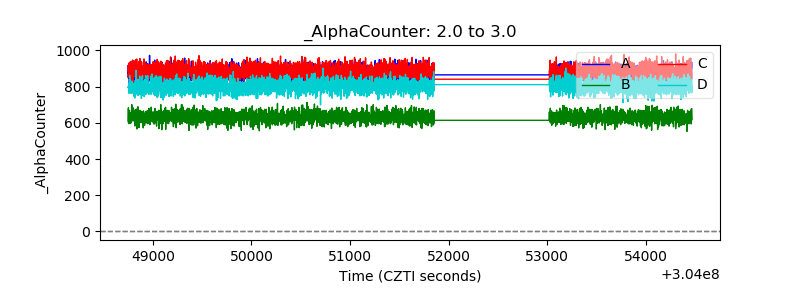 |
| _CPM_Rate | 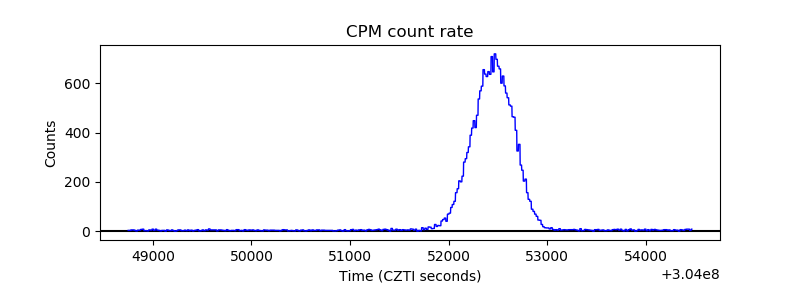 |
| CZT Counter | 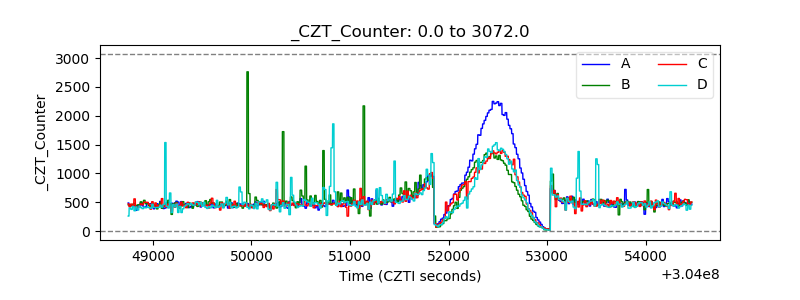 |
| +2.5 Volts monitor |  |
| +5 Volts monitor |  |
| _ROLL_ROT | 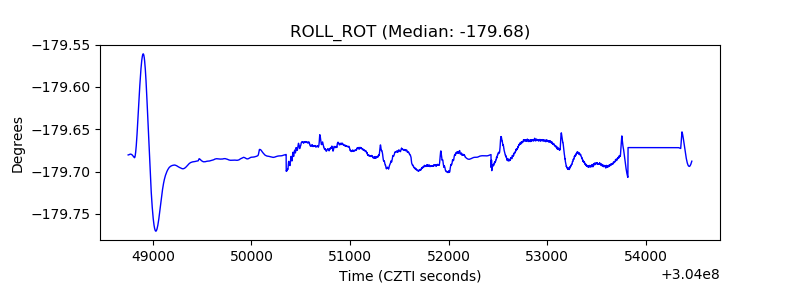 |
| _Roll_DEC |  |
| _Roll_RA | 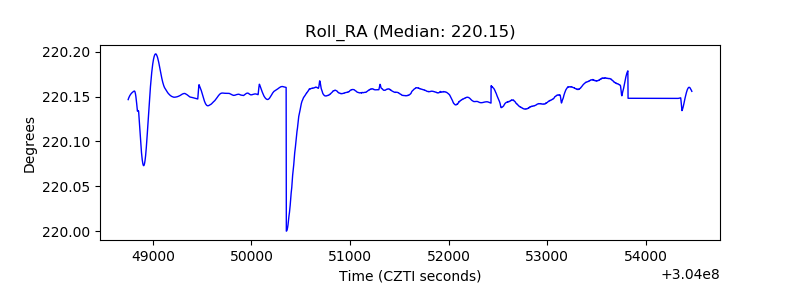 |
| Veto Counter | 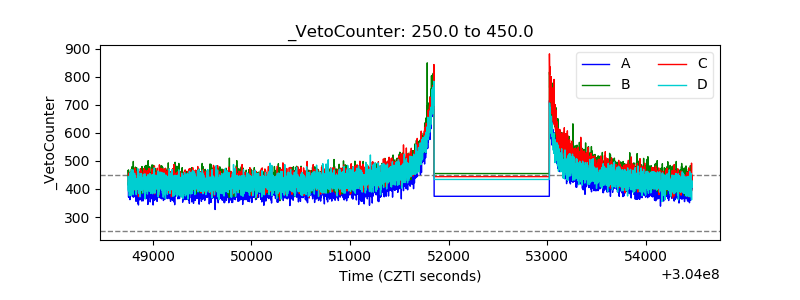 |