| Param | Original file | Final file |
|---|---|---|
| Filename | modeM0/AS1A05_155T04_9000003114_21063cztM0_level2.evt | modeM0/AS1A05_155T04_9000003114_21063cztM0_level2_quad_clean.evt |
| Size (bytes) | 441,308,160 | 78,816,960 |
| Size | 420.9 MB | 75.2 MB |
| Events in quadrant A | 3,126,976 | 493,266 |
| Events in quadrant B | 3,520,103 | 493,692 |
| Events in quadrant C | 3,163,699 | 476,150 |
| Events in quadrant D | 3,110,513 | 468,372 |
| Mode M0 | |||
|---|---|---|---|
| Quadrant | BADHDUFLAG | Total packets | Discarded packets |
| A | 0 | 13414 | 1 |
| B | 0 | 14404 | 1 |
| C | 0 | 13434 | 1 |
| D | 0 | 13695 | 1 |
| Mode M9 | |||
|---|---|---|---|
| Quadrant | BADHDUFLAG | Total packets | Discarded packets |
| A | 0 | 8 | 0 |
| B | 0 | 8 | 0 |
| C | 0 | 8 | 0 |
| D | 0 | 8 | 0 |
| Mode SS | |||
|---|---|---|---|
| Quadrant | BADHDUFLAG | Total packets | Discarded packets |
| A | 0 | 134 | 0 |
| B | 0 | 134 | 0 |
| C | 0 | 134 | 0 |
| D | 0 | 134 | 0 |
| Quadrant | Total seconds | Saturated seconds | Saturation percentage |
|---|---|---|---|
| A | 6519 | 108 | 1.656696% |
| B | 6520 | 198 | 3.036810% |
| C | 6520 | 147 | 2.254601% |
| D | 6520 | 85 | 1.303681% |
Noise dominated data is calculated using 1-second bins in cleaned event files. If a bin has >2000 counts, and if more than 50% of those come from <1% of pixels, then it is considered to be noise-dominated and hence unusable.
| Quadrant | # 1 sec bins | Bins with >0 counts | Bins with >2000 counts | High rate bins dominated by noise | Noise dominated (total time) | Noise dominated (detector-on time) | Marked lightcurve |
|---|---|---|---|---|---|---|---|
| A | 7329 | 6520 | 3 | 3 | 0.04% | 0.05% | 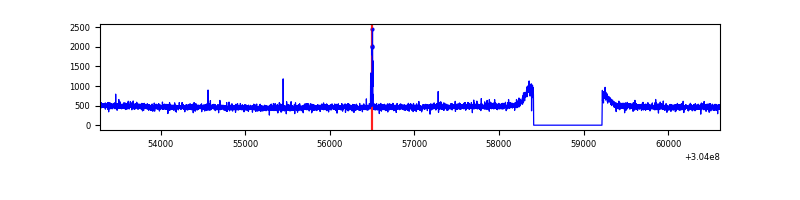 |
| B | 7330 | 6521 | 49 | 49 | 0.67% | 0.75% |  |
| C | 7330 | 6521 | 0 | 0 | 0.00% | 0.00% | 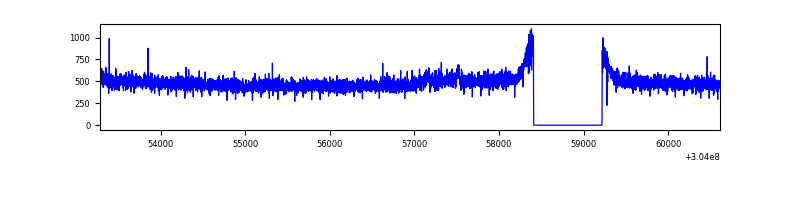 |
| D | 7330 | 6521 | 11 | 11 | 0.15% | 0.17% | 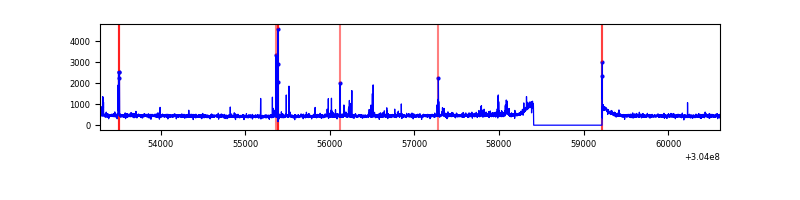 |
Top three noisy pixels from each quadrant. If the there are fewer than three noisy pixels in the level2.evt file, extra rows are filled as -1
| Pixel properties | Quadrant properties | ||||||
|---|---|---|---|---|---|---|---|
| Quadrant | DetID | PixID | Counts | Sigma | Mean | Median | Sigma |
| A | 12 | 96 | 23743 | 142.01 | 805 | 788 | 161.6 |
| A | 13 | 254 | 8540 | 47.96 | 805 | 788 | 161.6 |
| A | 0 | 226 | 6907 | 37.85 | 805 | 788 | 161.6 |
| B | 7 | 220 | 310443 | 2029.65 | 802 | 779 | 152.6 |
| B | 0 | 219 | 26708 | 169.95 | 802 | 779 | 152.6 |
| B | 0 | 190 | 23126 | 146.47 | 802 | 779 | 152.6 |
| C | 14 | 238 | 120928 | 661.13 | 774 | 778 | 181.7 |
| C | 10 | 91 | 25734 | 137.32 | 774 | 778 | 181.7 |
| C | 13 | 61 | 5373 | 25.28 | 774 | 778 | 181.7 |
| D | 1 | 52 | 66243 | 346.39 | 783 | 762 | 189.0 |
| D | 1 | 20 | 28715 | 147.87 | 783 | 762 | 189.0 |
| D | 2 | 234 | 24229 | 124.14 | 783 | 762 | 189.0 |
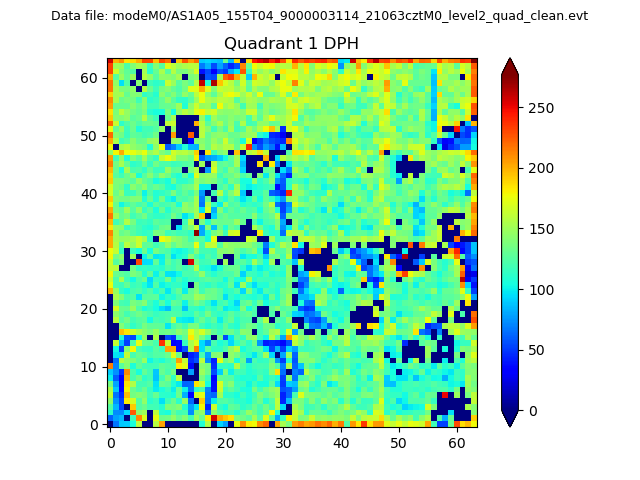
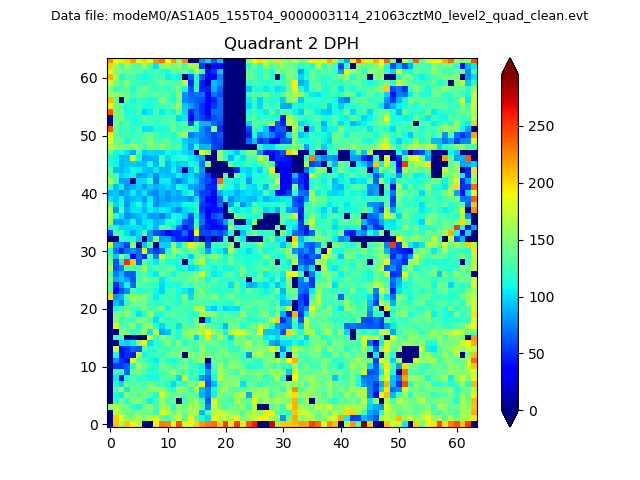
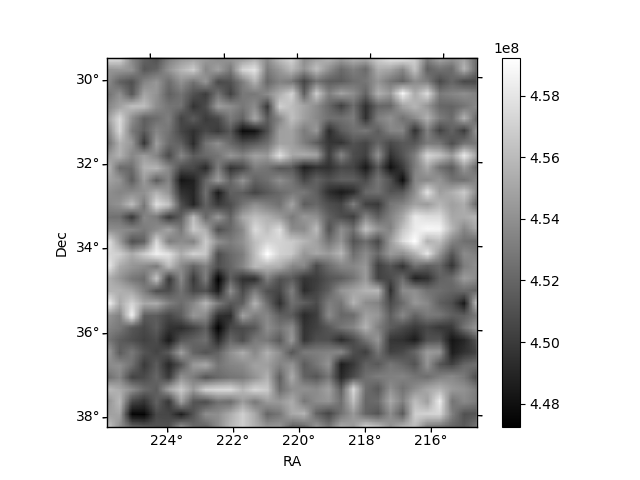
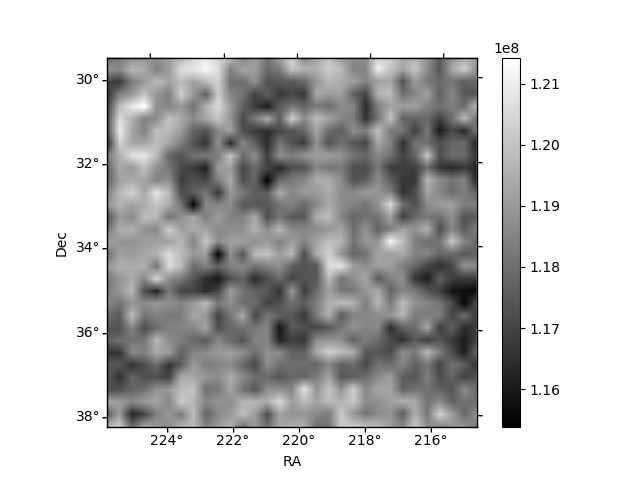
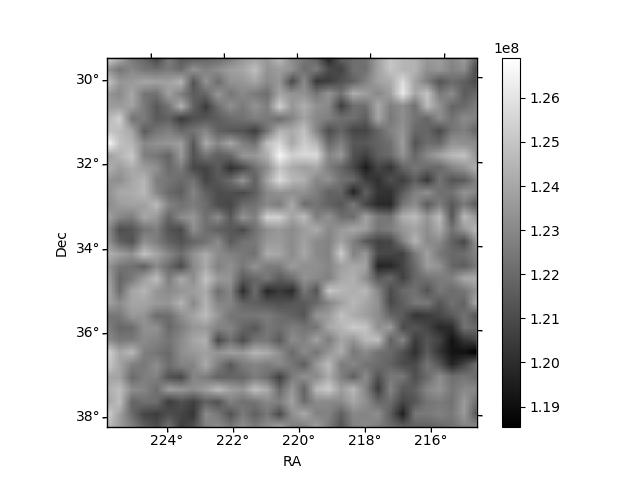
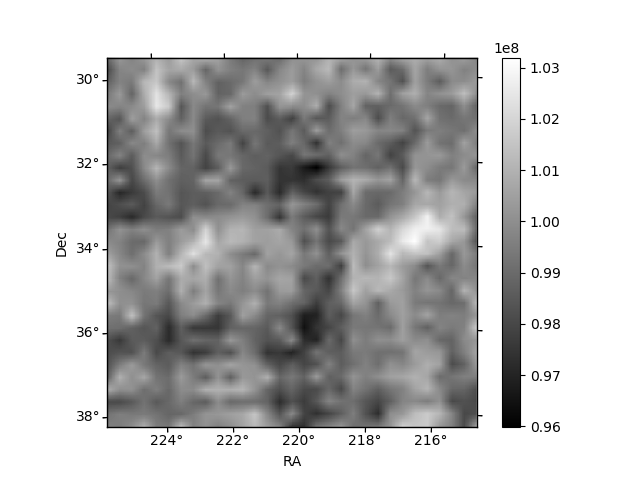
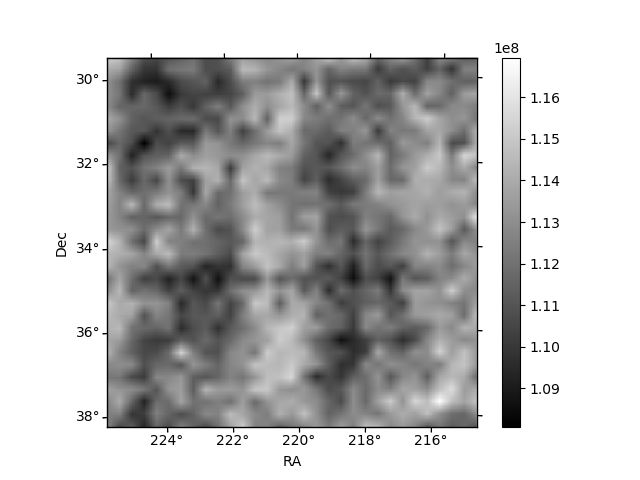
Histogram calculated using DETX and DETY for each event in the final _common_clean file
| Quadrant A | 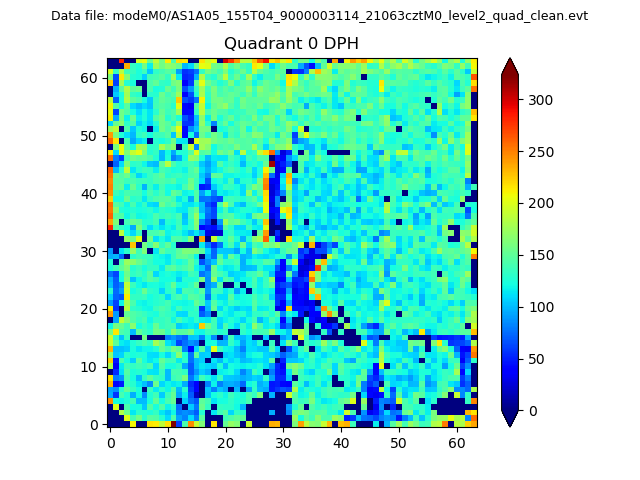 |
 |
Quadrant B |
|---|---|---|---|
| Quadrant D | 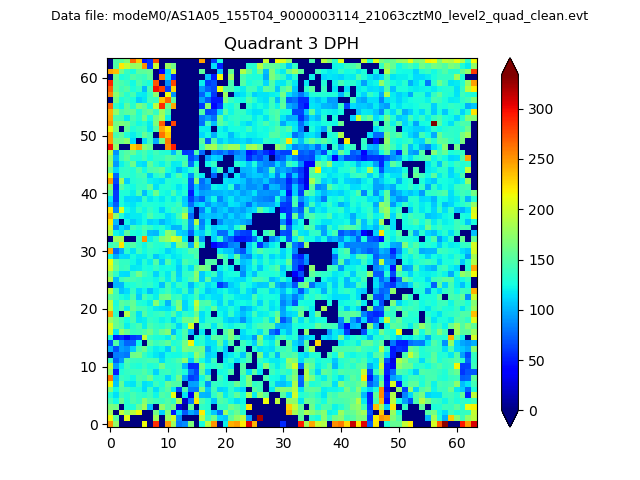 |
 |
Quadrant C |
| Plot type | Count rate plots | Images |
|---|---|---|
| Comparison with Poisson distribution Blue bars denote a histogram of data divided into 1 sec bins. Red curve is a Poisson curve with rate = median count rate of data. |
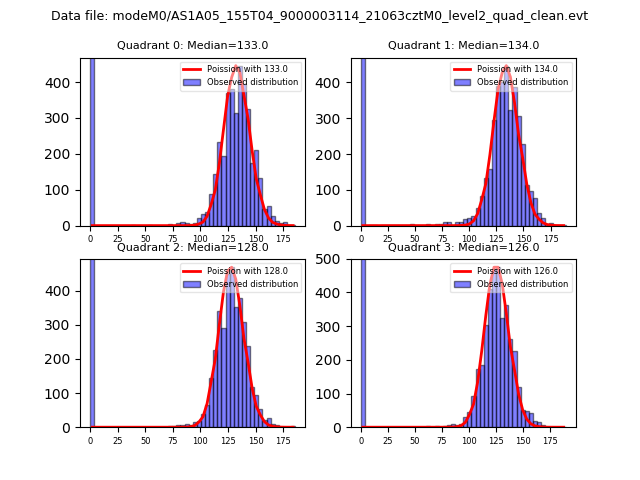 |
 |
| Quadrant-wise count rates Data is divided into 100 sec bins |
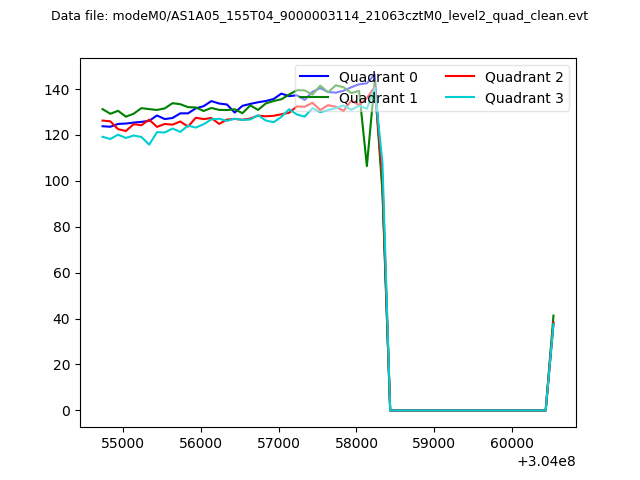 |
|
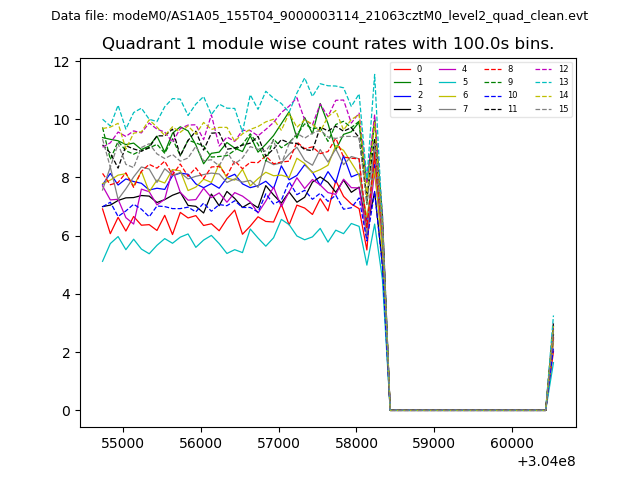
| Module-wise count rates for Quadrant A Data is divided into 100 sec bins |
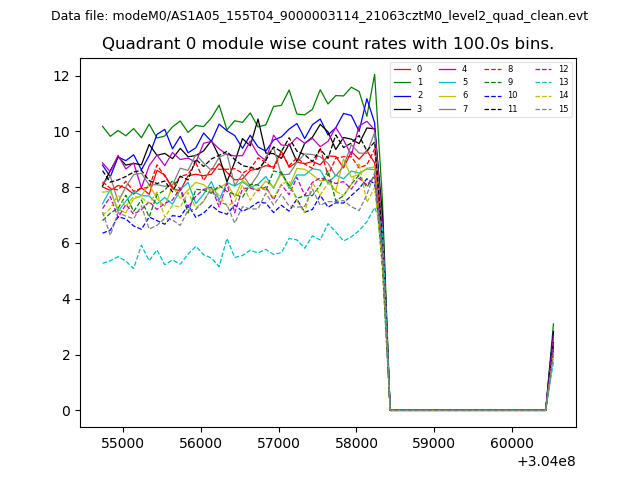 |
 |
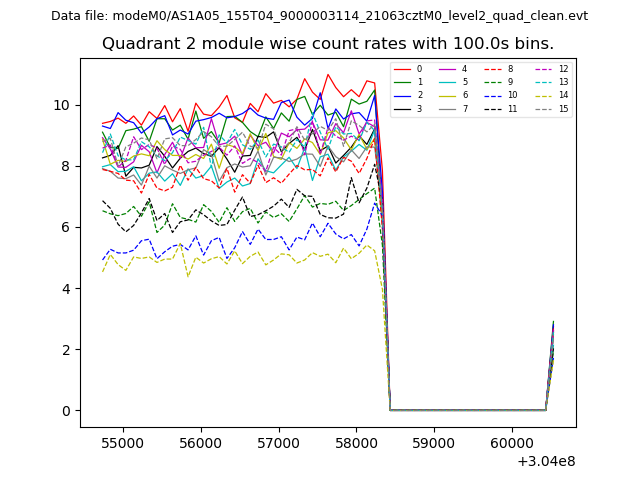
| Module-wise count rates for Quadrant B Data is divided into 100 sec bins |
 |
 |
| Module-wise count rates for Quadrant C Data is divided into 100 sec bins |
 |
 |
| Module-wise count rates for Quadrant D Data is divided into 100 sec bins |
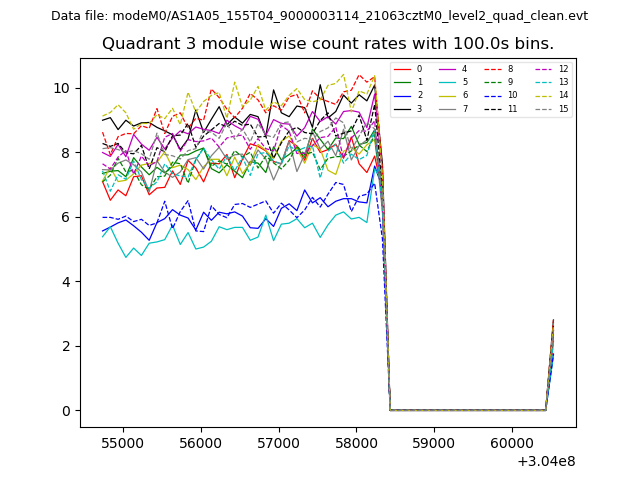 |
 |
| Parameter | Plot |
|---|---|
| CZT HV Monitor | 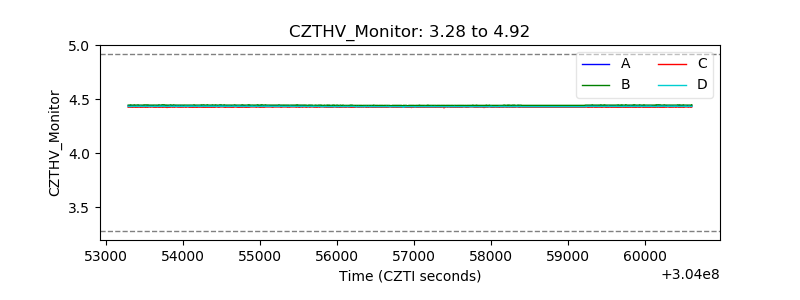 |
| D_VDD | 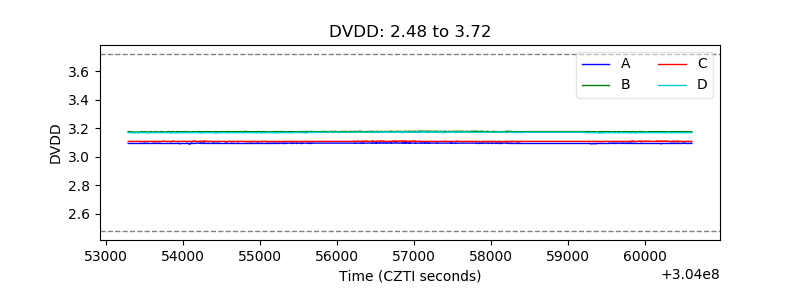 |
| Temperature 1 | 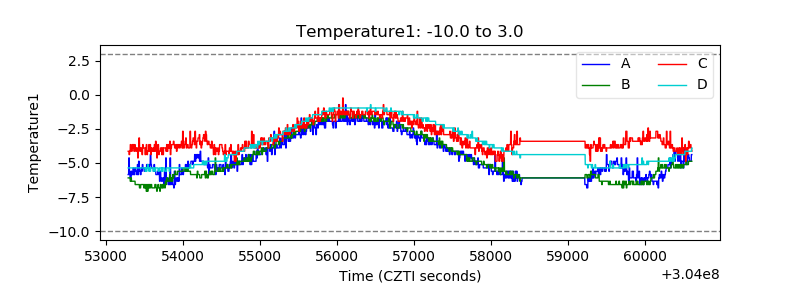 |
| Veto HV Monitor | 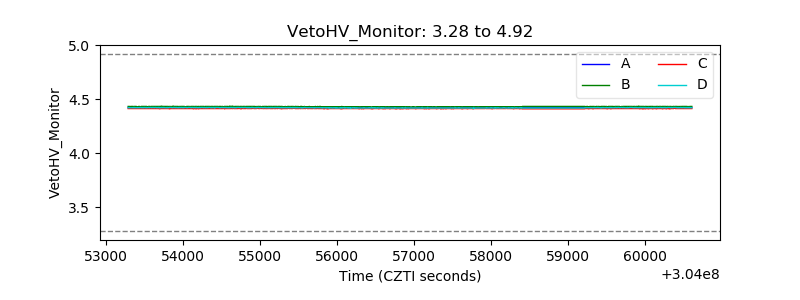 |
| Veto LLD | 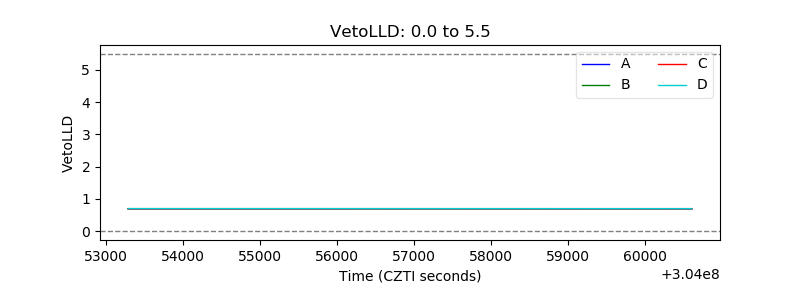 |
| Alpha Counter | 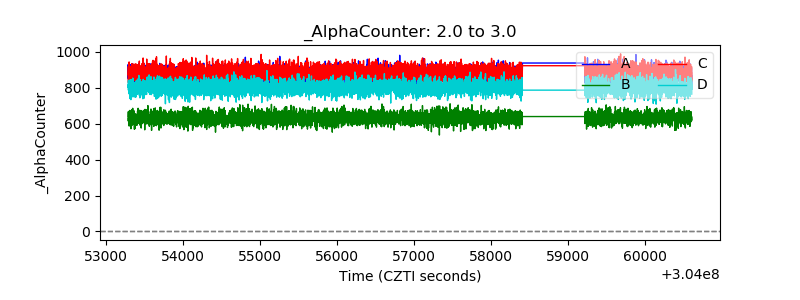 |
| _CPM_Rate | 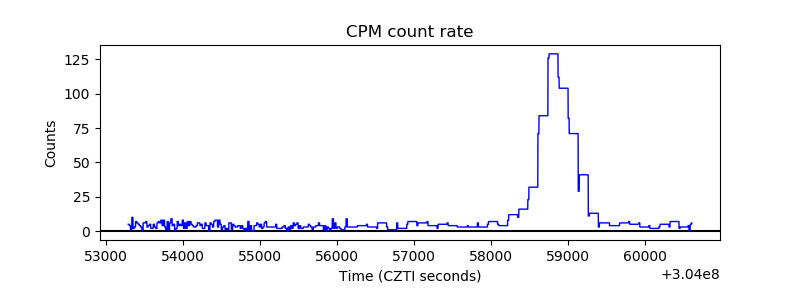 |
| CZT Counter | 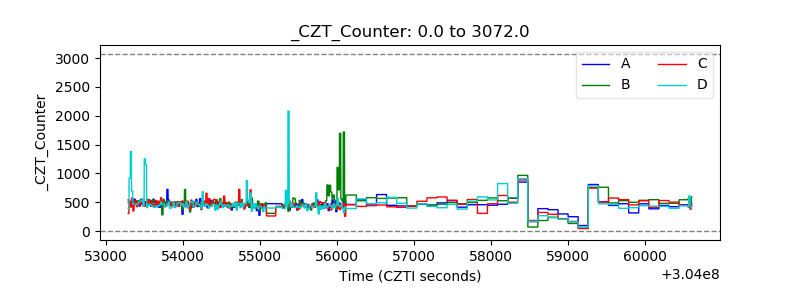 |
| +2.5 Volts monitor |  |
| +5 Volts monitor |  |
| _ROLL_ROT | 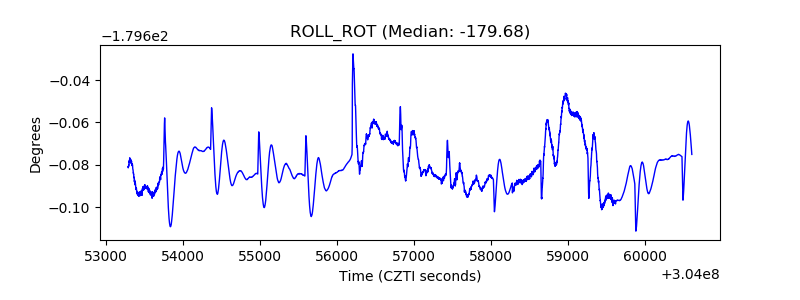 |
| _Roll_DEC | 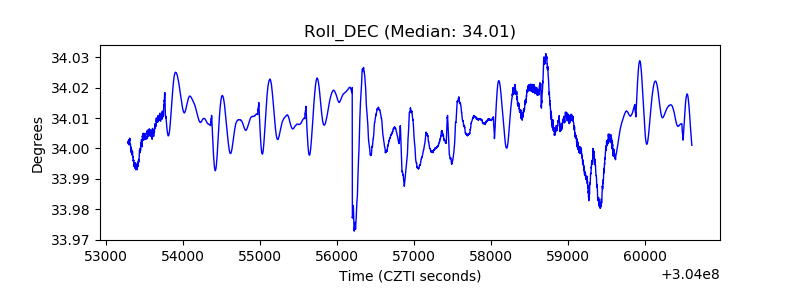 |
| _Roll_RA | 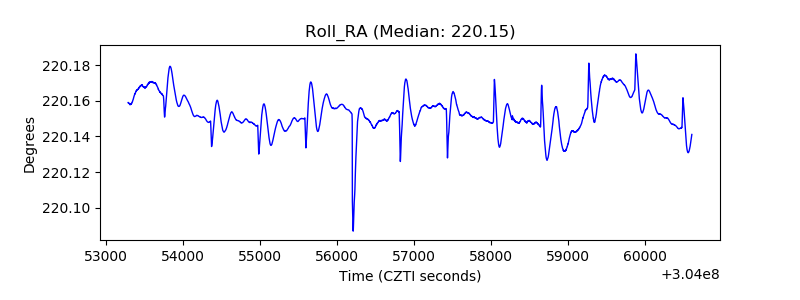 |
| Veto Counter | 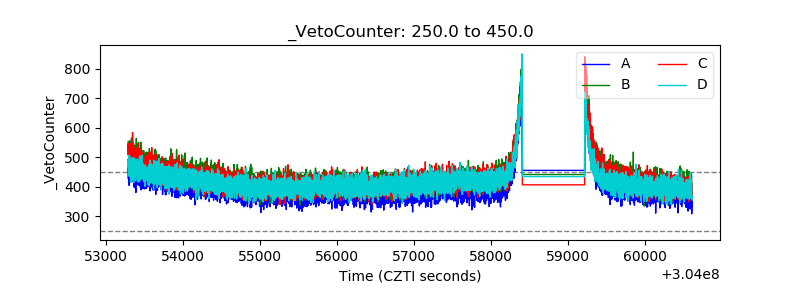 |