| Param | Original file | Final file |
|---|---|---|
| Filename | modeM0/AS1A05_155T04_9000003114_21065cztM0_level2.evt | modeM0/AS1A05_155T04_9000003114_21065cztM0_level2_quad_clean.evt |
| Size (bytes) | 496,961,280 | 94,049,280 |
| Size | 473.9 MB | 89.7 MB |
| Events in quadrant A | 3,395,007 | 597,565 |
| Events in quadrant B | 3,835,417 | 597,976 |
| Events in quadrant C | 3,429,436 | 577,701 |
| Events in quadrant D | 3,893,872 | 566,030 |
| Mode M0 | |||
|---|---|---|---|
| Quadrant | BADHDUFLAG | Total packets | Discarded packets |
| A | 0 | 14917 | 1 |
| B | 0 | 15965 | 1 |
| C | 0 | 14940 | 1 |
| D | 0 | 16513 | 1 |
| Mode M9 | |||
|---|---|---|---|
| Quadrant | BADHDUFLAG | Total packets | Discarded packets |
| A | 0 | 3 | 0 |
| B | 0 | 3 | 0 |
| C | 0 | 3 | 0 |
| D | 0 | 3 | 0 |
| Mode SS | |||
|---|---|---|---|
| Quadrant | BADHDUFLAG | Total packets | Discarded packets |
| A | 0 | 148 | 0 |
| B | 0 | 148 | 0 |
| C | 0 | 148 | 0 |
| D | 0 | 148 | 0 |
| Quadrant | Total seconds | Saturated seconds | Saturation percentage |
|---|---|---|---|
| A | 7311 | 86 | 1.176310% |
| B | 7311 | 169 | 2.311585% |
| C | 7311 | 104 | 1.422514% |
| D | 7312 | 166 | 2.270241% |
Noise dominated data is calculated using 1-second bins in cleaned event files. If a bin has >2000 counts, and if more than 50% of those come from <1% of pixels, then it is considered to be noise-dominated and hence unusable.
| Quadrant | # 1 sec bins | Bins with >0 counts | Bins with >2000 counts | High rate bins dominated by noise | Noise dominated (total time) | Noise dominated (detector-on time) | Marked lightcurve |
|---|---|---|---|---|---|---|---|
| A | 7586 | 7312 | 0 | 0 | 0.00% | 0.00% | 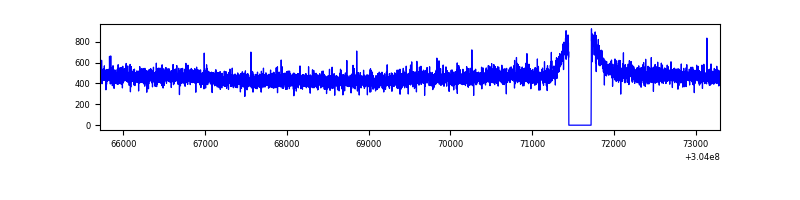 |
| B | 7586 | 7312 | 39 | 39 | 0.51% | 0.53% | 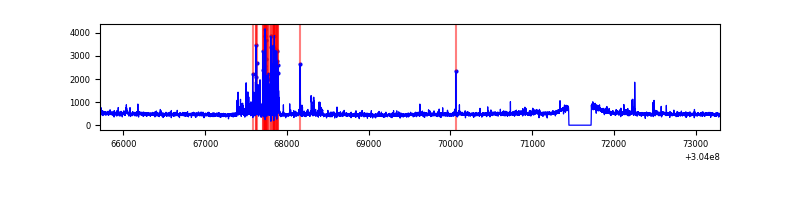 |
| C | 7586 | 7312 | 0 | 0 | 0.00% | 0.00% | 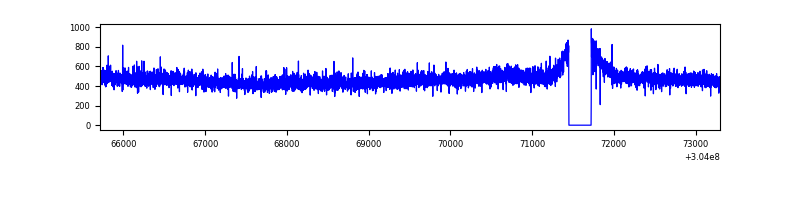 |
| D | 7587 | 7313 | 33 | 33 | 0.43% | 0.45% | 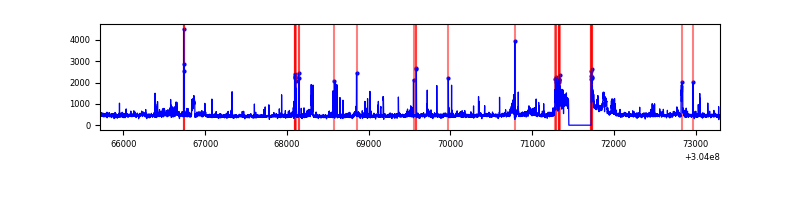 |
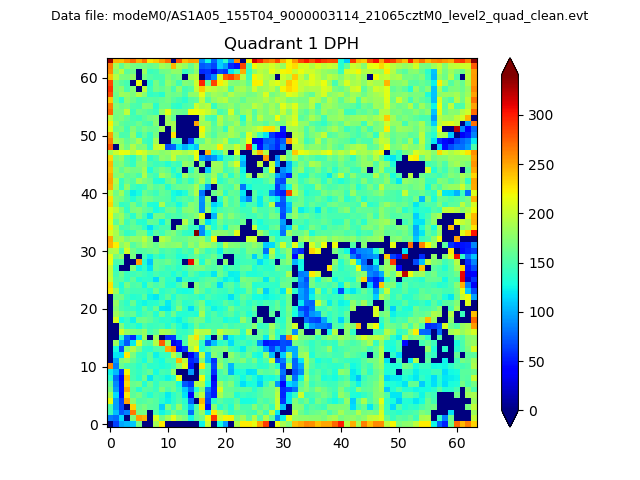
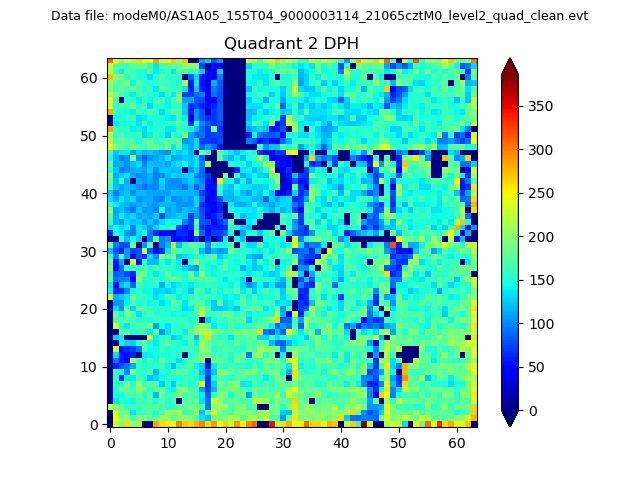
Top three noisy pixels from each quadrant. If the there are fewer than three noisy pixels in the level2.evt file, extra rows are filled as -1
| Pixel properties | Quadrant properties | ||||||
|---|---|---|---|---|---|---|---|
| Quadrant | DetID | PixID | Counts | Sigma | Mean | Median | Sigma |
| A | 13 | 254 | 10800 | 56.2 | 879 | 857 | 176.9 |
| A | 0 | 226 | 7585 | 38.03 | 879 | 857 | 176.9 |
| A | 3 | 137 | 7313 | 36.49 | 879 | 857 | 176.9 |
| B | 0 | 182 | 195776 | 1177.18 | 873 | 850 | 165.6 |
| B | 7 | 220 | 76750 | 458.37 | 873 | 850 | 165.6 |
| B | 0 | 219 | 71621 | 427.39 | 873 | 850 | 165.6 |
| C | 14 | 238 | 131693 | 658.9 | 844 | 851 | 198.6 |
| C | 13 | 61 | 5919 | 25.52 | 844 | 851 | 198.6 |
| C | 3 | 9 | 3746 | 14.58 | 844 | 851 | 198.6 |
| D | 9 | 1 | 315872 | 1526.2 | 851 | 825 | 206.4 |
| D | 1 | 52 | 149929 | 722.31 | 851 | 825 | 206.4 |
| D | 7 | 238 | 49326 | 234.96 | 851 | 825 | 206.4 |
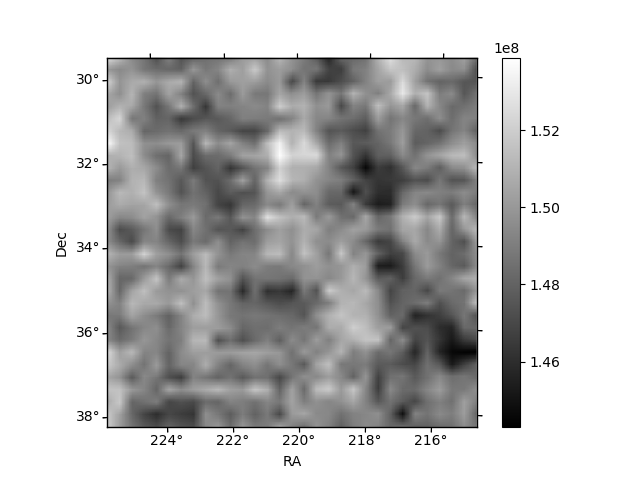
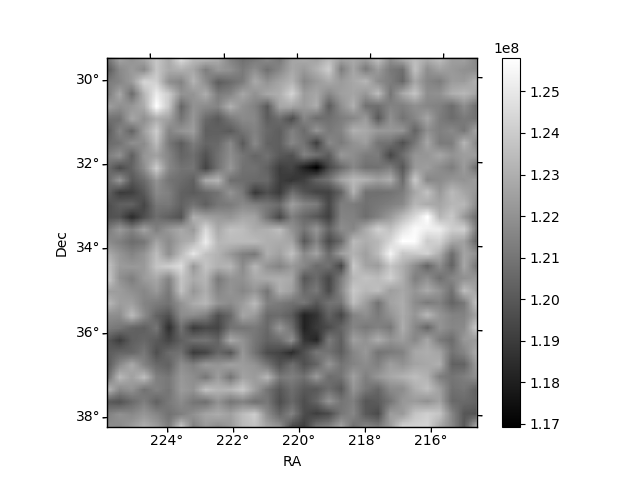
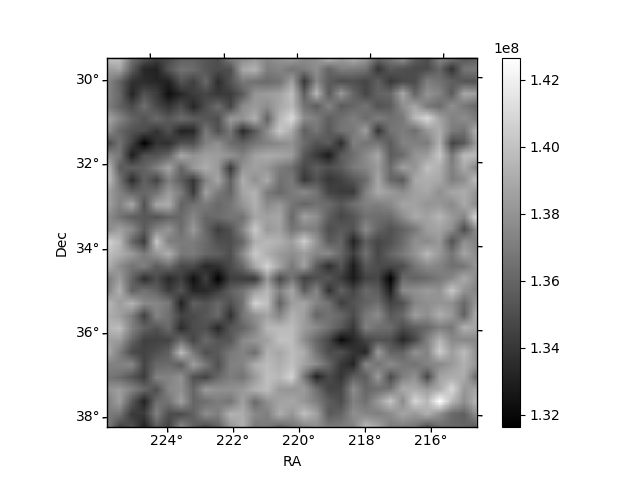
Histogram calculated using DETX and DETY for each event in the final _common_clean file
| Quadrant A | 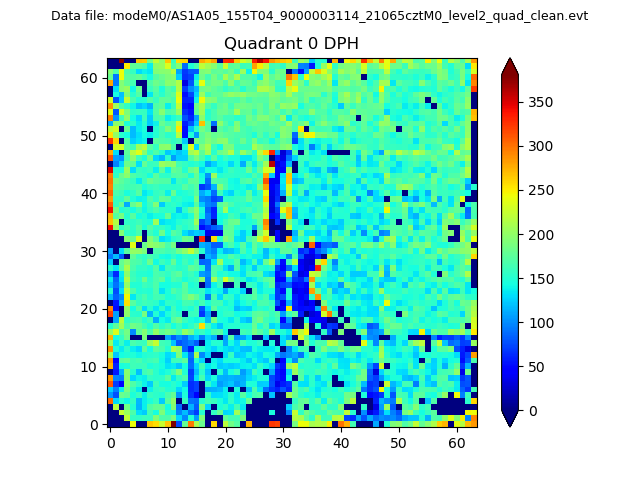 |
 |
Quadrant B |
|---|---|---|---|
| Quadrant D | 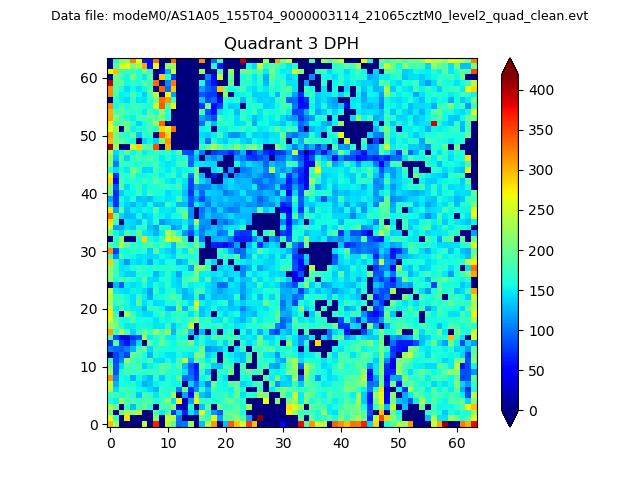 |
 |
Quadrant C |
| Plot type | Count rate plots | Images |
|---|---|---|
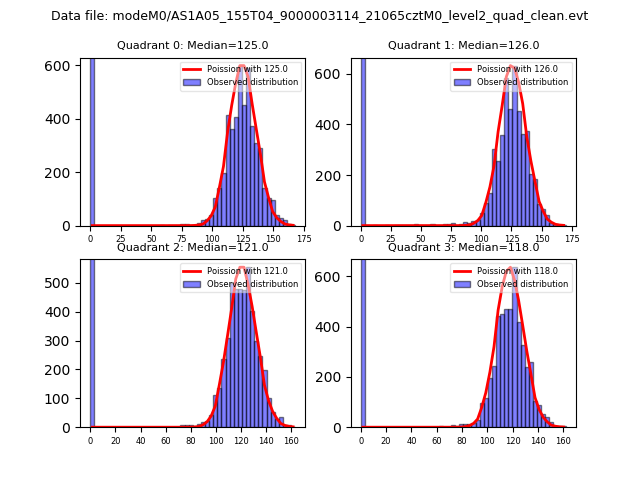
| Comparison with Poisson distribution Blue bars denote a histogram of data divided into 1 sec bins. Red curve is a Poisson curve with rate = median count rate of data. |
 |
 |
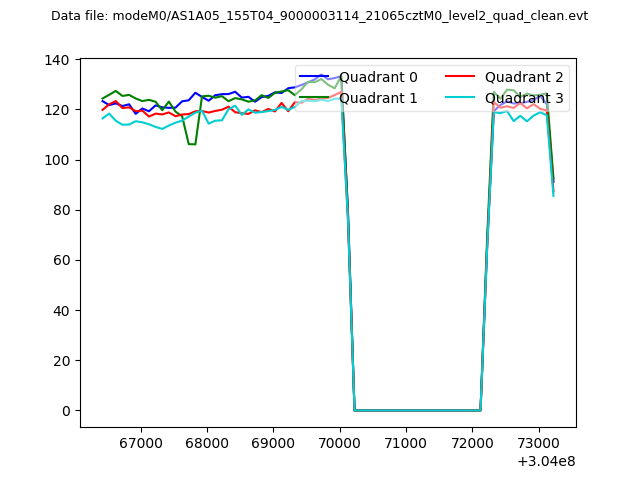
| Quadrant-wise count rates Data is divided into 100 sec bins |
 |
|
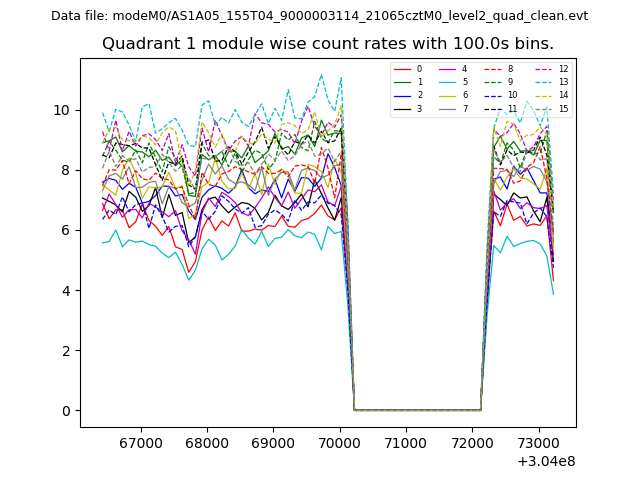
| Module-wise count rates for Quadrant A Data is divided into 100 sec bins |
 |
 |
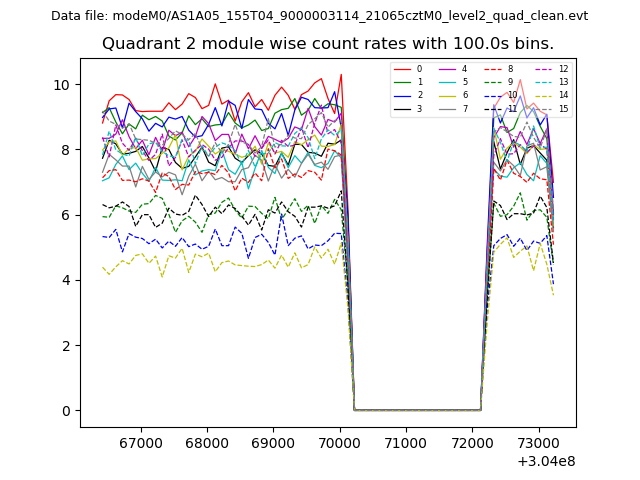
| Module-wise count rates for Quadrant B Data is divided into 100 sec bins |
 |
 |
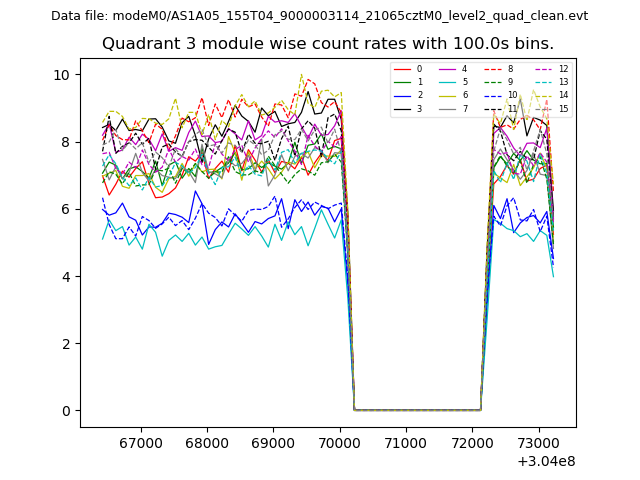
| Module-wise count rates for Quadrant C Data is divided into 100 sec bins |
 |
 |
| Module-wise count rates for Quadrant D Data is divided into 100 sec bins |
 |
 |
| Parameter | Plot |
|---|---|
| CZT HV Monitor | 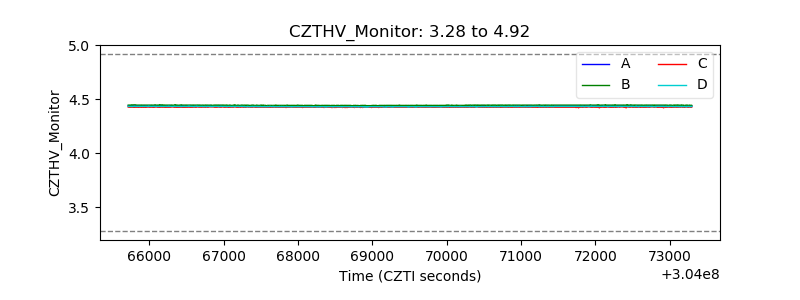 |
| D_VDD | 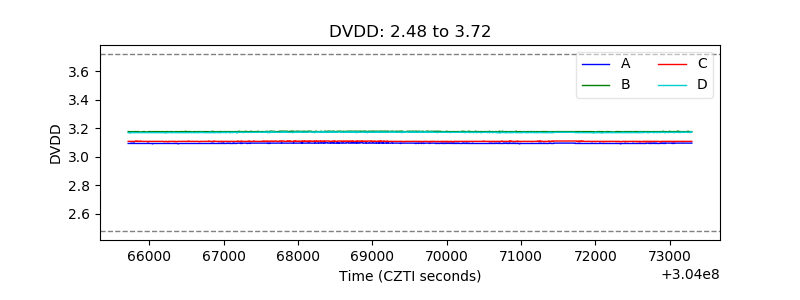 |
| Temperature 1 | 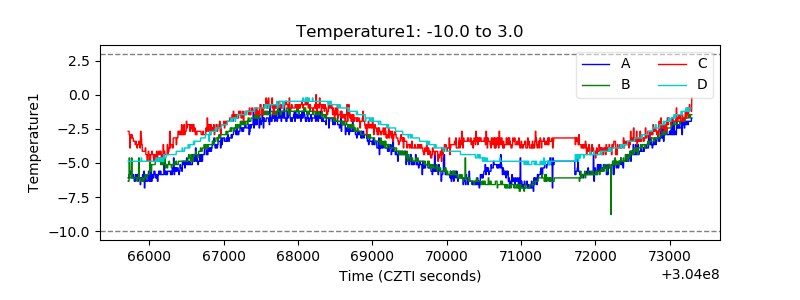 |
| Veto HV Monitor | 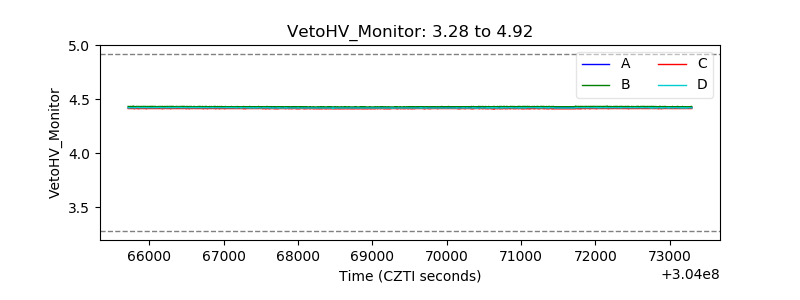 |
| Veto LLD | 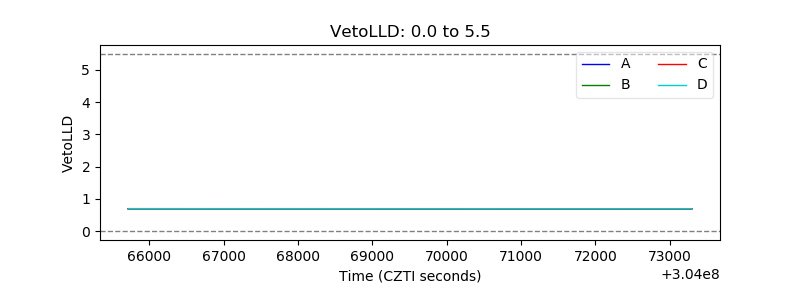 |
| Alpha Counter | 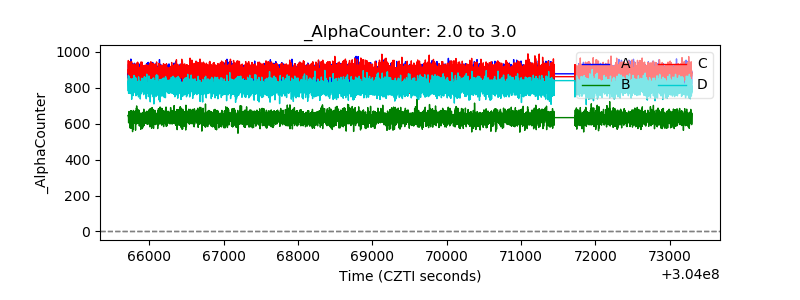 |
| _CPM_Rate | 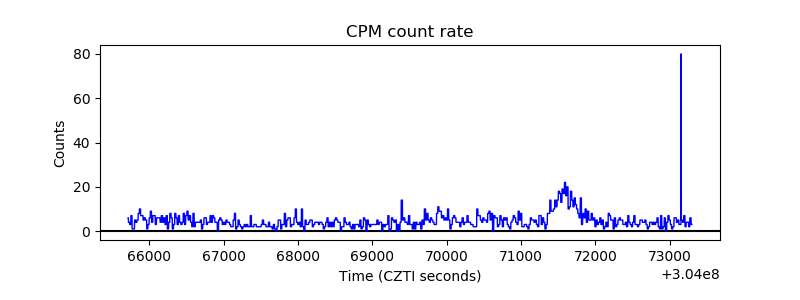 |
| CZT Counter | 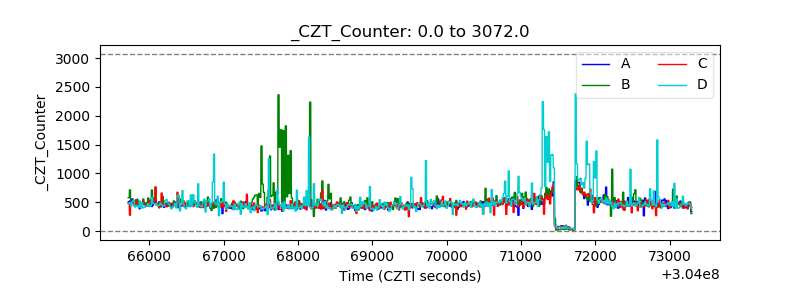 |
| +2.5 Volts monitor |  |
| +5 Volts monitor |  |
| _ROLL_ROT | 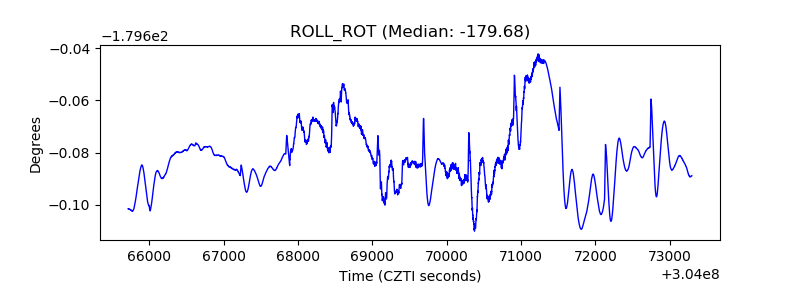 |
| _Roll_DEC | 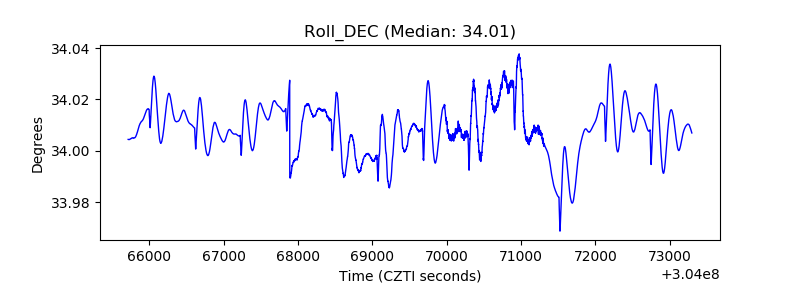 |
| _Roll_RA | 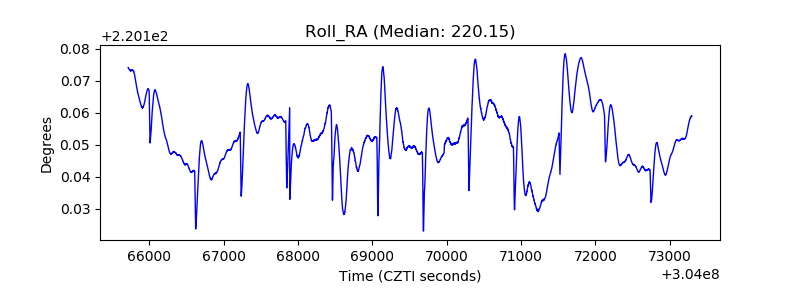 |
| Veto Counter | 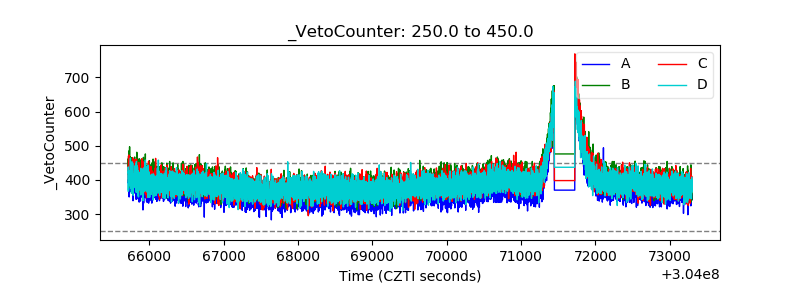 |