| Param | Original file | Final file |
|---|---|---|
| Filename | modeM0/AS1A05_155T04_9000003114_21069cztM0_level2.evt | modeM0/AS1A05_155T04_9000003114_21069cztM0_level2_quad_clean.evt |
| Size (bytes) | 1,135,293,120 | 198,169,920 |
| Size | 1.1 GB | 189.0 MB |
| Events in quadrant A | 7,392,245 | 1,254,399 |
| Events in quadrant B | 8,640,513 | 1,255,216 |
| Events in quadrant C | 7,452,445 | 1,207,020 |
| Events in quadrant D | 9,805,271 | 1,171,257 |
| Mode M0 | |||
|---|---|---|---|
| Quadrant | BADHDUFLAG | Total packets | Discarded packets |
| A | 0 | 33053 | 3 |
| B | 0 | 36073 | 3 |
| C | 0 | 32961 | 3 |
| D | 0 | 39791 | 3 |
| Mode M9 | |||
|---|---|---|---|
| Quadrant | BADHDUFLAG | Total packets | Discarded packets |
| A | 0 | 23 | 0 |
| B | 0 | 23 | 0 |
| C | 0 | 23 | 0 |
| D | 0 | 23 | 0 |
| Mode SS | |||
|---|---|---|---|
| Quadrant | BADHDUFLAG | Total packets | Discarded packets |
| A | 0 | 326 | 0 |
| B | 0 | 326 | 0 |
| C | 0 | 326 | 0 |
| D | 0 | 326 | 0 |
| Quadrant | Total seconds | Saturated seconds | Saturation percentage |
|---|---|---|---|
| A | 16159 | 141 | 0.872579% |
| B | 16160 | 213 | 1.318069% |
| C | 16160 | 170 | 1.051980% |
| D | 16160 | 437 | 2.704208% |
Noise dominated data is calculated using 1-second bins in cleaned event files. If a bin has >2000 counts, and if more than 50% of those come from <1% of pixels, then it is considered to be noise-dominated and hence unusable.
| Quadrant | # 1 sec bins | Bins with >0 counts | Bins with >2000 counts | High rate bins dominated by noise | Noise dominated (total time) | Noise dominated (detector-on time) | Marked lightcurve |
|---|---|---|---|---|---|---|---|
| A | 18304 | 16162 | 0 | 0 | 0.00% | 0.00% | 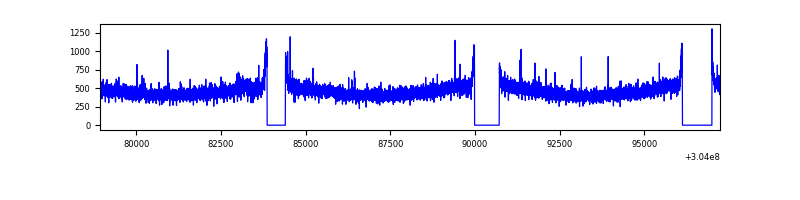 |
| B | 18305 | 16163 | 40 | 40 | 0.22% | 0.25% | 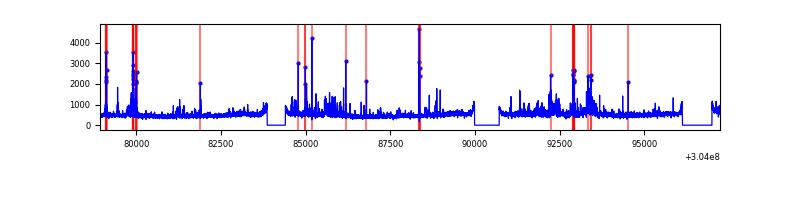 |
| C | 18305 | 16163 | 0 | 0 | 0.00% | 0.00% | 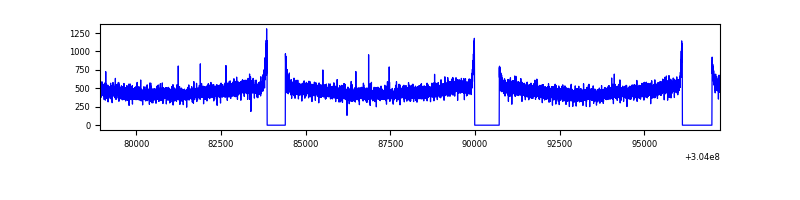 |
| D | 18305 | 16163 | 274 | 274 | 1.50% | 1.70% | 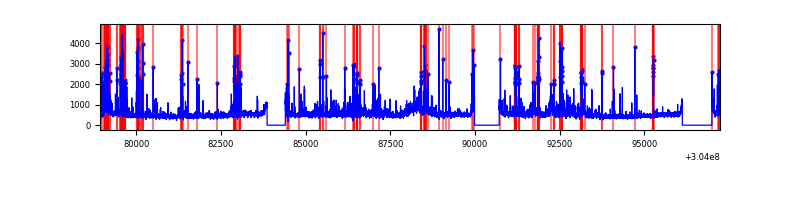 |
Top three noisy pixels from each quadrant. If the there are fewer than three noisy pixels in the level2.evt file, extra rows are filled as -1
| Pixel properties | Quadrant properties | ||||||
|---|---|---|---|---|---|---|---|
| Quadrant | DetID | PixID | Counts | Sigma | Mean | Median | Sigma |
| A | 13 | 254 | 24734 | 59.4 | 1913 | 1870 | 384.9 |
| A | 0 | 226 | 16737 | 38.62 | 1913 | 1870 | 384.9 |
| A | 3 | 137 | 15558 | 35.56 | 1913 | 1870 | 384.9 |
| B | 0 | 182 | 583531 | 1598.63 | 1904 | 1855 | 363.9 |
| B | 0 | 219 | 168587 | 458.23 | 1904 | 1855 | 363.9 |
| B | 3 | 64 | 110684 | 299.1 | 1904 | 1855 | 363.9 |
| C | 14 | 238 | 285092 | 656.28 | 1838 | 1847 | 431.6 |
| C | 13 | 61 | 12984 | 25.8 | 1838 | 1847 | 431.6 |
| C | 3 | 233 | 5452 | 8.35 | 1838 | 1847 | 431.6 |
| D | 1 | 52 | 842617 | 1884.87 | 1852 | 1797 | 446.1 |
| D | 7 | 38 | 404264 | 902.21 | 1852 | 1797 | 446.1 |
| D | 9 | 1 | 358706 | 800.08 | 1852 | 1797 | 446.1 |
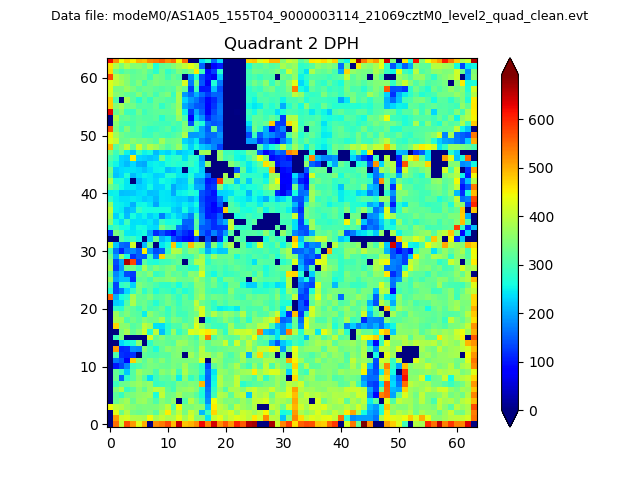
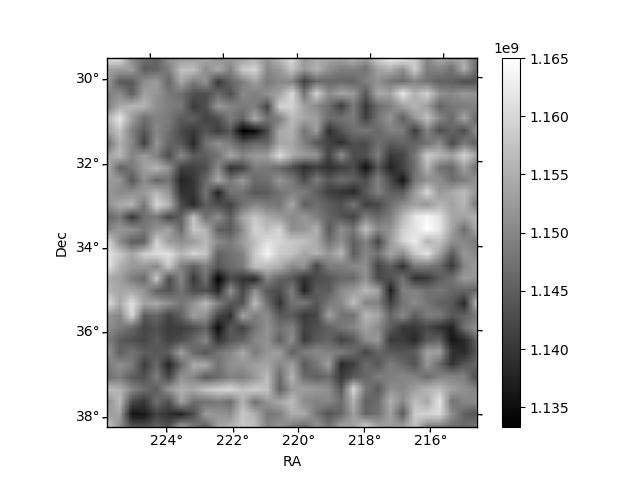
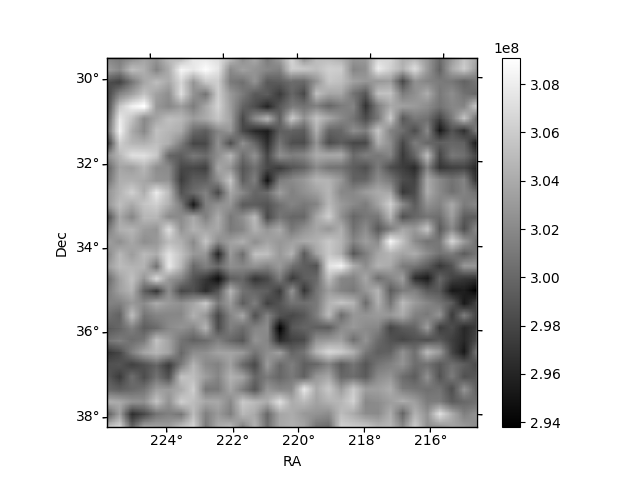
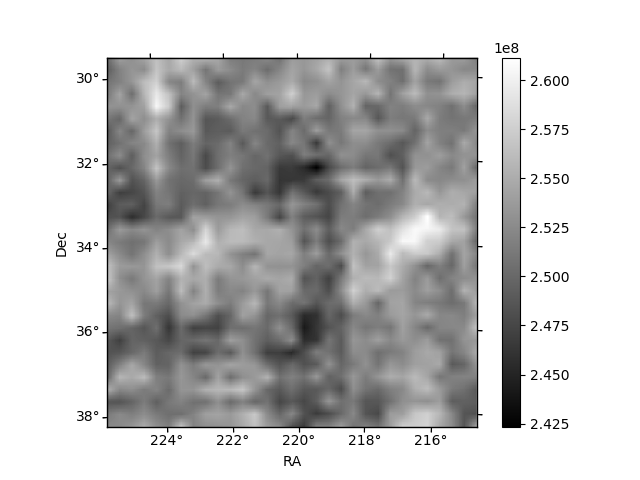
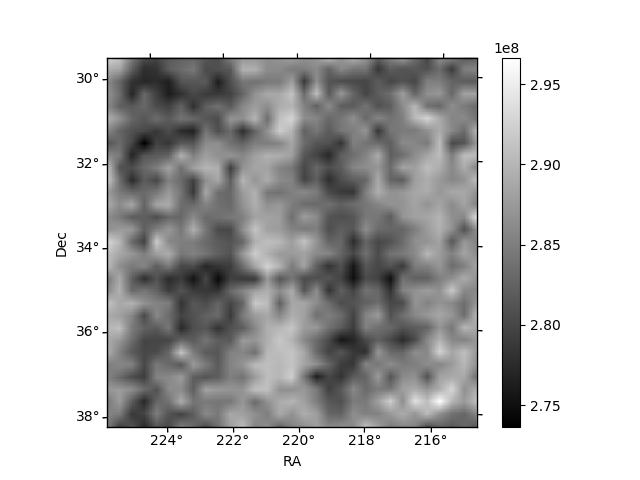
Histogram calculated using DETX and DETY for each event in the final _common_clean file
| Quadrant A | 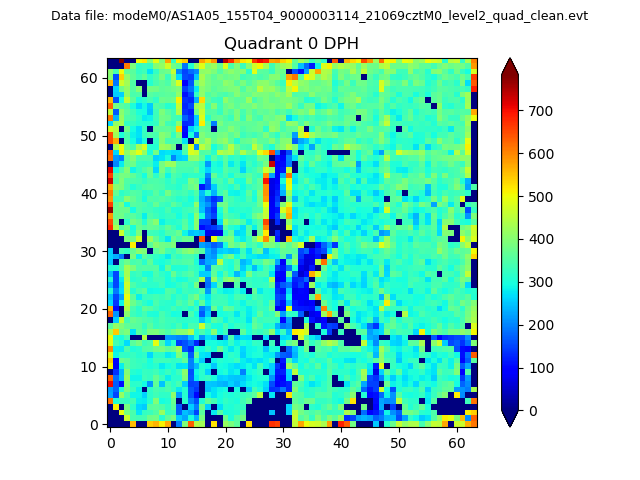 |
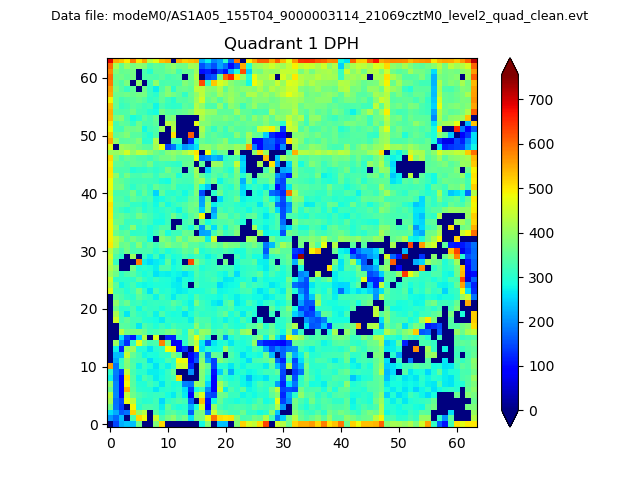 |
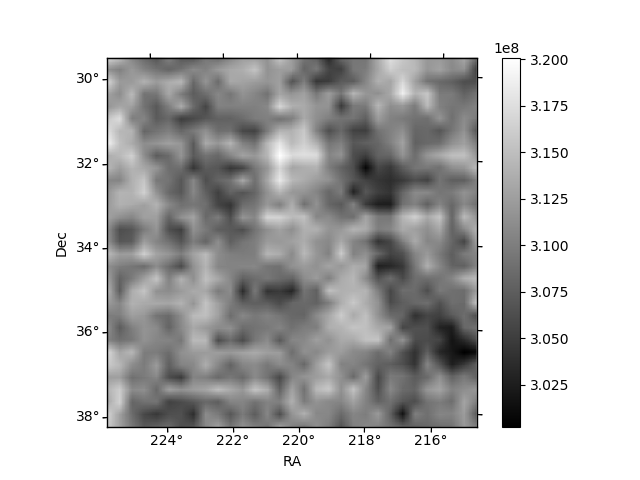
Quadrant B |
|---|---|---|---|
| Quadrant D | 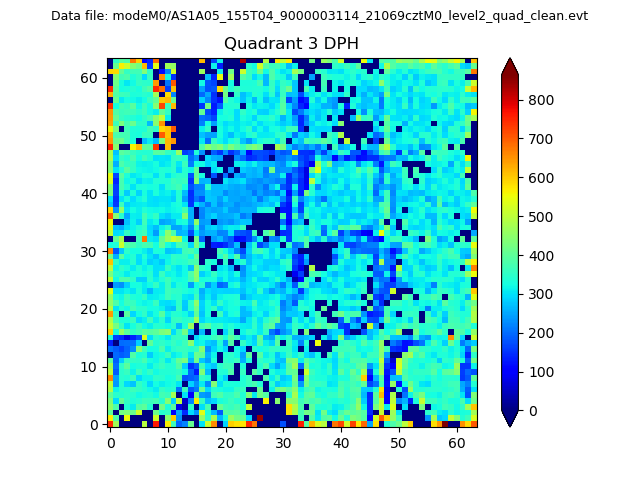 |
 |
Quadrant C |
| Plot type | Count rate plots | Images |
|---|---|---|
| Comparison with Poisson distribution Blue bars denote a histogram of data divided into 1 sec bins. Red curve is a Poisson curve with rate = median count rate of data. |
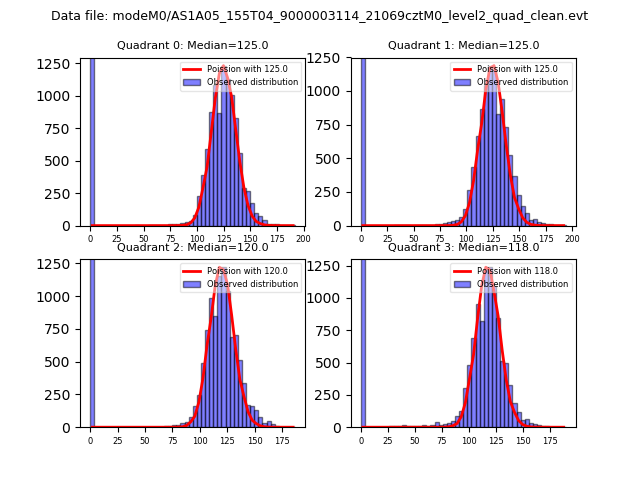 |
 |
| Quadrant-wise count rates Data is divided into 100 sec bins |
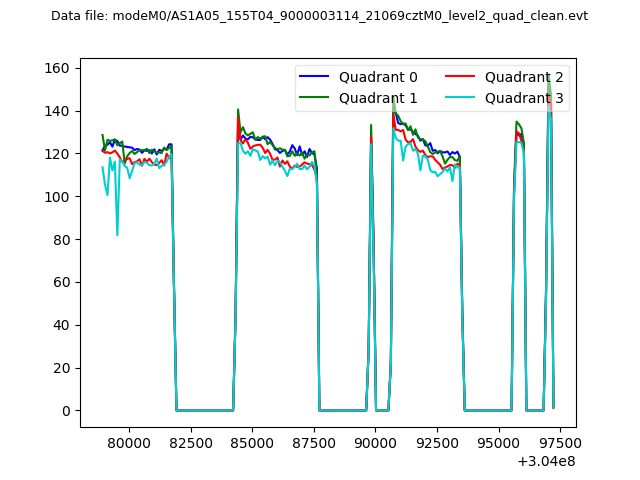 |
|
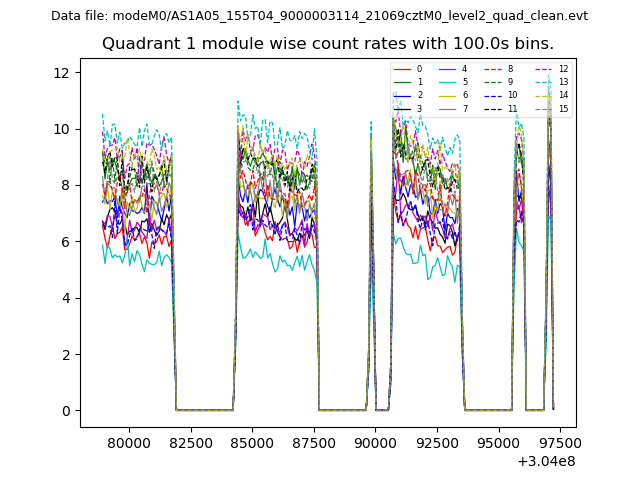
| Module-wise count rates for Quadrant A Data is divided into 100 sec bins |
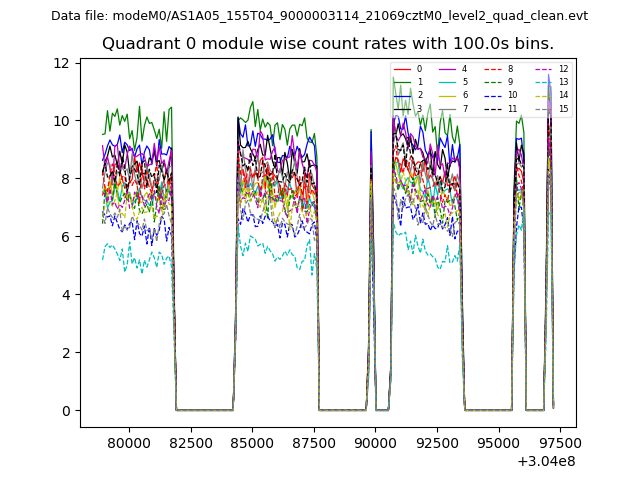 |
 |
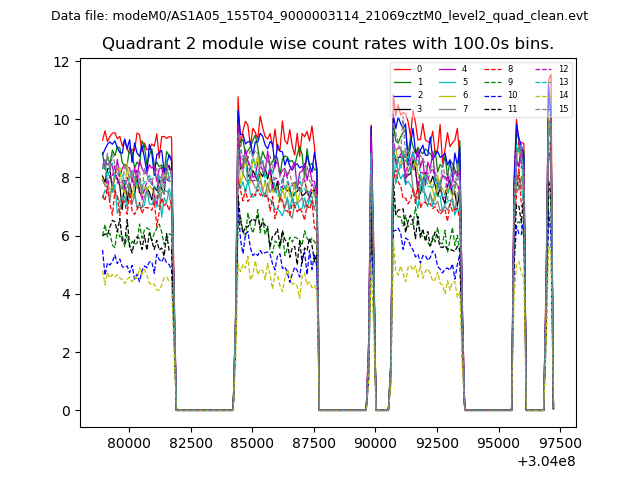
| Module-wise count rates for Quadrant B Data is divided into 100 sec bins |
 |
 |
| Module-wise count rates for Quadrant C Data is divided into 100 sec bins |
 |
 |
| Module-wise count rates for Quadrant D Data is divided into 100 sec bins |
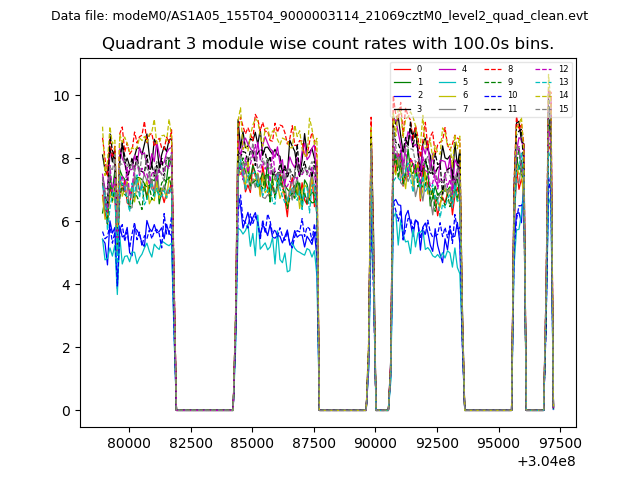 |
 |
| Parameter | Plot |
|---|---|
| CZT HV Monitor | 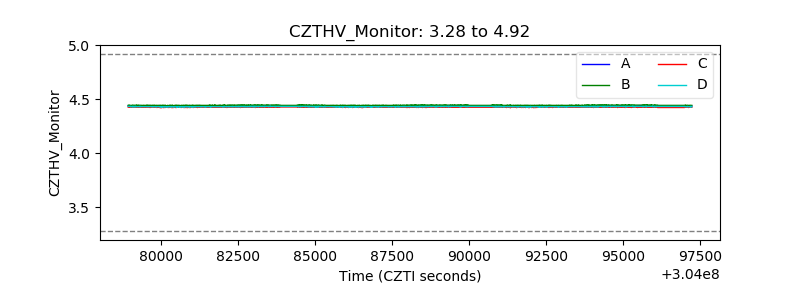 |
| D_VDD | 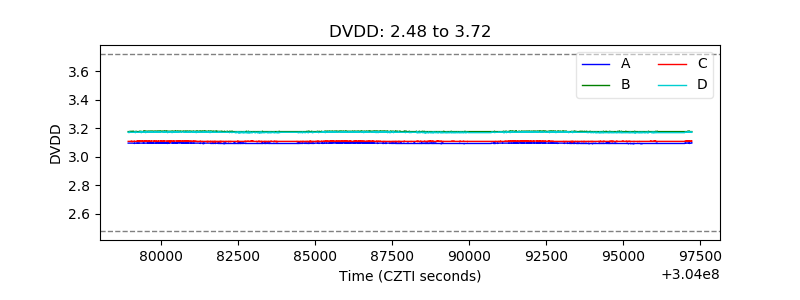 |
| Temperature 1 | 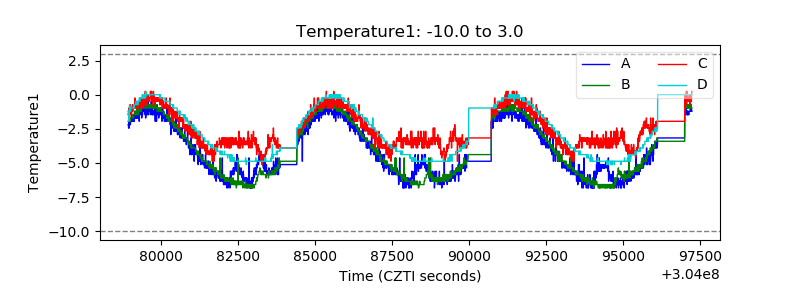 |
| Veto HV Monitor | 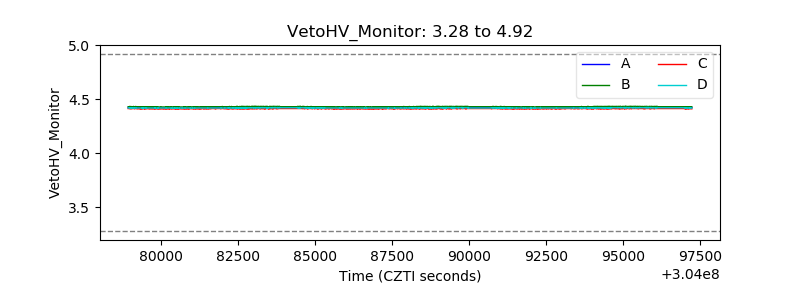 |
| Veto LLD | 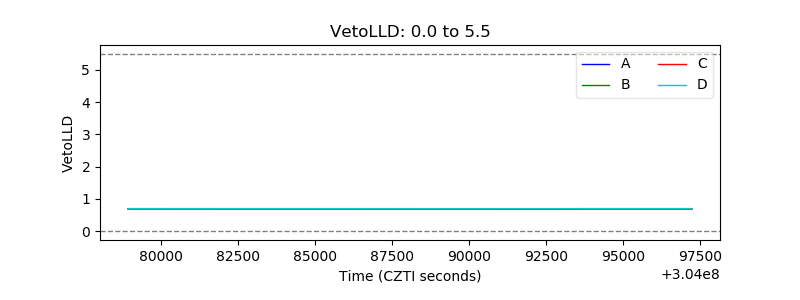 |
| Alpha Counter | 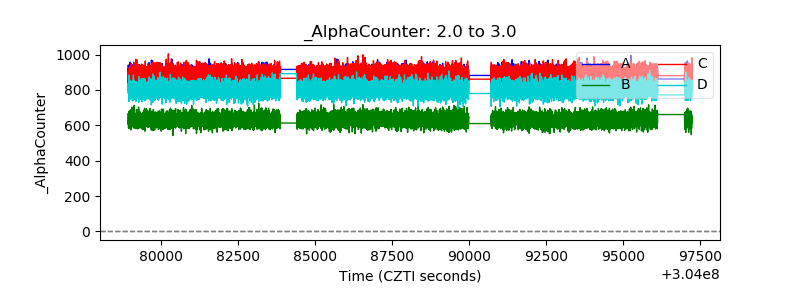 |
| _CPM_Rate | 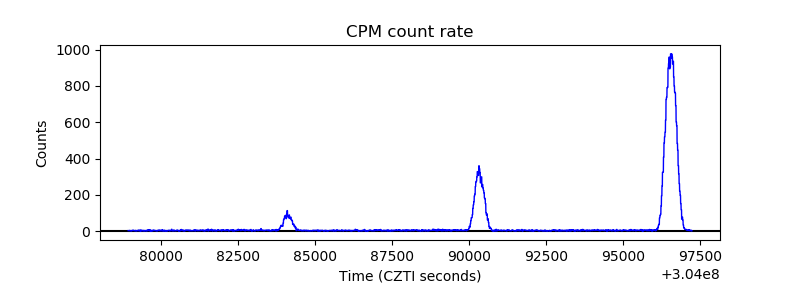 |
| CZT Counter | 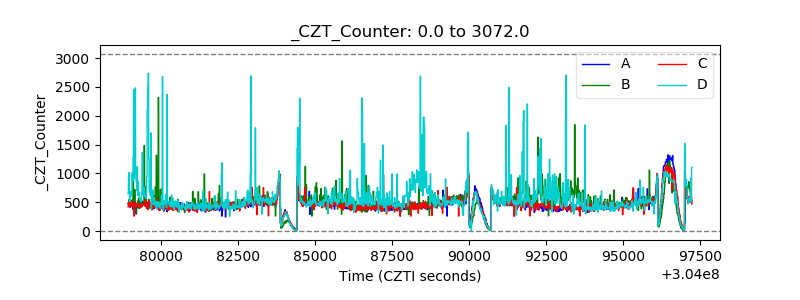 |
| +2.5 Volts monitor | 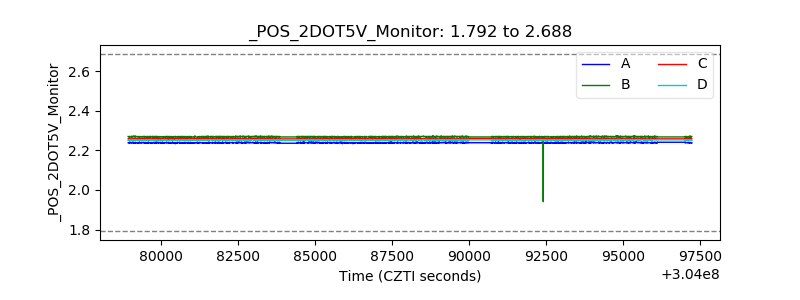 |
| +5 Volts monitor |  |
| _ROLL_ROT | 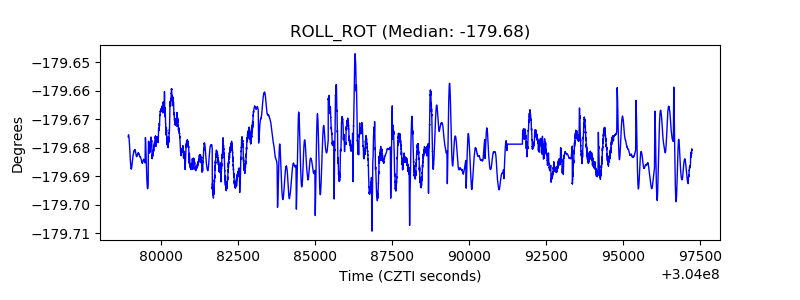 |
| _Roll_DEC | 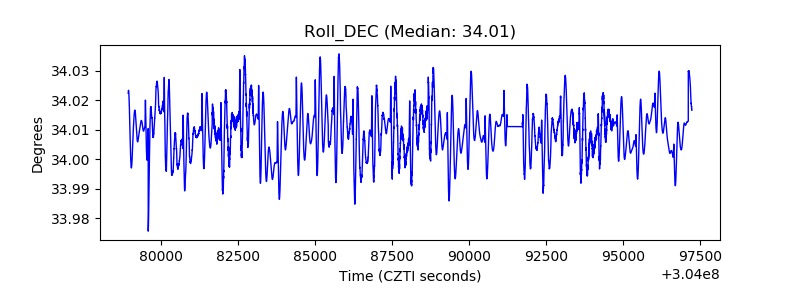 |
| _Roll_RA |  |
| Veto Counter | 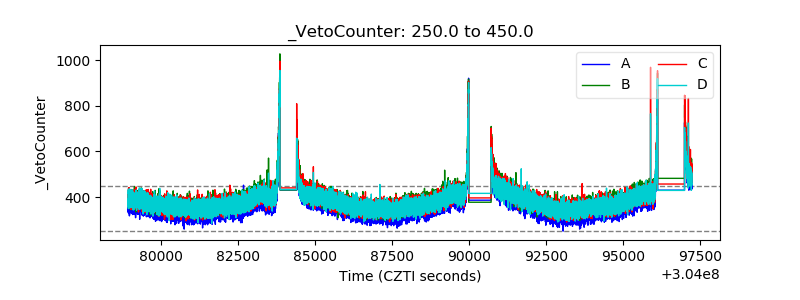 |