| Param | Original file | Final file |
|---|---|---|
| Filename | modeM0/AS1A05_163T01_9000003118cztM0_level2.fits | modeM0/AS1A05_163T01_9000003118cztM0_level2_quad_clean.evt |
| Size (bytes) | 211,576,320 | 111,579,840 |
| Size | 201.8 MB | 106.4 MB |
| Events in quadrant A | 1,336,210 | 530,449 |
| Events in quadrant B | 1,274,804 | 524,536 |
| Events in quadrant C | 1,296,102 | 501,915 |
| Events in quadrant D | 1,051,374 | 371,844 |
| Mode M9 | |||
|---|---|---|---|
| Quadrant | BADHDUFLAG | Total packets | Discarded packets |
| A | 0 | 85 | 0 |
| B | 0 | 85 | 0 |
| C | 0 | 85 | 0 |
| D | 0 | 85 | 0 |
| Mode M0 | |||
|---|---|---|---|
| Quadrant | BADHDUFLAG | Total packets | Discarded packets |
| A | 0 | 44699 | 0 |
| B | 0 | 46867 | 0 |
| C | 0 | 44452 | 0 |
| D | 0 | 70216 | 0 |
| Mode SS | |||
|---|---|---|---|
| Quadrant | BADHDUFLAG | Total packets | Discarded packets |
| A | 0 | 428 | 0 |
| B | 0 | 432 | 0 |
| C | 0 | 427 | 0 |
| D | 0 | 427 | 0 |
| Quadrant | Total seconds | Saturated seconds | Saturation percentage |
|---|---|---|---|
| A | 21094 | 204 | 0.967100% |
| B | 21086 | 308 | 1.460685% |
| C | 21066 | 284 | 1.348144% |
| D | 20919 | 2568 | 12.275921% |
Noise dominated data is calculated using 1-second bins in cleaned event files. If a bin has >2000 counts, and if more than 50% of those come from <1% of pixels, then it is considered to be noise-dominated and hence unusable.
| Quadrant | # 1 sec bins | Bins with >0 counts | Bins with >2000 counts | High rate bins dominated by noise | Noise dominated (total time) | Noise dominated (detector-on time) | Marked lightcurve |
|---|---|---|---|---|---|---|---|
| A | 60004 | 21285 | 0 | 0 | 0.00% | 0.00% |  |
| B | 59891 | 21272 | 0 | 0 | 0.00% | 0.00% |  |
| C | 59998 | 21263 | 0 | 0 | 0.00% | 0.00% |  |
| D | 59994 | 21003 | 0 | 0 | 0.00% | 0.00% |  |
Top three noisy pixels from each quadrant. If the there are fewer than three noisy pixels in the level2.evt file, extra rows are filled as -1
| Pixel properties | Quadrant properties | ||||||
|---|---|---|---|---|---|---|---|
| Quadrant | DetID | PixID | Counts | Sigma | Mean | Median | Sigma |
| A | 0 | 29 | 1266 | 10.93 | 348 | 328 | 85.8 |
| A | 7 | 110 | 1017 | 8.03 | 348 | 328 | 85.8 |
| A | 9 | 19 | 990 | 7.72 | 348 | 328 | 85.8 |
| B | 2 | 9 | 1031 | 10.54 | 337 | 324 | 67.1 |
| B | 2 | 8 | 873 | 8.19 | 337 | 324 | 67.1 |
| B | 3 | 17 | 867 | 8.1 | 337 | 324 | 67.1 |
| C | 3 | 126 | 923 | 6.78 | 342 | 322 | 88.7 |
| C | 12 | 241 | 902 | 6.54 | 342 | 322 | 88.7 |
| C | 12 | 249 | 887 | 6.37 | 342 | 322 | 88.7 |
| D | 6 | 67 | 773 | 6.18 | 300 | 274 | 80.8 |
| D | 6 | 231 | 760 | 6.01 | 300 | 274 | 80.8 |
| D | 10 | 189 | 754 | 5.94 | 300 | 274 | 80.8 |
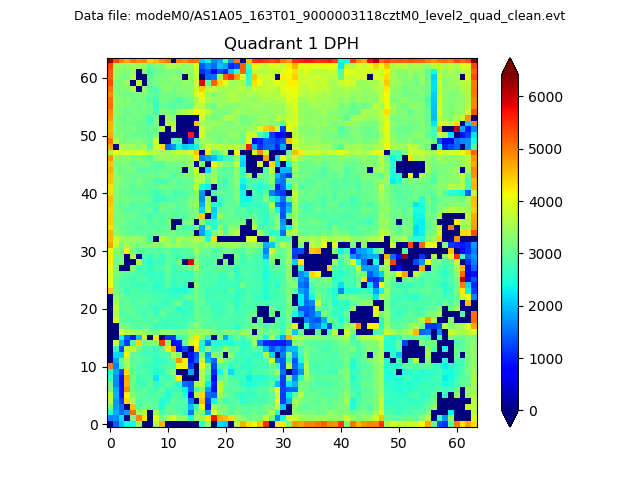
Histogram calculated using DETX and DETY for each event in the final _common_clean file
| Quadrant A |  |
 |
Quadrant B |
|---|---|---|---|
| Quadrant D | 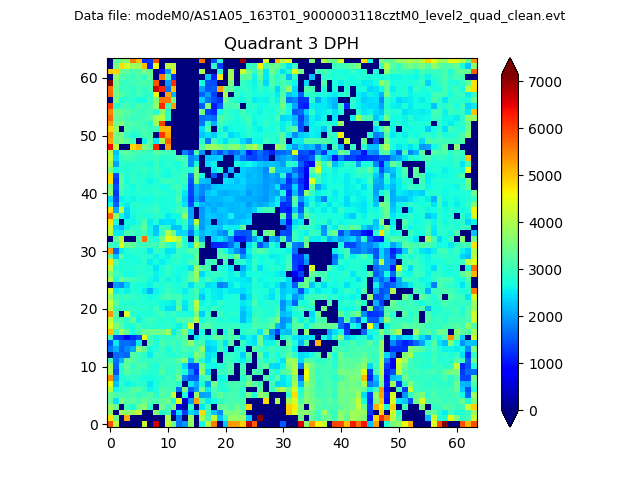 |
 |
Quadrant C |
| Plot type | Count rate plots | Images |
|---|---|---|
| Comparison with Poisson distribution Blue bars denote a histogram of data divided into 1 sec bins. Red curve is a Poisson curve with rate = median count rate of data. |
 |
 |
| Quadrant-wise count rates Data is divided into 100 sec bins |
 |
|
| Module-wise count rates for Quadrant A Data is divided into 100 sec bins |
 |
 |
| Module-wise count rates for Quadrant B Data is divided into 100 sec bins |
 |
 |
| Module-wise count rates for Quadrant C Data is divided into 100 sec bins |
 |
 |
| Module-wise count rates for Quadrant D Data is divided into 100 sec bins |
 |
 |
| Parameter | Plot |
|---|---|
| CZT HV Monitor |  |
| D_VDD |  |
| Temperature 1 |  |
| Veto HV Monitor |  |
| Veto LLD |  |
| Alpha Counter |  |
| _CPM_Rate |  |
| CZT Counter |  |
| +2.5 Volts monitor |  |
| +5 Volts monitor |  |
| _ROLL_ROT |  |
| _Roll_DEC |  |
| _Roll_RA |  |
| Veto Counter |  |