| Param | Original file | Final file |
|---|---|---|
| Filename | modeM0/AS1A05_163T01_9000003118_21084cztM0_level2.evt | modeM0/AS1A05_163T01_9000003118_21084cztM0_level2_quad_clean.evt |
| Size (bytes) | 338,699,520 | 49,507,200 |
| Size | 323.0 MB | 47.2 MB |
| Events in quadrant A | 2,011,422 | 311,080 |
| Events in quadrant B | 2,324,902 | 308,392 |
| Events in quadrant C | 2,030,895 | 300,851 |
| Events in quadrant D | 3,607,087 | 285,693 |
| Mode M9 | |||
|---|---|---|---|
| Quadrant | BADHDUFLAG | Total packets | Discarded packets |
| A | 0 | 10 | 0 |
| B | 0 | 10 | 0 |
| C | 0 | 10 | 0 |
| D | 0 | 10 | 0 |
| Mode M0 | |||
|---|---|---|---|
| Quadrant | BADHDUFLAG | Total packets | Discarded packets |
| A | 0 | 8719 | 1 |
| B | 0 | 9612 | 1 |
| C | 0 | 8671 | 1 |
| D | 0 | 13594 | 1 |
| Mode SS | |||
|---|---|---|---|
| Quadrant | BADHDUFLAG | Total packets | Discarded packets |
| A | 0 | 84 | 0 |
| B | 0 | 84 | 0 |
| C | 0 | 84 | 0 |
| D | 0 | 84 | 0 |
| Quadrant | Total seconds | Saturated seconds | Saturation percentage |
|---|---|---|---|
| A | 4158 | 56 | 1.346801% |
| B | 4158 | 117 | 2.813853% |
| C | 4158 | 80 | 1.924002% |
| D | 4158 | 520 | 12.506013% |
Noise dominated data is calculated using 1-second bins in cleaned event files. If a bin has >2000 counts, and if more than 50% of those come from <1% of pixels, then it is considered to be noise-dominated and hence unusable.
| Quadrant | # 1 sec bins | Bins with >0 counts | Bins with >2000 counts | High rate bins dominated by noise | Noise dominated (total time) | Noise dominated (detector-on time) | Marked lightcurve |
|---|---|---|---|---|---|---|---|
| A | 5113 | 4159 | 0 | 0 | 0.00% | 0.00% | 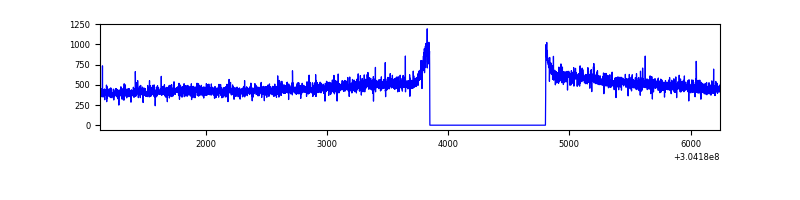 |
| B | 5113 | 4159 | 29 | 29 | 0.57% | 0.70% | 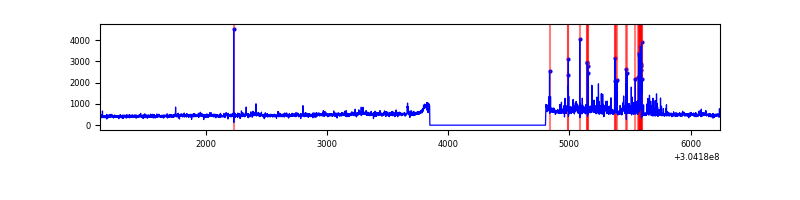 |
| C | 5113 | 4159 | 0 | 0 | 0.00% | 0.00% | 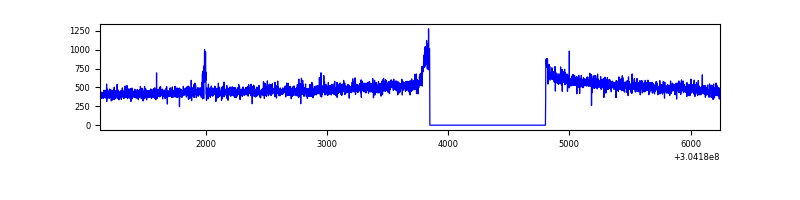 |
| D | 5113 | 4159 | 386 | 386 | 7.55% | 9.28% | 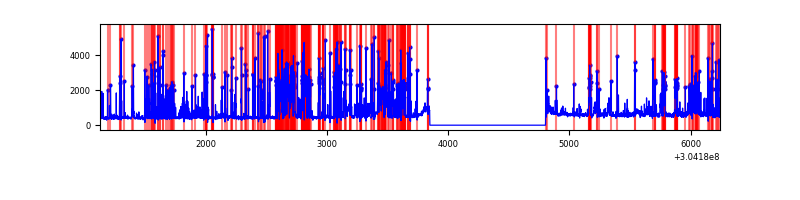 |
Top three noisy pixels from each quadrant. If the there are fewer than three noisy pixels in the level2.evt file, extra rows are filled as -1
| Pixel properties | Quadrant properties | ||||||
|---|---|---|---|---|---|---|---|
| Quadrant | DetID | PixID | Counts | Sigma | Mean | Median | Sigma |
| A | 13 | 254 | 6286 | 54.73 | 519 | 508 | 105.6 |
| A | 13 | 34 | 5582 | 48.06 | 519 | 508 | 105.6 |
| A | 0 | 226 | 4477 | 37.59 | 519 | 508 | 105.6 |
| B | 7 | 220 | 215273 | 2148.17 | 515 | 501 | 100.0 |
| B | 0 | 219 | 36124 | 356.3 | 515 | 501 | 100.0 |
| B | 0 | 190 | 18605 | 181.08 | 515 | 501 | 100.0 |
| C | 14 | 238 | 77663 | 643.4 | 499 | 502 | 119.9 |
| C | 9 | 54 | 8360 | 65.52 | 499 | 502 | 119.9 |
| C | 13 | 61 | 3493 | 24.94 | 499 | 502 | 119.9 |
| D | 1 | 52 | 923107 | 7601.02 | 486 | 472 | 121.4 |
| D | 1 | 239 | 547380 | 4505.64 | 486 | 472 | 121.4 |
| D | 2 | 14 | 87662 | 718.3 | 486 | 472 | 121.4 |
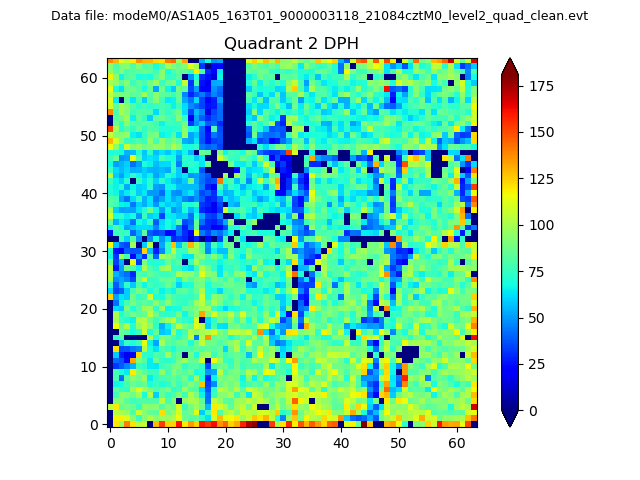
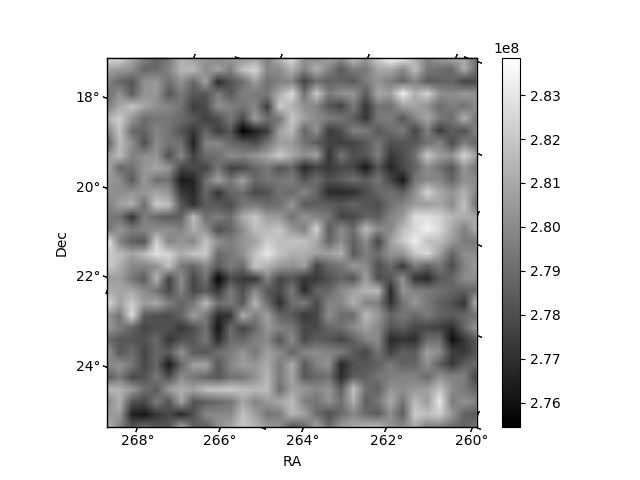
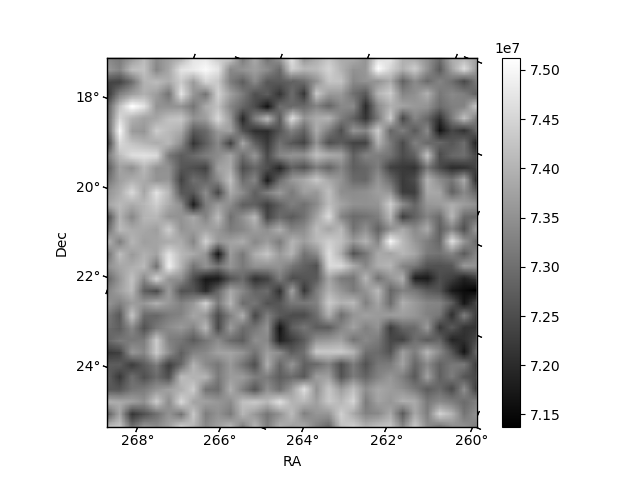
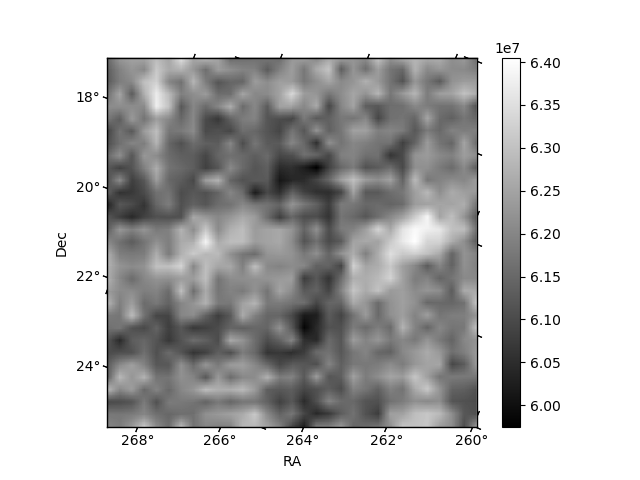
Histogram calculated using DETX and DETY for each event in the final _common_clean file
| Quadrant A | 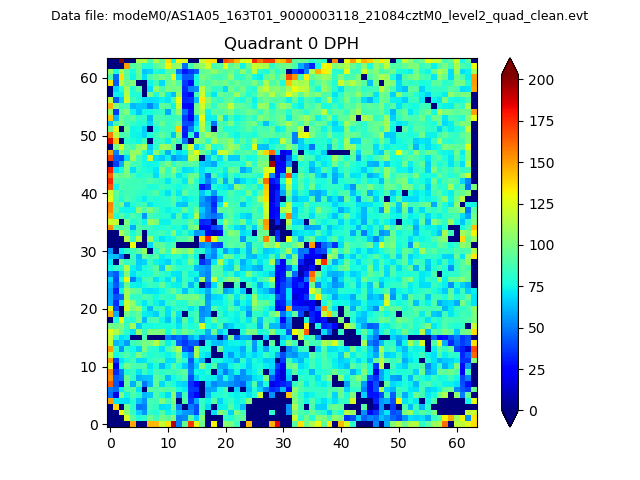 |
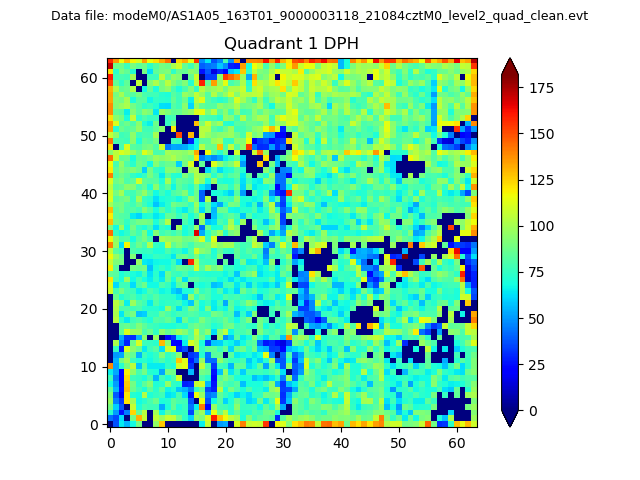 |
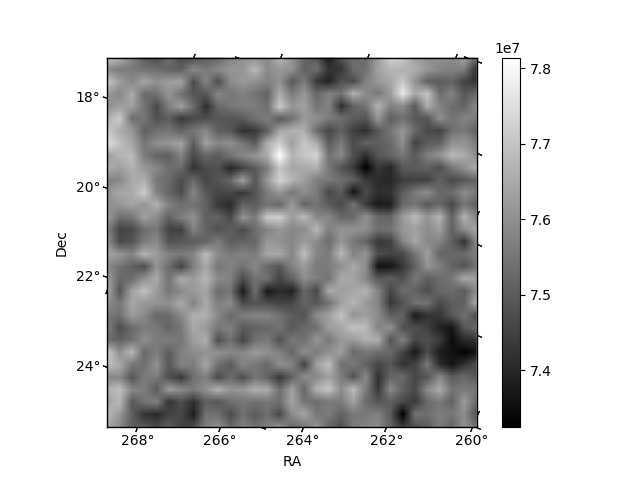
Quadrant B |
|---|---|---|---|
| Quadrant D | 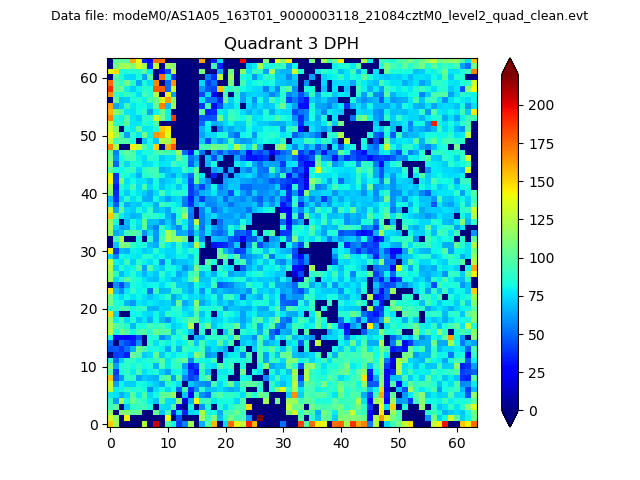 |
 |
Quadrant C |
| Plot type | Count rate plots | Images |
|---|---|---|
| Comparison with Poisson distribution Blue bars denote a histogram of data divided into 1 sec bins. Red curve is a Poisson curve with rate = median count rate of data. |
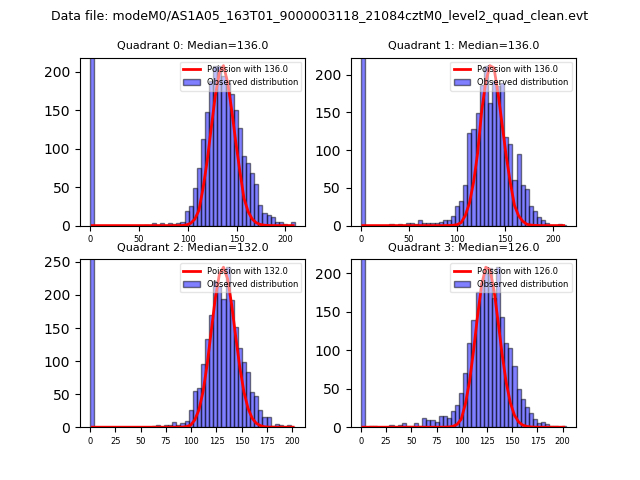 |
 |
| Quadrant-wise count rates Data is divided into 100 sec bins |
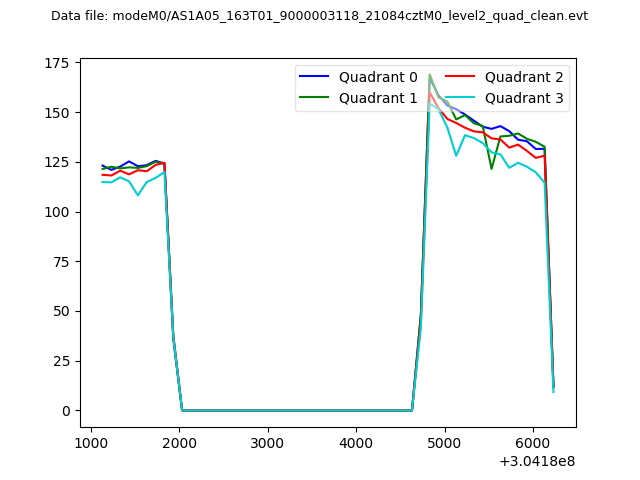 |
|
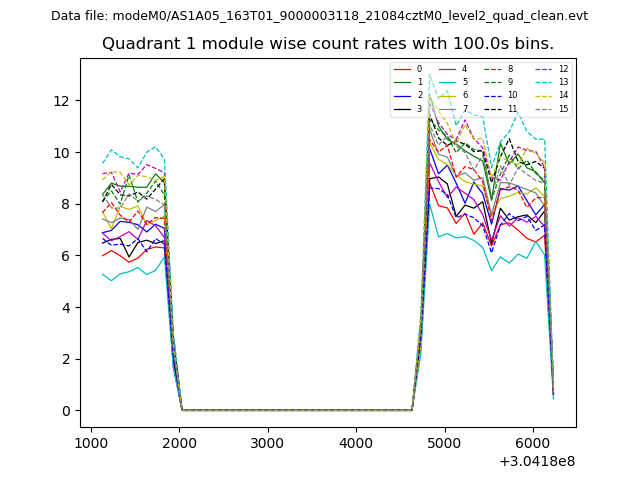
| Module-wise count rates for Quadrant A Data is divided into 100 sec bins |
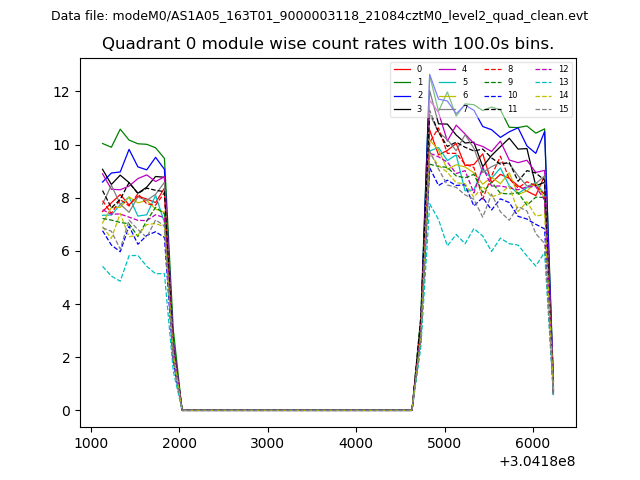 |
 |
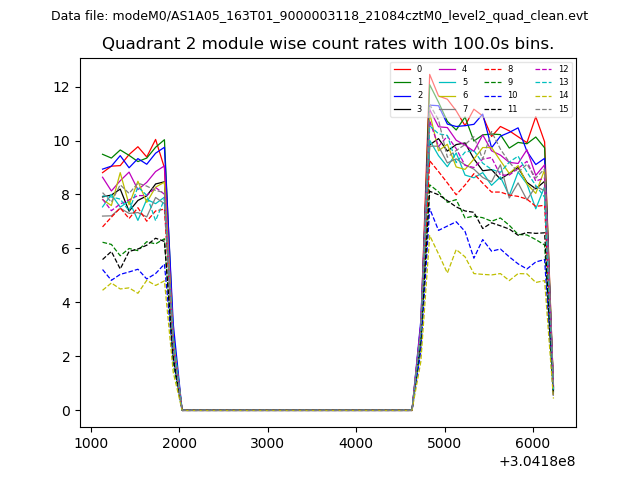
| Module-wise count rates for Quadrant B Data is divided into 100 sec bins |
 |
 |
| Module-wise count rates for Quadrant C Data is divided into 100 sec bins |
 |
 |
| Module-wise count rates for Quadrant D Data is divided into 100 sec bins |
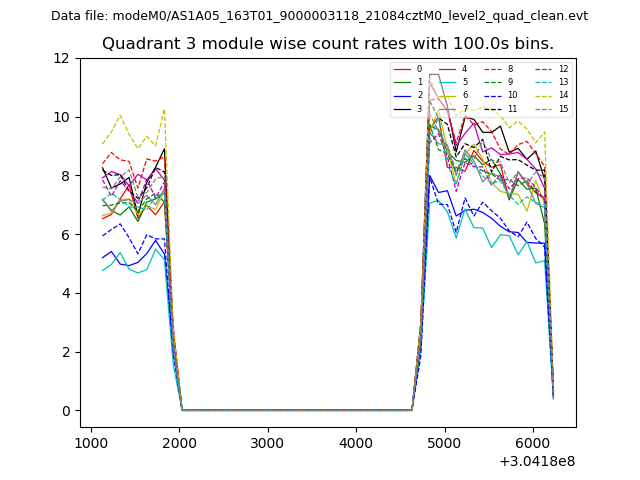 |
 |
| Parameter | Plot |
|---|---|
| CZT HV Monitor | 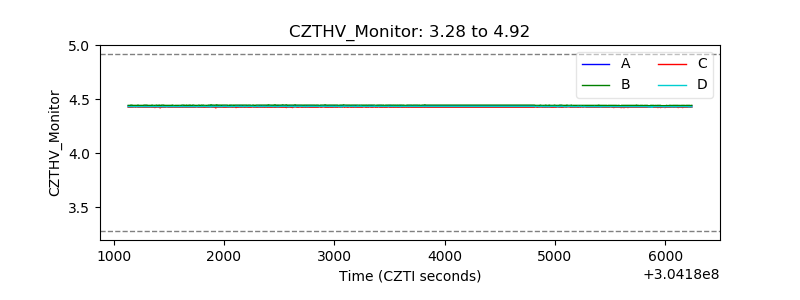 |
| D_VDD | 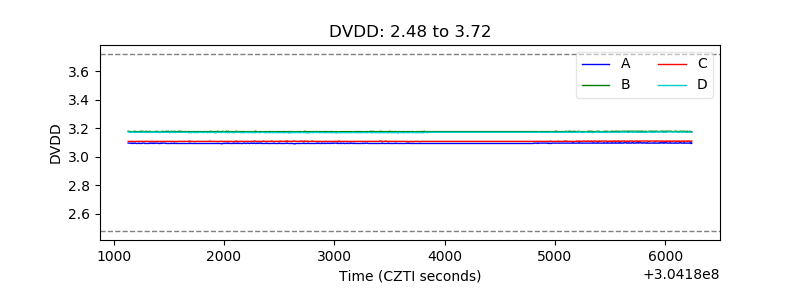 |
| Temperature 1 | 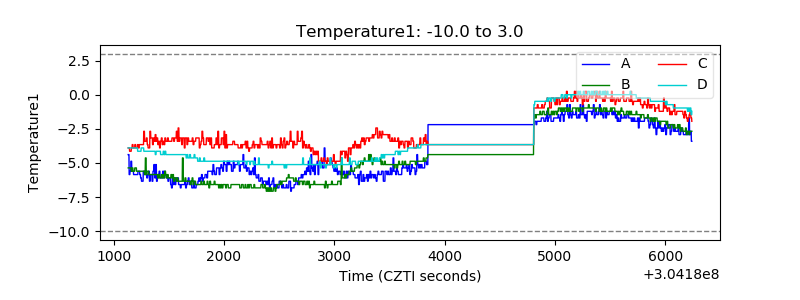 |
| Veto HV Monitor | 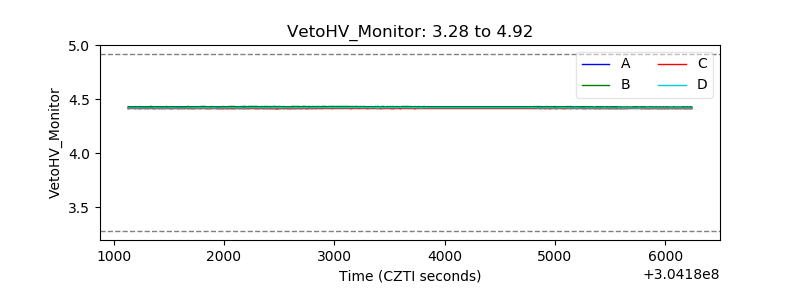 |
| Veto LLD | 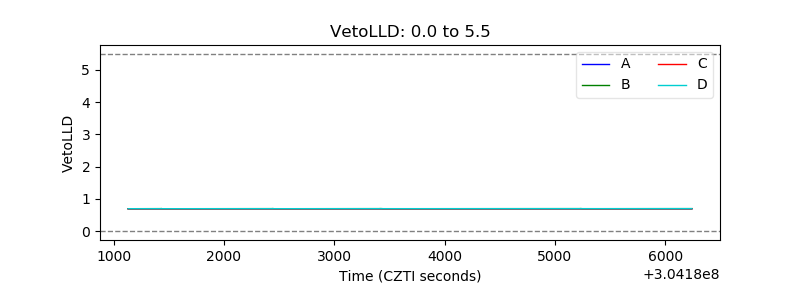 |
| Alpha Counter | 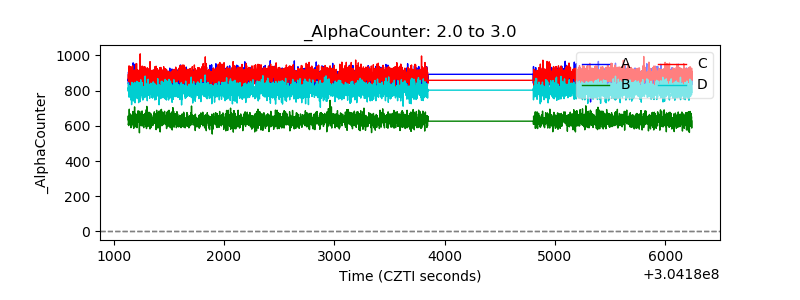 |
| _CPM_Rate | 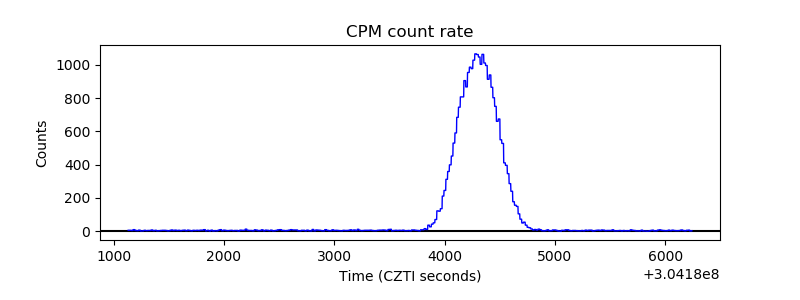 |
| CZT Counter | 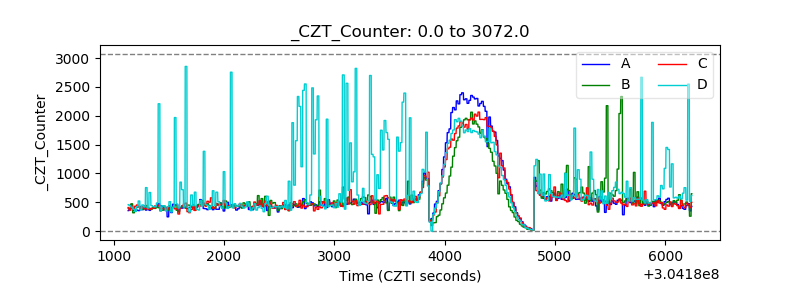 |
| +2.5 Volts monitor | 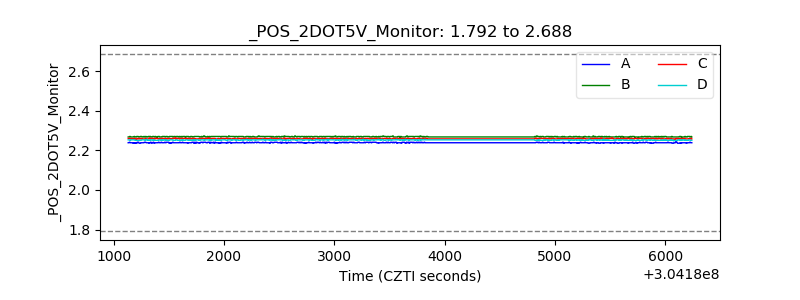 |
| +5 Volts monitor |  |
| _ROLL_ROT | 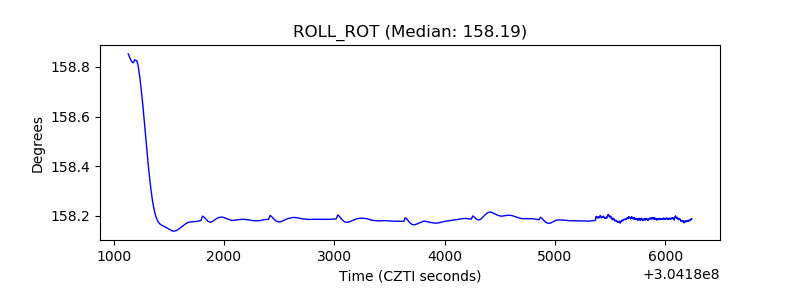 |
| _Roll_DEC | 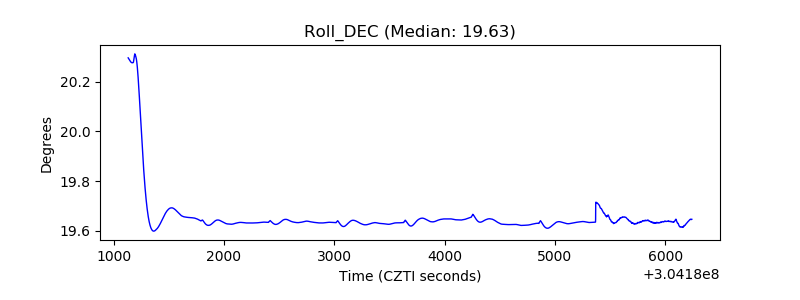 |
| _Roll_RA | 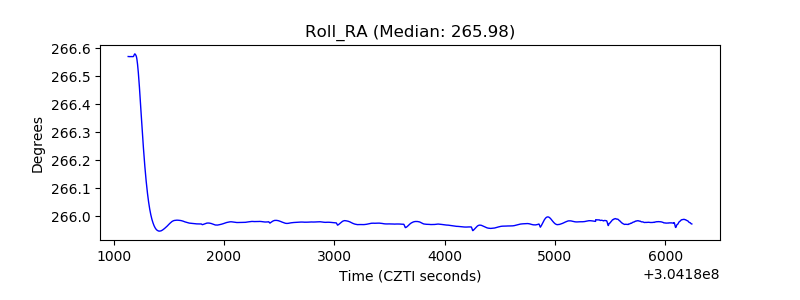 |
| Veto Counter | 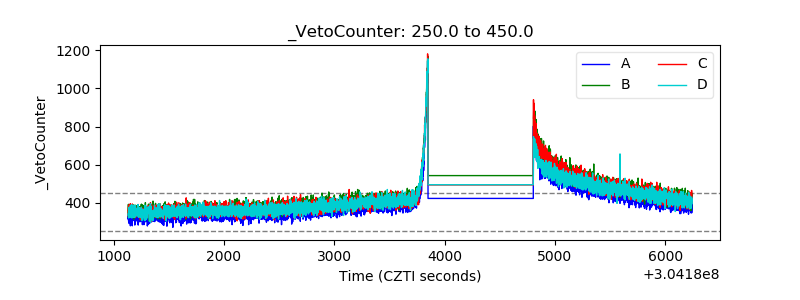 |